

SUMMARY
Zika virus infection was declared a public health emergency of international concern in February 2016 in response to the outbreak in Brazil and its suspected link with congenital anomalies. In this study, we use notification data and disease natural history parameters to estimate the basic reproduction number (R0) of Zika in Rio de Janeiro, Brazil. We also obtain estimates of R0 of dengue from time series of dengue cases in the outbreaks registered in 2002 and 2012 in the city, when DENV-3 and DENV-4 serotypes, respectively, had just emerged. Our estimates of the basic reproduction number for Zika in Rio de Janeiro based on surveillance notifications (R0 = 2·33, 95% CI: 1·97–2·97) were higher than those obtained for dengue in the city (year 2002: R0 = 1·70 [1·50–2·02]; year 2012: R0 = 1·25 [1·18–1·36]). Given the role of Aedes aegypti as vector of both the Zika and dengue viruses, we also derive R0 of Zika as a function of both dengue reproduction number and entomological and epidemiological parameters for dengue and Zika. Using the dengue outbreaks from previous years allowed us to estimate the potential R0 of Zika. Our estimates were closely in agreement with our first Zika's R0 estimation from notification data. Hence, these results validate deriving the potential risk of Zika transmission in areas with recurring dengue outbreaks. Whether transmission routes other than vector-based can sustain a Zika epidemic still deserves attention, but our results suggest that the Zika outbreak in Rio de Janeiro emerged due to population susceptibility and ubiquitous presence of Ae. aegypti.
Key words: Basic reproduction number, dengue, Zika
INTRODUCTION
In February 2016, Zika virus (ZIKV) infection was declared a public health emergency of international concern [1] in response to the outbreak in Brazil and its suspected link with congenital anomalies [2–4]. This came as a surprise, as since its first isolation in 1947 in the Zika forest in Uganda [5] the virus had been associated with benign disease and had remained mostly unnoticed. Isolated outbreaks have been reported before in Africa and Asia/Oceania, but all of them involved small populations [6]. In Brazil, ZIKV found a large pool of susceptible individuals, and the range of possible clinical outcomes became apparent, including birth defects, neurological and auto-immune disorders [3]. According to outbreak reports [7], the epicentre of the American epidemic was in North-East Brazil, where ZIKV emerged in mid-2014, although a molecular study [8] suggested introduction took place in 2013. In 2016, all 26 Brazilian states had confirmed local transmission of ZIKV. In the Americas, 34 countries and territories had already confirmed autochthonous ZIKV cases by April 2016. Transmission of ZIKV to humans is mostly attributed to mosquitoes of the genus Aedes (Stegomyia). Infected mosquitoes were found in localities reporting outbreaks, in Gabon Aedes albopictus mosquitoes and in Yap Island Aedes hensilii mosquitoes [6]. Ae. aegypti mosquitoes are widely suspected to be the primary vector in urban centres in the Americas, based on its widespread distribution and role as dengue vector. In the recent Zika epidemic in Rio de Janeiro, Aedes aegypti mosquitoes were found naturally infected with ZIKV [9].
Rio de Janeiro is among the most dengue-affected cities in Brazil. Rio is a large urban centre with 6·5 million inhabitants, which was the port-of-entry in the country of three of four current circulating dengue viruses. Climatic and environmental conditions favour year-round transmission of dengue, with a well-characterized seasonal profile. The city has also recently been in the international spotlight due to major sporting events, including 2014 FIFA World Cup and the 2016 Summer Olympic and Paralympic Games.
Quantitative knowledge about the transmission risk of arboviruses is vital to disease surveillance. Estimation of the basic reproduction number, R0, provides a measurement of the transmission potential of the virus. Such measurement is important to support preparedness plans and to assess risk of epidemic emergence into disease-free areas. Moreover, estimation of R0 can also contribute to the understanding of the epidemiology of this disease and how it changes geographically and temporally.
Here, we report estimates of R0 of Zika in Rio. We apply two methods for estimation of Zika's basic reproduction number, which mainly differ by whether or not they use Zika notification data. First, we estimate R0 from Zika notification cases in the city of Rio de Janeiro in 2016. For comparison with dengue epidemics in the same area in previous years, we also estimate the basic reproduction number of dengue using notification cases from two outbreaks occurring just after introductions of dengue serotypes 3 and 4 in the city [10, 11]. We then derive the expected basic reproduction number of Zika as function of the R0 estimates for dengue and compare these estimates with the ones obtained from notification data. Our results show that estimating R0 for Zika using information from dengue outbreaks yields estimates in agreement with estimates obtained directly from Zika notification data. Hence, using information on dengue permits us to gain insight into the risk of Zika transmission prior to the introduction of the virus in an at-risk area with the presence of the vector.
METHODS
Data
Infectious disease surveillance in Brazil is handled by the Brazilian Notifiable Diseases Information System (SINAN), where each suspected, and eventually confirmed, case of Zika infection is notified as ICD-10 diagnosis code A92·8 (other specified mosquito-borne viral fevers). Dengue surveillance in Brazil dates back to the 1990s, and suspected cases are notified in the SINAN as ICD-10 diagnosis code A90 (Dengue fever) or A91 (Dengue haemorrhagic fever). Dengue serotype DENV-3 was first observed in the state of Rio de Janeiro, in the neighbouring Nova Iguaçu city, in January 2001 [10], while the serotype DENV-4 was first observed in Rio de Janeiro state in Niterói city in March 2011 [11].
In order to calculate dengue's reproduction number, we assume that the epidemics of 2002 and 2012 in the city of Rio de Janeiro were mainly caused by serotypes DENV-3 and DENV-4, respectively. These are taken to represent the introduction of new serotypes, for which the population had no previous immunity. This is important in order to make estimates comparable with Zika.
Case notification time series of dengue and Zika were constructed by aggregation by epidemiological week. Both Zika and dengue notification data are stratified by ten health districts (HDs), which are essentially health surveillance sub-areas in the city of Rio de Janeiro.
Estimation of exponential growth rate from the epidemic curve
In order to estimate the weekly exponential rate of the epidemic curve, given by the number of cases infected by Zika, we fitted a linear model of the logarithm of notification counts adjusted by time, given by the number of weeks of the early outbreak period. We take the 43rd epidemic week of 2015 (from 18 to 24 October 2015) as the starting week, after which notification of suspected cases of Zika became mandatory in the city of Rio de Janeiro. In order to select the end of the early outbreak period, we apply the time windows, which minimize the sum of residuals.
We also estimated the exponential rates for each one of the 10 HDs of Rio de Janeiro, using a mixed linear model, where the number of reported cases in each HD is proportional to exp{ΛHD · t}, with ΛHD = Λ0 + λHD. Parameter Λ0 is a baseline rate, and λHD is a zero-mean random effect by district. We use the same early outbreak period defined in the overall case in order to estimate the exponential rate by HD.
Estimation of the basic reproduction number (R0) from notification data
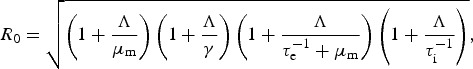
We apply the R0 formulation proposed by Pinho et al. [12] to model the dynamics of dengue fever to assess both Zika's and dengue's basic reproduction number in the city of Rio de Janeiro from SINAN data collected from described outbreaks of these diseases. The model considers vector-borne transmission, by defining compartments of susceptible, exposed and infected mosquitoes, and for humans, susceptible, exposed, infected and recovered. Hence, the disease transmission involves a cycle of two infectious generations, mosquitoes and humans. The concept of basic reproduction number gives us the average number of secondary cases per generation after an initial infected individual. This approach relies on the assumption that the number of cases in the early outbreak grows exponentially, hence proportional to exp{Λ · t}, where t is the time in weeks since the outbreak start and Λ is the exponential growth rate of the number reported cases. An estimate of the basic reproduction number is given by the following equation:
 |
1 |
where γ is the human recovery rate, μm is the mosquito mortality rate, τi is the median intrinsic incubation period in humans, and τe is the median extrinsic incubation period in mosquitoes. In equation (1), we neglect adult mosquito control, cm, as well as human mortality rate, μh, which are present in the original formula in [12]. The former is taken to be zero since no structured intervention was taking place during the time window analysed. Regarding the latter, the human mortality rate in Brazil is orders of magnitude lower than the intrinsic incubation period and human recovery rate, which are of the order of a few days. The life expectancy at birth in Brazil was of 75 years in 2014. Therefore, we can safely neglect the human mortality rate μh for our purposes of estimating R0. We compiled a range of values for the necessary parameters taken from previous studies in Table 1.
Table 1.
Zika and Dengue fever natural history parameters collated from the literature
| Parameter | Zika | Dengue |
|---|---|---|
| Infectious period in human, γ−1 (days) | (2·9–8·8) [17] | (1·9–7·9) [17] |
| Intrinsic incubation period in humans, τi (days) | (4·4–7·6) [14, 17] | (3–10) [37, 16] |
| Extrinsic incubation period in mosquitoes, τe (days) | (4·4–17) [17] | (4·3–15) [16, 17] |
| Mosquito mortality rate, μm (days−1) | (0·07–0·43) [18–20] | (0·07–0·43) [18–20] |
| Transmission efficiency parameter, βm | (0·606–0·933) [29] | (0·426–0·590) [38] |
Potential basic reproduction number of Zika
Massad et al. [13] derived a mathematical method for estimating the reproduction number of yellow fever indirectly using an estimation of dengue's basic reproduction number obtained using the exponential growth method. The underlying assumption was that both diseases share the same vector, and consequently, some parameters of their R0 expressions are the same. For instance, this approach does not require knowledge of the density of mosquitoes, which is usually hard to estimate.
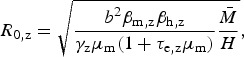
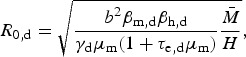
We use this rationale to derive an expression for Zika's basic reproduction number in a dengue endemic area, assuming that mosquitoes bite at the same rate and survive with the same daily probability, regardless of the virus they are infected with. From the R0 derivation found by Pinho et al. [12] for their model, we have the following expressions for the reproduction number of Zika and dengue, R0,z and R0,d, respectively:
 |
2 |
 |
3 |
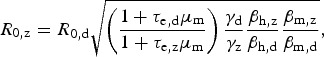
where the total mosquito population size is denoted by  , the human population size by H, the mosquito biting rate b, the proportion βm of mosquito bites in infected humans considered to be infective to the vector, and the proportion βh of infected mosquito bites effectively infective to humans – parameters are indexed by dengue (d) and Zika (z), accordingly. Some of these parameters are difficult to estimate, but by taking the ratio between equations (2) and (3), we obtain R0,z indirectly from R0,d:
 |
4 |
which is convenient because some parameters are cancelled out. If one assumes that bites from mosquitoes infected with any of these two viruses are equally likely to infect susceptible humans, that is, βh,z = βh,d, it is possible to estimate the basic reproduction rate of Zika based on that of dengue obtained from previous epidemics, assuming infection routes are the same. On the other hand, by estimating Rz and Rd independently (direct approach), one can use equation (4) to estimate the ratio βh,z/βh,d if the remaining parameters are known, still assuming that transmission dynamics are identical.
Hence, this method requires a time series of dengue cases and knowledge of entomological parameters describing the vectorial competence, incubation period and human recovery rate. Such estimation can be applied to areas that have experienced dengue outbreaks with potential to develop a Zika epidemic.
From the two methods used in this work, the one proposed by Pinho et al. [12] assumes the number of cases to exhibit an exponential increase; hence, R0 >1. However, the second method might theoretically yield R0,z <1, depending on infectivity parameters, incubation periods and recovery rates of both dengue and Zika even if the number of dengue cases is assumed to grow exponentially (i.e. R0,d >1).
Parameter uncertainty
The use of equations (1) and (4) requires knowledge about the disease natural history parameters. Table 1 presents a compilation of the literature on necessary parameters to calculate R0 according to different methods. A systematic review of the literature on Zika [14] published estimates of incubation and infection periods of ZIKV based on (only) 25 Zika cases, mostly among Europeans and North Americans returning from Zika endemic countries and found values consistent with dengue [12, 15, 16]). Another study [17], comparing outbreaks of Zika in the Pacific Islands of Micronesia, the Yap Main Islands and Fais, has found similar incubation and infection periods for Zika. The mosquito mortality rate is obtained from various reports [18–20] on mark–release–recapture experiments with Ae. aegypti mosquito population in Rio de Janeiro, which varies widely depending on different urban landscapes.
We assume that the uncertainty of each natural history parameter is represented by a Gaussian distribution whose mean and standard deviation (s.d.) are calculated based on the values presented in Table 1, where each interval is assumed to be a symmetric 99% probability interval. The uncertainty for exponential rate of case numbers is also represented by a Gaussian distribution, where the mean is given by the MLE (maximum-likelihood estimate),  , and the s.d. is given by the observed s.d. of
  . Hence, we can derive the induced distribution of R0 based on equations (1) and (4) using a Monte Carlo algorithm.
RESULTS
From January 2015 to mid-April 2016, 25 213 suspected cases of Zika were notified in the city of Rio de Janeiro. From this total number, 17 585 cases were of diseased women and 7628 cases of infected men, yielding an attack ratio of approximately 395 per hundred thousand inhabitants over the entire period. Figure 1 shows the time series of weekly incidence in the city.
Fig. 1.

Epidemic curve of Zika in Rio de Janeiro, 2015–2016 (blue bars). Red dashed line shows the exponential growth of Zika cases, with an estimated constant rate  , during the first 7 weeks.
In Table 2, we vary the total number of weeks used to estimate the exponential growth rate Λ, and based on both goodness-of-fit statistics for a linear model and Akaike Information Criterion (AIC) values, the optimal value for the number of weeks is 7 weeks. The city-wide estimated rate Λ for Zika was 0·823/week with s.d. of 0·053.
Table 2.
Estimates of exponential rate Λ for different numbers of weeks using the following linear model: log(Yt) = β0 + Λt, where Y for the number of notified cases at week t; t = 1, 2, …, T. The first week, t = 1, is the 43th epidemic week of 2015 (from the 18th to the 24th of October 2015), β0 is the intercept and the coefficient Λ is the force of infection. The residual s.d., σ, and the coefficients of determination, R2 and adjusted R2, were calculated for each adjusted model. Akaike Information Criterion (AIC) is also calculated
| Total number of weeks (T) | Intercept |  |
σ | R2 | Adjusted R2 | AIC |
|---|---|---|---|---|---|---|
| 6 | 1·305 | 0·852 | 0·296 | 0·973 | 0·966 | 6·00 |
| 7 | 1·381 | 0·823 | 0·279 | 0·980 | 0·976 | 5·65 |
| 8 | 1·583 | 0·756 | 0·358 | 0·969 | 0·964 | 9·98 |
| 9 | 1·820 | 0·685 | 0·460 | 0·950 | 0·943 | 15·29 |
| 10 | 2·091 | 0·611 | 0·579 | 0·920 | 0·910 | 21·22 |
| 11 | 2·312 | 0·556 | 0·640 | 0·902 | 0·891 | 25·20 |
We estimate the basic reproduction number for ZIKV in Rio de Janeiro from notification data at R0 = 2·33 (95% confidence interval (CI): 1·97–2·97). Table 3 presents the estimates for the basic reproduction number for Zika by HD in Rio de Janeiro. The map of Rio de Janeiro (Fig. 2) is also depicted in which HDs are shown by the estimated R0 for Zika. HDs 3·2, 3·3 and 5·2 were those with highest reproduction numbers, all R0 estimates being greater than four on average. Also, these areas are historically the areas with more notified cases of dengue. Estimates of the basic reproduction number R0 for dengue from notification data in the years of entrance of DENV-3 and DENV-4 (2002 and 2012) in Rio de Janeiro are R0 = 1·70 (95% CI: 1·50–2·02) and R0 = 1·25 (95% CI: 1·18–1·36), respectively.
Table 3.
Estimates for the basic reproduction number (R0) for Zika by health district (HD) in Rio de Janeiro
| HD |  |
2·5% | 97·5% |
|---|---|---|---|
| 1·0 | 2·09 | 1·78 | 2·54 |
| 2·1 | 1·91 | 1·54 | 2·27 |
| 2·2 | 1·98 | 1·68 | 2·31 |
| 3·1 | 2·10 | 1·91 | 2·35 |
| 3·2 | 2·35 | 2·01 | 2·80 |
| 3·3 | 2·44 | 2·15 | 2·74 |
| 4·0 | 2·12 | 1·90 | 2·54 |
| 5·1 | 2·02 | 1·74 | 2·47 |
| 5·2 | 2·55 | 2·18 | 3·07 |
| 5·3 | 2·15 | 1·94 | 2·42 |
Fig. 2.

Estimates of the basic reproduction number for Zika by health districts in Rio de Janeiro.
Applying the disease natural history parameters from Table 1 into equation (4) indicates the R0 for Zika should be 1·4 times greater than the reproduction number for dengue. Hence, we estimate Zika's basic reproduction number by the second method to find R0 = 2·45 (95% CI: 1·57–3·65) using our estimate of reproduction number of dengue in 2002, and R0 = 1·82 (95% CI: 1·19–2·68) using our estimated number from 2012. The estimates obtained using the first method are within these intervals. Table 4 summarizes the basic reproduction numbers found for Zika in the 2016 epidemic, for dengue in 2002 and 2012 and the potential Zika R0 using such dengue numbers.
Table 4.
Estimates and 95%CI for the basic reproduction number for Zika and dengue in Rio de Janeiro. We report estimates for Zika in 2015 and for dengue in 2002 and 2012 obtained using equation (1). Estimates of Zika's basic reproduction number using dengue data are obtained using equation (4) (see Methods)
 |
2·5% | 97·5% | |
|---|---|---|---|
| Zika | 2·33 | 1·97 | 2·97 |
| Dengue 2002 | 1·70 | 1·50 | 2·02 |
| Dengue 2012 | 1·25 | 1·18 | 1·36 |
| Zika using dengue 2002 | 2·45 | 1·57 | 3·65 |
| Zika using dengue 2012 | 1·82 | 1·19 | 2·68 |
DISCUSSION
The basic reproduction number of Zika in Rio de Janeiro was estimated at 2·33 (95% CI: 1·97–2·97) given the number of notifications collected at the SINAN database. This value is consistent with estimates for French Polynesia, which varied from 1·5 to 3·1 [21, 22], but lower than those calculated for the Yap Island, ranging from 4·5 to 5·813 [21].
Estimates of Zika reproduction number in countries of Latin America reported by Ferguson et al. [23] have been used to obtain projection scenario and evaluate intervention policies. This study used a methodology different than ours, since they evaluate the reproduction number over time for several countries, including Brazilian states. We focus here on Zika and dengue notification data for the city of Rio de Janeiro to provide a comparison between reproduction numbers in local outbreaks and the basic reproduction number of Zika for multiple areas across the city. We also evaluate a method to estimate Zika's R0 without Zika notification data, using R0 estimates for dengue and disease natural history parameters such as vectorial competence to Zika. We find that this method yields estimates consistent with those obtained directly from notification data. The estimate of the reproduction number by Ferguson et al. [23] in the early 2016 epidemic in the state of Rio de Janeiro was in the range from 1·7 to 2·2, hence close to our estimates for the Zika outbreak in the city, after we adjusted the state estimates to be consistent with using R0 by generation, since a human-to-human reproduction number was reported (square root analysis).
Our estimates for Zika are also within the range of other viral diseases transmitted by Ae. aegypti, as dengue and Chikungunya, as reported in the literature [24]. Dengue serotypes 3 and 4 were introduced in Rio de Janeiro in 2002 and 2012, respectively. Assuming the population was mostly naive to these viruses allows us to compare Zika's basic reproduction number to dengue's R0 within the same city under an invasion scenario. Zika's R0 in 2015 was 1·4 times greater than that of dengue epidemic of 2002, just after introduction of DENV-3, and 1·9 times greater than the estimation for dengue epidemic in 2012, just after introduction of DENV-4. These differences in transmission can be attributed to several factors. Vector competence possibly differed between strains, either due to ecological, physiological and genetic mechanisms [25] or year-specific (seasonal) factors [26].
The first wave of the Zika epidemic in Rio de Janeiro showed exponential growth during 7 weeks, and plateau at around 1500 cases per week during the whole summer of 2015–2016 (Fig. 1). During this same period, dengue notification increased from 200 cases per week in November to 500 in February 2016 and to 1000 in April 2016 (http://info.dengue.mat.br). This growth of dengue cases, along with high temperatures observed in this El Niño year, indicate that conditions for mosquito-borne transmission existed.
Distinct factors such as climate, mosquito density and human living conditions vary widely across the city. Forested mountains cross the city, creating micro-climates in the valleys where most of the population lives and imposing variation in mosquito densities. Human population density and susceptibility to emerging diseases are impacted by inequalities and socio-economic factors. Therefore, we expect high levels of heterogeneity due to multiple conditions. When estimating mean basic reproduction numbers in this scenario, uncertainties exist due to these heterogeneities. We indeed find that mean R0 varies at the HD level from 1·91 to 2·55, indicating heterogeneity across the city. Understanding spatial variation is important, as those who live far apart are less likely to infect one another than those who live in closer proximity to each other. Spatial heterogeneity is known to slow down epidemics and this could be an explanation for the pattern observed [27].
Estimation of basic reproduction number of vector-borne diseases requires estimation of the vectorial competence, along with other parameters. Numerous studies by different research teams involve mosquito populations exhibiting genetic diversity, and quite possibly under distinct laboratory conditions or in the field involving different experimental designs such as capture–recapture experiments. When estimating a unique indicator such as R0 from many different sources, uncertainties implicit by different measurements should be recognized. A Bayesian perspective applied in this setting considers all information available regarding the uncertainty for each unknown parameter to estimate marginal probability distributions, and then the induced probability distribution for R0 is numerically derived. The joint distribution for all parameters should be used; however, our approach does not consider the correlation structure between different parameters, which is often not known. In a fully Bayesian approach, a probabilistic model for the number of notified Zika cases should be devised with the underlying transmission dynamics. In this case, the probability distribution for the parameters would be treated as prior distributions, and using Bayes theorem combined with numerical integration methods such as Markov chain Monte Carlo (MCMC), we could derive the joint posterior distribution for all parameters, hence deriving the R0 posterior distribution.
A report by Chouin-Carneiro et al. [28] on the transmission efficiency of ZIKV using a ZIKV strain from New Caledonia suggested a low efficiency by Ae. aegypti mosquitoes. Considering the low transmission efficiency reported by Chouin-Carneiro et al. [28] a much lower Zika reproduction number would be expected, not excluding that R0 < 1. Conversely, Fernandes et al. [29] used combinations of ZIKV strains isolated in the city of Rio de Janeiro and a larger number of mosquitoes from local populations. This study found a much higher competence for Ae. aegypti to transmit ZIKV compared with results by Chouin-Carneiro et al. and also found no competence of Culex mosquitoes. Since a Zika epidemic was indeed observed in the city, a high competence by Ae. aegypti is a reasonable explanation, but more studies are recommended towards a more definite vectorial competence.
Other modes of transmission have been reported, such as vertical and sexual transmission in humans, and the potential role of other mosquitoes or natural reservoirs have been raised. Multiple Zika cases in different countries were reported to be individual cases of sexual transmission of ZIKV [30–33]. We observed a much higher number of Zika cases in women (17 585 cases) than in men (7628 cases) in the city of Rio de Janeiro. Coelho et al. [34] describe higher incidence of Zika in adult women in the city of Rio de Janeiro, but multiple causes could account for a disproportionate number of cases among women, such as awareness due to pregnancy-related risks or even a bias in symptomatic cases. Yakob et al. [35] argue for a low risk of sexual transmission based on model proposed for HIV transmission [36].
Given our current knowledge regarding the entomological parameters of ZIKV transmission, potential R0 for Zika assessed by only such parameters and dengue's reproduction number should be about 1·4 times greater than the reproduction number of dengue. This result is in agreement with the estimates obtained from notification data. Therefore, we believe this approach can be used to evaluate the potential risk of Zika in areas with recurring epidemics of dengue. Whereas this method can be used as a risk assessment tool by Public Health authorities, spatial heterogeneity, seasonal factors and sources of uncertainty still impose obstacles in designing intervention policies.
ACKNOWLEDGEMENTS
We would like to thank Dr Claudio Struchiner and Dr Marília S. Carvalho for their helpful comments during the development of this study. We also acknowledge CNPq and FAPERJ (Ref. 211356/2015) for financial support.
AUTHOR CONTRIBUTIONS
D.V., L.B., O.C., L.C., M.G., F.C. and C.C. conceived the analysis, O.C., B.D., M.L. and V.S. gathered the data, D.V., L.B and L.M. developed the computational code. All authors analysed the results and reviewed the manuscript.
DECLARATION OF INTEREST
The authors declare no competing financial interests.
REFERENCES
- 1.Gulland A. Zika virus is a global public health emergency, declares WHO. BMJ 2016; 352: i657. [DOI] [PubMed] [Google Scholar]
- 2.Calvet G, et al. Detection and sequencing of Zika virus from amniotic fluid of fetuses with microcephaly in Brazil: a case study. The Lancet Infectious Diseases 2016; 16: 653–660. [DOI] [PubMed] [Google Scholar]
- 3.Brasil P, et al. Zika virus infection in pregnant women in Rio de Janeiro. New England Journal of Medicine 2016; 375: 2321–2334. [DOI] [PMC free article] [PubMed] [Google Scholar]
- 4.Mlakar J, et al. Zika virus associated with microcephaly. New England Journal of Medicine 2016; 374: 951–958. [DOI] [PubMed] [Google Scholar]
- 5.Dick G, Kitchen S, Haddow A. Zika virus (I). Isolations and serological specificity. Transactions of the Royal Society of Tropical Medicine and Hygiene 1952; 46: 509–520. [DOI] [PubMed] [Google Scholar]
- 6.Christofferson R. Zika virus emergence and expansion: lessons learned from dengue and chikungunya may not provide all the answers. The American Journal of Tropical Medicine and Hygiene 2016; 95: 15–18. [DOI] [PMC free article] [PubMed] [Google Scholar]
- 7.Heukelbach J, et al. Zika virus outbreak in Brazil. The Journal of Infection in Developing Countries 2016; 10: 116–120. [DOI] [PubMed] [Google Scholar]
- 8.Faria NR, et al. Zika virus in the Americas: early epidemiological and genetic findings. Science 2016; 352: 345–349. [DOI] [PMC free article] [PubMed] [Google Scholar]
- 9.de Brito AF, et al. First detection of natural infection of Aedes aegypti with Zika virus in Rio de Janeiro, Brazil. Memórias do Instituto Oswaldo Cruz 2016; 111: 655–658. [DOI] [PMC free article] [PubMed] [Google Scholar]
- 10.Nogueira RMR, et al. Dengue virus type 3 in Rio de Janeiro, Brazil. Memórias do Instituto Oswaldo Cruz 2001; 96: 925–926. [DOI] [PubMed] [Google Scholar]
- 11.Nogueira RM, Eppinghaus AL. Dengue virus type 4 arrives in the state of Rio de Janeiro: a challenge for epidemiological surveillance and control. Memórias do Instituto Oswaldo Cruz 2011; 106: 255–256. [DOI] [PubMed] [Google Scholar]
- 12.Pinho STR, et al. Modelling the dynamics of dengue real epidemics. Philosophical Transactions of the Royal Society of London A: Mathematical, Physical and Engineering Sciences 2010; 368: 5679–5693. [DOI] [PubMed] [Google Scholar]
- 13.Massad E, et al. The risk of yellow fever in a dengue-infested area. Transactions of the Royal Society of Tropical Medicine and Hygiene 2001; 95: 370–374. [DOI] [PubMed] [Google Scholar]
- 14.Lessler J, et al. Times to key events in Zika virus infection and implications for blood donation: a systematic review. Bulletin of the World Health Organization 2016; 94: 841–849. [DOI] [PMC free article] [PubMed] [Google Scholar]
- 15.Aldstadt J, et al. Space-time analysis of hospitalised dengue patients in rural Thailand reveals important temporal intervals in the pattern of dengue virus transmission. Tropical Medicine & International Health 2012; 17: 1076–1085. [DOI] [PMC free article] [PubMed] [Google Scholar]
- 16.Chan M, Johansson MA. The incubation periods of dengue viruses. PLoS ONE 2012; 7: e50972. [DOI] [PMC free article] [PubMed] [Google Scholar]
- 17.Funk S, et al. Comparative analysis of dengue and Zika outbreaks reveals differences by setting and virus. PLoS Neglected Tropical Diseases 2016; 10: e0005173. [DOI] [PMC free article] [PubMed] [Google Scholar]
- 18.Dutra HLC, et al. From lab to field: the influence of urban landscapes on the invasive potential of Wolbachia in Brazilian Aedes aegypti mosquitoes. PLoS Neglected Tropical Diseases 2015; 9: e0003689. [DOI] [PMC free article] [PubMed] [Google Scholar]
- 19.Maciel-De-Freitas R, Codeço CT, Lourenco-De-Oliveira R. Daily survival rates and dispersal of Aedes aegypti females in Rio de Janeiro, Brazil. The American Journal of Tropical Medicine and Hygiene 2007; 76: 659–665. [PubMed] [Google Scholar]
- 20.David MR, Lourenço-de Oliveira R, Maciel-de Freitas R. Container productivity, daily survival rates and dispersal of Aedes aegypti mosquitoes in a high income dengue epidemic neighbourhood of Rio de Janeiro: presumed influence of differential urban structure on mosquito biology. Memórias do Instituto Oswaldo Cruz 2009; 104: 927–932. [DOI] [PubMed] [Google Scholar]
- 21.Nishiura H, et al. Transmission potential of Zika virus infection in the South Pacific. International Journal of Infectious Diseases 2016; 45: 95–97. [DOI] [PubMed] [Google Scholar]
- 22.Kucharski AJ, et al. Transmission dynamics of Zika virus in Island populations: a modelling analysis of the 2013–14 French Polynesia outbreak. PLoS Neglected Tropical Diseases 2016; 10: e0004726. [DOI] [PMC free article] [PubMed] [Google Scholar]
- 23.Ferguson NM, et al. Countering the Zika epidemic in Latin America. Science 2016; 353: 353–354. [DOI] [PMC free article] [PubMed] [Google Scholar]
- 24.Massad E, et al. Estimation of R0 from the initial phase of an outbreak of a vector-borne infection. Tropical Medicine & International Health 2010; 15: 120–126. [DOI] [PubMed] [Google Scholar]
- 25.Nguyen NM, et al. Host and viral features of human dengue cases shape the population of infected and infectious Aedes aegypti mosquitoes. Proceedings of the National Academy of Sciences of the United States of America 2013; 110: 9072–9077. [DOI] [PMC free article] [PubMed] [Google Scholar]
- 26.Liu-Helmersson J, et al. Vectorial capacity of Aedes aegypti: effects of temperature and implications for global dengue epidemic potential. PLoS ONE 2014; 9: e89783. [DOI] [PMC free article] [PubMed] [Google Scholar]
- 27.Caraco T, et al. Host spatial heterogeneity and the spread of vector-borne infection. Theoretical Population Biology 2001; 59: 185–206. [DOI] [PubMed] [Google Scholar]
- 28.Chouin-Carneiro T, et al. Differential susceptibilities of Aedes aegypti and Aedes albopictus from the Americas to Zika virus. PLoS Neglected Tropical Diseases 2016; 10: e0004543. [DOI] [PMC free article] [PubMed] [Google Scholar]
- 29.Fernandes RS, et al. Culex quinquefasciatus from Rio de Janeiro is not competent to transmit the local Zika virus. PLoS Neglected Tropical Diseases 2016; 10: e0004993. [DOI] [PMC free article] [PubMed] [Google Scholar]
- 30.Musso D, et al. Potential sexual transmission of Zika virus. Emerging Infectious Diseases 2015; 21: 359. [DOI] [PMC free article] [PubMed] [Google Scholar]
- 31.D'Ortenzio E, et al. Evidence of sexual transmission of Zika virus. New England Journal of Medicine 2016; 374: 2195–2198. [DOI] [PubMed] [Google Scholar]
- 32.Fréour T, et al. Sexual transmission of Zika virus in an entirely asymptomatic couple returning from a Zika epidemic area, France, April 2016. Eurosurveillance 2016; 21: 30254. [DOI] [PubMed] [Google Scholar]
- 33.Frank C, et al. Sexual transmission of Zika virus in Germany, April 2016. Eurosurveillance 2016; 21: 30252. [DOI] [PubMed] [Google Scholar]
- 34.Coelho FC, et al. Higher incidence of Zika in adult women in Rio de Janeiro suggests a significant contribution of sexual transmission from men to women. International Journal of Infectious Diseases 2016; 51: 128–132. [DOI] [PubMed] [Google Scholar]
- 35.Yakob L, et al. Low risk of a sexually–transmitted Zika virus outbreak. Lancet Infectious Diseases 2016; 16: 1100–1102. [DOI] [PubMed] [Google Scholar]
- 36.May RM, Anderson RM. Transmission dynamics of HIV infection. Nature 1987; 326: 137–142. [DOI] [PubMed] [Google Scholar]
- 37.Nishiura H, Halstead SB. Natural history of dengue virus (DENV)-1 and DENV-4 infections: reanalysis of classic studies. Journal of Infectious Diseases 2007; 195: 1007–1013. [DOI] [PubMed] [Google Scholar]
- 38.Gonçalves CM, et al. Distinct variation in vector competence among nine field populations of Aedes aegypti from a Brazilian dengue-endemic risk city. Parasites & Vectors 2014; 7: 320. [DOI] [PMC free article] [PubMed] [Google Scholar]