

Abstract
Chlorophyll-rich samples, such as kale, interfere with the analysis of residual pesticides and adversely affect the integrity of tandem mass spectrometers. Dispersed solid-phase (d-SPE) extraction using graphitized carbon black effectively removes pigments from kale extracts; however, it also reduces the recoveries of 30 pesticides. To overcome this, alternative sorbents, including ENVI-Carb, ChloroFiltr, and Z-Sep+, were evaluated in this study. A sorbent combination based on 50 mg of Z-Sep+ was most advantageous (21/30), good precision (< 15%), excellent pigment removal capacity, and low matrix effect. The limit of quantification (0.0001–0.0040 mg/kg) was lower than the Korean maximum residue limits levels. The proposed method was validated according to international guidelines and applied to real kale samples. The results demonstrated that d-SPE using Z-Sep+ provides an effective strategy for ensuring mass spectrometry system integrity and improving the analytical accuracy in chlorophyll-rich samples.
Supplementary information
The online version contains supplementary material available at 10.1007/s10068-022-01101-3.
Keywords: Chlorophyll, Dispersive solid-phase, Kale, Sorbent-combinations, Z-Sep
Introduction
Since it was pioneered by Anastassiades, the quick, easy, cheap, effective, rugged, and safe (QuEChERS) method has been widely used to monitor pesticide residues in various food matrices (Anastassiades et al., 2003; Kang et al., 2020; Kim et al., 2019; Kim et al., 2021). Dispersive solid-phase extraction (d-SPE) is a common clean-up procedure for the QuEChERS method, which mainly uses primary secondary amine (PSA) and octadecyl silane (C18) sorbents to remove some organic acids, sugars, and fatty acids. Additionally, the combination of sorbents, such as graphitized carbon black (GCB) and PSA, is used to effectively remove pigments, including chlorophyll and carotenoids, in foods (Arias et al., 2014; Kim et al., 2019; Muhammad et al., 2020).
Chlorophylls are water-insoluble pigments and are readily extracted from vegetables by a wide polarity range of organic solvents (Kim et al., 2020). Kale is considered a complex matrix due to the high concentrations of co-extracted pigment. Matrix interferences including chlorophyll could have influences instrumental sensitivity owing to its polarity and nonvolatile characteristics (Batlokwa et al., 2013; Rejczak and Tuzimski, 2015). Therefore, reducing analyte interference by clean-up to maintain the integrity of chromatography and MS system is necessary (Kim et al., 2020). GCB sorbent was used to remove the chlorophyll from fruit and vegetable samples to solve this problem (Song et al., 2019a). A small amount of GCB dose not effectively clean up the analyte when large quantities of pigments are present (Islam et al., 2019). However, a large amount of GCB adsorbs planar pesticides along with some weakly acidic herbicides (Han et al., 2016a; Song et al., 2019b). Therefore, excessive GCB (50 mg) is recommended only for pigment-rich samples in the Association of Official Analytical Chemists (AOAC) method when planar pesticides are absent in the analytes (Lehotay, 2007; Rejczak and Tuzimski, 2015).
Recently, Supel™ QuE Verde, ENVI-Carb, non-friable GCB, ChloroFiltr, and Z-Sep+, have been proposed as alternatives to GCB for removing pigments (Han et al., 2016b; Rutkowska et al., 2018). However, some of the sorbent alternatives to GCB have also been reported to have poor recovery rates or low removal capacity of matrix interferences depending on the food matrices and analytes (Han et al., 2014; Han et al., 2016b; Islam et al., 2019). Non-friable GCB was reported to retain planar pesticides strongly, resulting in low recoveries of some analytes in the sample (Han et al., 2014). ChloroFiltr showed low recoveries of certain analytes with planar structures (Han et al., 2016b). ENVI-Carb had less proficiently removed pigments than GCB (Islam et al., 2019). These results indicate that the effect of GCB-like sorbents on the recovery of pesticide residues in chlorophyll-rich vegetables has not been sufficiently elucidated. On the contrary, Z-Sep+ is a new-generation sorbent, based on modified silica gel containing zirconium oxide, used to remove fats and pigments (Rutkowska et al., 2020). Z-Sep+ can remove hydrophobic classes, such as chlorophyll, through the matrix contained in the extract, and its mechanism involves both size exclusion and hydrophobic interactions (Han et al., 2016a, Han et al., 2016b).
The aim of this study was to evaluate and compare the d-SPE clean-up efficiency and recoveries of pesticide residues using various alternative sorbents for matrix removal in chlorophyll-rich vegetables. A total of 30 pesticides retained easily by GCB were selected based on our previous study (Song et al., 2019a). The clean-up efficacy and recoveries were compared with those of GCB by mainly using Z-Sep+ on kale.
Materials and methods
Chemicals and reagents
The standard pesticides (purity > 95%) listed in Table S1 were purchased from AccuStandard Inc. (New Haven, CT, USA). A QuEChERS AOAC extraction kit (P/N 5982-7755) and EN extraction kit (P/N 5982-0650) were purchased from Agilent Technologies (Santa Clara, CA, USA). GCB (P/N POP23000) was obtained from CTK Corporation and ChloroFiltr® (50 mg Chlorofiltr, 50 mg PSA, 150 mg MgSO4, P/N CUMPSGG2CT) was obtained from UCT, Inc. (Bristol, PA, USA). ENVI-Carb (Supel™ QuE PSA/ENVI-Carb™, P/N 55176-U), Z-Sep+ (Supel™ QuE, P/N 55299-U), Verde (Supel™ QuE, P/N 55447-U), ammonium acetate (> 99.0%), triphenylphosphate, formic acid (> 99.9%), and magnesium sulfate (MgSO4) were purchased from Sigma-Aldrich (St. Louis, MO, USA). All solvents were of analytical or LC-MS grade. Standard stock solutions (100 µg/mL each) were prepared in acetonitrile. Standard mixed solutions were prepared by diluting stock solutions with acetonitrile. The stock and working solutions were stored at −20 °C until analysis.
Sample preparation
To extract pesticide residues from kale, the EN official method was followed (Lehotay, 2007). Extraction was performed using an EN extraction kit, which contained MgSO4 (4 g), sodium chloride (1 g), sodium citrate dihydrate (1 g), and sodium hydrogencitrate sesquihydrate (0.5 g). Each kale sample (10 g) was placed in a 50-mL centrifuge tube to which 10 mL acetonitrile was added as the extraction solvent. Triphenylphosphate was spiked directly into the centrifuge tube, as an internal standard, to a concentration of 1 µg/mL. The centrifuge tube was shaken for 1 min. The QuEChERS EN extraction kit was added and shaken for 10 min. The tube was centrifuged at 4000×g for 10 min at 4 °C. In the last step, various d-SPE clean-up methods were applied to the extracted analytes.
To remove chlorophyll from kale extracts, GCB (2, 5, 10, 20, 30, 40, and 50 mg) was applied. Additionally, GCB-alternative sorbents were used for comparison with the recovery (%) of listed pesticides and the efficacy of chlorophyll removal from GCB. Three GCB-alternative sorbent-combinations (SC) were used in the d-SPE clean-up methods: SCC consisted of 50 mg ChloroFiltr, 50 mg PSA, and 150 mg MgSO4; SCE consisted of 10 mg ENVI-Carb, 60 mg Z-Sep+, 50 mg PSA, and 150 mg MgSO4; and SCZ consisted of 50 mg Z-Sep+, 50 mg PSA, and 150 mg MgSO4. Each tube was vortexed for 1 min and then centrifuged at 4000×g for 5 min at 4 °C. The extract was filtered through a 0.22 μm nylon membrane filter and transferred into a vial for analysis.
HPLC-MS/MS conditions
For the chromatographic analysis, an HPLC system (Infinity 1200; Agilent Technologies, Santa Clara, CA, USA) coupled to a mass spectrometer equipped with a turbo ion spray ionization source (4000 QTRAP; AB SCIEX, Foster City, CA, USA) was used. The chromatographic separation was performed with an Agilent Zorbax Eclipse Plus C18 column (2.1 mm × 100 mm, 3.5 μm; Agilent Technologies) with a flow rate of 0.4 mL/min. The column was kept at 40 °C and the sample injection volume was 2.0 µL. The mobile phases used were (A) 5 mM ammonium acetate and 0.1% (v/v) formic acid in water, and (B) 5 mM ammonium acetate and 0.1% (v/v) formic acid in methanol. Pesticides were separated following solvent gradient program: 95% A at 0 min, 60% A at 0.7 min, 40% A at 1.5 min, 30% A at 2.5 min, 20% A at 9 min, 0% A from 9.5 to 12 min, and 95% A from 12.5 to 15 min. The pesticides were ionized in positive electrospray ionization mode and determined using scheduled multiple reaction monitoring (MRM) with the following operating parameters: curtain gas, 30 psi; nebulizer gas, 50 psi; auxiliary gas, 55 psi; source temperature, 400 °C; and ion spray voltage, 5500 V. The MRM transitions, retention times, collision energies, and declustering potentials of the analytes are summarized in Table 1.
Table 1.
LC-MS/MS parameters for the 30 selected pesticides in kale
| Pesticides | Molecular weight (m/z) | tRa (min) |
Precursor ion (m/z) | Quantification transition (m/z) | DPb (V) |
CEc (V) |
Confirmatory transition (m/z) | DP (V) |
CE (V) |
|---|---|---|---|---|---|---|---|---|---|
| Amisulbrom | 446.31 | 8.9 | 465.9 | 227.1 | 96 | 27 | 108.1 | 96 | 33 |
| Bensulfuron-methyl | 410.40 | 5.0 | 410.9 | 149 | 66 | 27 | 119.1 | 66 | 53 |
| Benzobicyclon | 446.97 | 5.6 | 447.0 | 257.1 | 91 | 37 | 229.1 | 91 | 51 |
| Cyclosulfamuron | 421.43 | 6.0 | 422.1 | 261.1 | 76 | 23 | 218.1 | 76 | 37 |
| Diflubenzuron | 310.68 | 6.5 | 311.0 | 158.1 | 66 | 19 | 141.1 | 66 | 45 |
| Fenazaquin | 306.40 | 11.4 | 307.2 | 161.0 | 111 | 25 | 147.0 | 111 | 29 |
| Fenhexamid | 302.20 | 6.1 | 302.2 | 55.0 | 126 | 59 | 97.3 | 91 | 33 |
| Fenpyroximate | 421.49 | 11.3 | 422.1 | 366.2 | 96 | 25 | 134.8 | 96 | 47 |
| Forchlorfenuron | 247.68 | 4.8 | 248.1 | 129.0 | 71 | 21 | 155.1 | 71 | 19 |
| Imazalil | 297.18 | 4.5 | 296.9 | 159.2 | 81 | 33 | 69.0 | 81 | 35 |
| Inabenfide | 338.79 | 5.3 | 339.1 | 321.1 | 76 | 23 | 80.1 | 76 | 49 |
| Mepanipyrim | 223.27 | 6.0 | 224.1 | 76.9 | 91 | 61 | 106.0 | 91 | 39 |
| Metamifop | 406.34 | 9.4 | 441.1 | 288.0 | 91 | 23 | 180.2 | 91 | 27 |
| Methabenzthiazuron | 221.28 | 4.7 | 222.1 | 165.2 | 66 | 23 | 150.1 | 66 | 45 |
| Penoxsulam | 483.37 | 4.3 | 484.1 | 195.0 | 116 | 41 | 163.9 | 116 | 49 |
| Probenazole | 223.25 | 6.0 | 224.2 | 51.1 | 56 | 95 | 63.1 | 61 | 103 |
| Propaquizafop | 443.88 | 9.7 | 444.1 | 100.1 | 71 | 33 | 56.0 | 71 | 51 |
| Pyraclostrobin | 387.82 | 7.6 | 388.1 | 163.0 | 106 | 39 | 193.9 | 106 | 19 |
| Pyrazolate | 439.31 | 7.9 | 438.9 | 91.0 | 91 | 71 | 173.0 | 91 | 29 |
| Pyrazophos | 373.36 | 7.8 | 374.0 | 222.2 | 86 | 27 | 194.2 | 86 | 43 |
| Pyridaben | 364.93 | 11.5 | 365.1 | 146.9 | 61 | 35 | 309.0 | 61 | 21 |
| Pyrimethanil | 199.26 | 5.2 | 200.1 | 107.0 | 91 | 35 | 82.0 | 91 | 37 |
| Pyrimidifen | 377.91 | 9.5 | 378.1 | 184.2 | 86 | 31 | 150.2 | 86 | 45 |
| Quinoclamine | 207.61 | 4.0 | 208.1 | 105.1 | 91 | 33 | 172.0 | 76 | 29 |
| Quizalofop-ethyl | 372.80 | 9.1 | 373.1 | 299.2 | 91 | 25 | 163.1 | 91 | 59 |
| Sethoxydim | 327.48 | 9.6 | 328.2 | 178.1 | 71 | 25 | 282.3 | 71 | 17 |
| Teflubenzuron | 381.11 | 9.9 | 380.9 | 141.1 | 76 | 57 | 158.2 | 76 | 23 |
| Thiabendazole | 201.25 | 3.3 | 202.1 | 175.1 | 86 | 33 | 131.1 | 86 | 43 |
| Thidiazuron | 220.25 | 4.1 | 221.1 | 102.0 | 71 | 19 | 128.0 | 71 | 25 |
| Tiadinil | 267.73 | 5.8 | 267.9 | 100.9 | 61 | 27 | 101.1 | 51 | 27 |
aRetention time
bDeclustering potential
cCollision energy
Determination of chlorophyll content
The concentrations of chlorophylls in the kale extract were determined using ultra-performance liquid chromatography (UPLC). The experimental conditions were the same as those in a previous study (Islam et al., 2019). Experiments were conducted using a UPLC system (ACQUITY H-Class; Waters Corp., Milford, MA, USA) equipped with a photodiode-array detector. Chromatographic separation was achieved using a C18 analytical column (ACQUITY UPLC BEH; Waters Corp., 2.1 × 100 mm, 1.7 μm) with (A) 5 mM ammonium formate in water:methanol:acetonitrile:ethyl acetate (50:22.5:22.5:5, v/v) and (B) 50:50 (v/v) acetonitrile:ethyl acetate as a linear solvent system. The flow rate, column oven temperature, and injection volume were 0.2 mL/min, 40 °C, and 10 µL, respectively. A mobile-phase solvent gradient was used as follows: 22% B at 0 min, 85% B at 15 min, 99% B at 35 min, and 22% B at 38–45 min. Chlorophylls in the samples were detected at 440 nm.
Validation study and matrix effects
The acceptability of the developed method was validated following the international guideline and protocols (European Commission, 2019; ICH, 2005). Linearities were determined using matrix-matched calibration curves with spiked blank samples at five concentrations (0.005, 0.01, 0.02, 0.05, and 0.1 mg/kg). All coefficients of determination (r2 > 0.997) were acceptable.
Recoveries (%) and precision, in terms of repeatability and reproducibility, were determined by analyzing blank samples spiked with standard solutions at three concentrations (0.01, 0.05, and 0.1 mg/kg), using Eq. 1. Repeatability and reproducibility were determined from at least six replicate analyses on the same day and on different days, respectively. Precision was expressed as the relative standard deviation (RSD) for replicate analyses. According to European Commission guideline, a practical default range of 60–140% may be used for individual recoveries in routine analysis (European Commission, 2019). In this study, acceptable recovery was set in the range of 70–120%.
| 1 |
Limits of detection (LODs) and limits of quantification (LOQs) were determined using five independently spiked concentrations of pesticide (0.005, 0.01, 0.02, 0.05, and 0.1 mg/kg). LODs and LOQs were calculated based on the standard deviations of the response and slope, and were expressed as LOD = 3.3 σ/s and LOQ = 10 σ/s, where σ represents the standard deviation of the response, and s represents the slope of the matrix-matched calibration curve.
Matrix-matched calibration curves were constructed using a standard, fortified with the pesticides, and blank kale sample. To compensate for matrix effects (MEs), the slopes of pesticide standards in the solvent and extracts were compared with Eq. 2 (European Commission, 2019).
| 2 |
Data expression and statistical analyses
The validation values for precision were expressed as RSD (%) from triplicates. Graphs were generated and drawn using GraphPad Prism 8.4.3 for Windows (GraphPad, Inc., San Diego, CA, USA). The UPLC data were processed using the Empower 3 software (Waters Corp.).
Results and discussion
Optimizing LC-MS/MS
MRM transitions, including the declustering potential and collision energy of 30 pesticides, were optimized to determine the pesticide residues in kale (Table 1). The MRM conditions were optimized by the direct infusion of each analyte with a syringe pump at a flow rate of 10 µL/min. The MRM modes facilitate a wider analytical scope of target compound analyses because of their higher selectivity and sensitivity (Kruve et al., 2008). Two transitions were chosen for each pesticide with reference to a previous study (Rutkowska et al., 2018). The most intense product ion was chosen as the quantifier ion and the second most selective ion for qualifier ions. The analyte peaks showed satisfactory separation and resolution between 3.0 and 12 min (Fig. S1). In this study, the mobile phase A was water containing 0.1% (v/v) formic acid and 5 mM ammonium acetate. The mobile phase B was methanol containing 0.1% (v/v) formic acid. The addition of formic acid facilitated the formation of [M + H]+ compared to that when only ammonium acetate was present (Han et al., 2021).
Effects of GCB amount on pesticide recovery and chlorophyll removal
A high amount of chlorophyll should be carefully removed from the sample before multi-residue pesticide analysis due to chromatographic problems that interfere with sensitive multi-residue analysis and increase the maintenance cost of the instrument. GCB was used in the d-SPE for pigment removal. For pesticide residue extraction, the EN method was chosen according to previous studies (Hwang et al., 2020; Song et al., 2019b). The EN method is known to improve the recovery and stability of problematic pH-dependent pesticides by achieving a constant pH value during the extraction of food matrices (Rutkowska et al., 2018). The extraction method with GCB clean-up showed that the EN method showed a 36% higher recovery rate of pesticide residues compared to the AOAC method (Song et al., 2019a).
The results of the clean-up of kale extract using with GCB are shown in Fig. 1. The green color of the extract gradually became lighter as the amount of GCB increased, and the extract was almost colorless when 50 mg of GCB was added (Fig. 1B). The visual color change was also confirmed by HPLC analysis. The observed chromatogram at 440 nm shows that the main peak was removed when 30–50 mg of GCB was used. However, as the amount of GCB increased, the recoveries of the pesticide residues decreased. When 50 mg of GCB was used, all 30 pesticides were adsorbed and showed unacceptable (< 70%) recoveries (Fig. 1A). GCB adsorbed and retained the mixture of chlorophyll and planar pesticides, which are consistent with our results (Batlokwa et al., 2013). Likewise, the AOAC QuEChERS clean-up kit containing 50 mg of GCB can avoid contamination by MS, but cannot effectively detect pesticide residues. Thus, a clean-up procedure is necessary to remove color pigments and achieve a high recovery of pesticide residues.
Fig. 1.
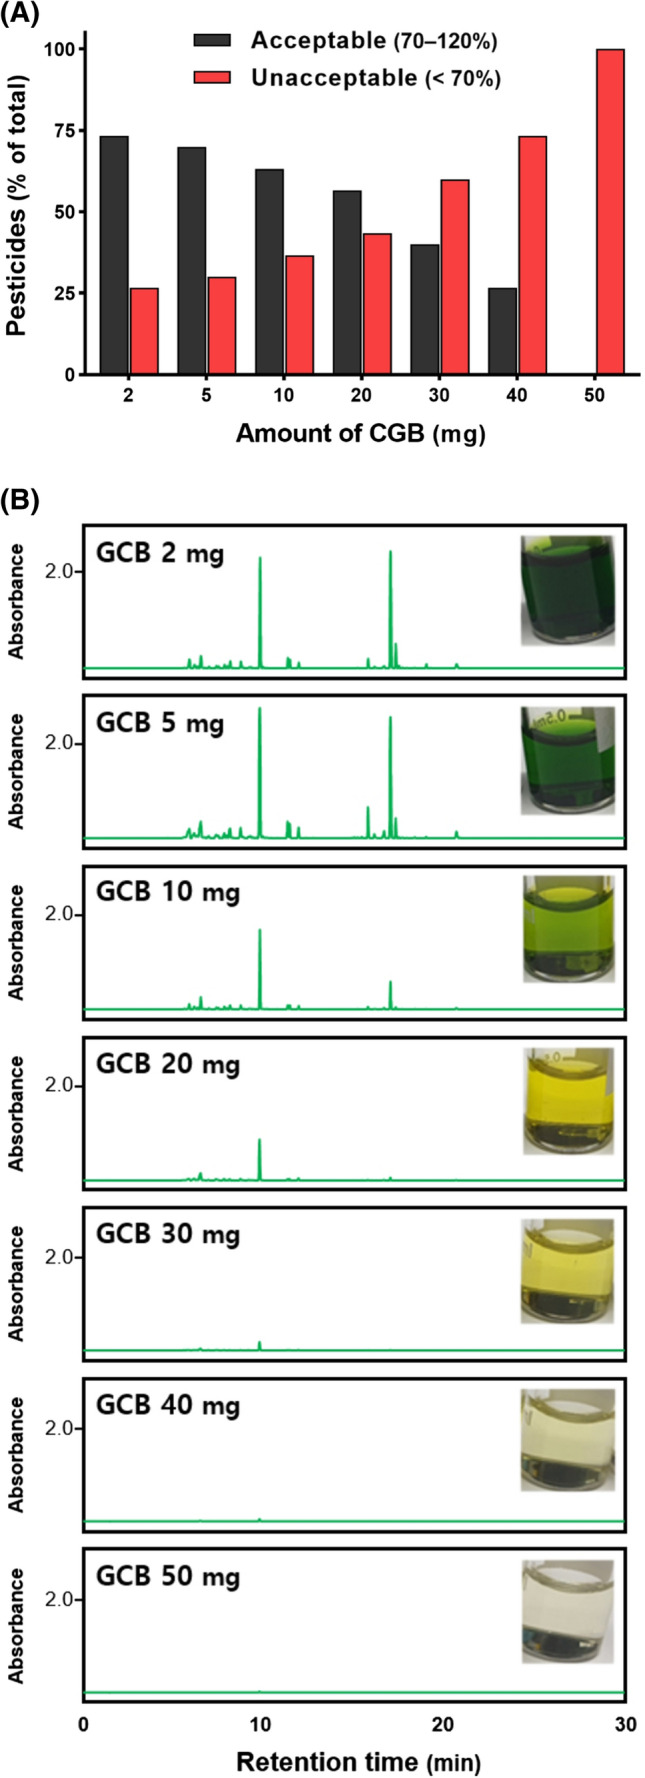
Recoveries (A) and chromatograms (B) as functions of the amount of added GCB with 50 mg of PSA and 150 mg of MgSO4 for 30 pesticides in kale fortified at 0.05 mg/kg using the QuEChERS EN method
Effects of Z-Sep+ amount on pesticide recovery and chlorophyll removal
Z-Sep+ sorbent was considered an alternative to GCB (Fig. 2). Z-Sep+ sorbents can remove lipids and pigments belonging to the hydrophobic class owing to its Lewis acid/base interactions (Lozano et al., 2014). Moreover, Z-Sep+ provide an optimum balance between planar pesticide recovery and color removal (Rutkowska et al., 2018). The green color of kale extract gradually faded from 50 mg of Z-Sep+ (Fig. 2B). The highest number of pesticides with satisfactory recovery (70–120%) was observed at 30–70 mg Z-Sep+ (Fig. 2A). Among them, 19 pesticides at 50 mg of Z-Sep+ showed recoveries of 70.9–96.3%. This result is consistent with the reporting of no change in the enrichment factors even though the amount of Z-Sep+ increased beyond 60 mg and there were enough active sites to interact with all the hydrophobic interfering components (Musarurwa et al., 2020). In particular, the pesticides diflubenzuron and forchlorfenuron showed less than 70% recovery at 90 mg of Z-Sep+ (Musarurwa et al., 2020). Based on these results, 50 mg of Z-Sep+ was selected for clean-up of kale extract.
Fig. 2.
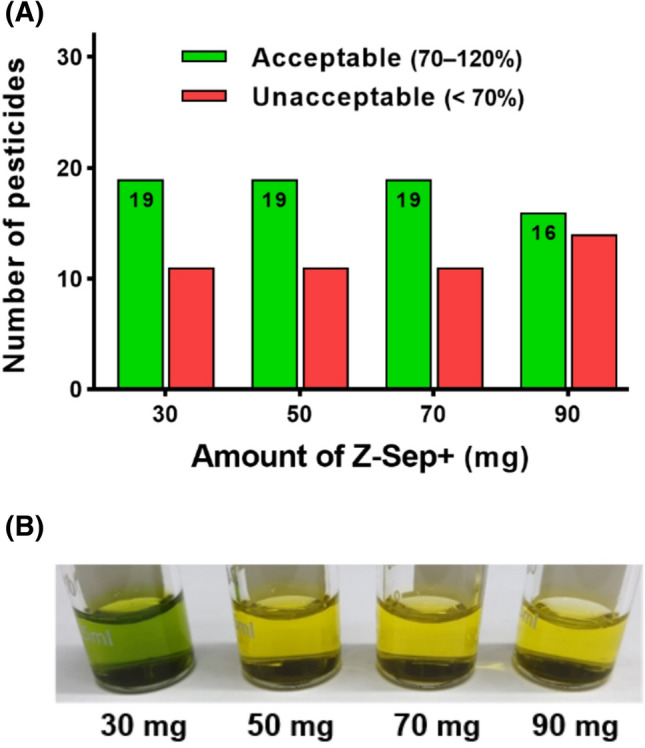
Recoveries (A) and colors of kale extract (B) as the amount of added Z-Sep+ for 30 pesticides in kale fortified at 0.05 mg/kg using the QuEChERS method. PSA (50 mg) and MgSO4 (150 mg) were added for each clean-up
Combination of sorbents for chlorophyll removal
A combination of sorbents can satisfactorily remove matrices better than individual clean-up sorbents (Rutkowska et al., 2020). A total of 50 mg of PSA and 150 mg of MgSO4 were added for each clean-up sorbent. PSA was not suitable for chlorophyll removal when used individually, but their performance improved when combined with other sorbents, such as Z-Sep+ (Fig. S2). Therefore, three combination of sorbents with added PSA and MgSO4 were investigated with reference to the AOAC QuEChERS kit proposed for pigment removal. Figure 3A shows how many of the 30 pesticides have acceptable recoveries after d-SPE clean-up with three types of SC.
Fig. 3.

LC-MS/MS recoveries using various clean-up procedures at spiked levels of 0.01, 0.05, and 0.1 mg/kg (A). UPLC chromatograms of kale extract with each clean-up (B). The different clean-up procedures used were as following: SCC (50 mg ChloroFiltr, 50 mg PSA, and 150 mg MgSO4); SCE (10 mg ENVI-Carb, 60 mg Z-Sep+, 50 mg PSA, and 150 mg MgSO4); and SCZ (50 mg Z-Sep+, 50 mg PSA, and 150 mg MgSO4)
ChloroFiltr included in SCC is a polymeric-based sorbent that is designed for the removal of chlorophyll without decreasing the recovery of planar analytes (Walorczyk et al., 2015). However, SCC showed 73.6–91.9% recoveries for 17 pesticides at 0.01 mg/kg, which are lower than those of other the combination of sorbents. This indicates that SCC adsorbs both pesticides and pigments. Moreover, this result is consistent with a previous study showing that clean-up with ChloroFiltr not only significantly reduced the green color of chlorophyll in spinach samples, but also decreased the recovery of planar pesticides (Lee et al., 2017).
The SCE clean-up method entailed a combination of Z-Sep+ and ENVI-Carb. ENVI-Carb at 45 mg achieved satisfactory recoveries and soft matrix effects in dried herbs (Rutkowska et al., 2018). However, in this study, the addition of ENVI-Carb did not enhance the pigment removal capacity. SCZ (only Z-Sep+) showed the better recovery than SCE for 30 pesticides. This was also observed in coffee leaves where ENVI-Carb provided cleaner extracts, but Z-Sep+ showed better recovery and matrix effects (Lehotay et al., 2005; Trevisan et al., 2017).
Clean-up using SC with only Z-Sep+ added (SCZ) showed satisfactory pigment removal and analyte recoveries. SCZ showed higher number (21/30) of pesticides that provided acceptable recoveries (75.1–102.1%) when fortified at 0.01 mg/kg (Fig. 3A). Green color and chlorophyll were removed the most in the SCZ (Fig. 3B). However, some pesticides (bensulfuron-methyl, benzobicyclon, cyclosulfamuron, fenhexamid, imazalil, inabenfide, penoxsulam, sethoxydim, and thiabendazole) had extremely poor recoveries (average 15.9%). Z-Sep+ retained some conazole fungicides and pyrethroid insecticides leading to low recoveries (Pszczolińska and Kociołek, 2022; Walorczyk et al., 2015). Among them, bensulfuron-methyl, benzobicyclon, cyclosulfamuron, and penoxsulam did not improve the recovery, even in SCC and SCE (Fig. S3). Only imazalil was able to improve recovery (78.4–82.8%) using SCC. These results suggest that it is challenging to simultaneously achieve the two goals of matrix removal and pesticide residue recovery from chlorophyll-rich samples.
Linearity, LOD, and LOQ
The method validation criteria for 30 pesticides depending on the spiking concentration of SCZ was shown Table 2. Good linearity was achieved for 30 pesticides in blank samples at all concentrations. The correlation coefficients (r2) were > 0.997 in all compounds. The results obtained for 19 pesticides exhibited satisfactory recovery values ranging from 70 to 120%, with RSDs ≤ 15%. The LOQs of 30 pesticides was ranging from 0.0001 to 0.004 mg/kg and lower than the MRLs established for kale by the Korea Food Additives Code (MFDS, 2021). The proposed method exhibited lower LODs and LOQs compared to previous study using GC-MS (Rutkowska et al., 2018).
Table 2.
Method validation of selected pesticides in kale using the SCZ clean-up method with LC-MS/MS analysis
| Pesticides | Linearity (r2) |
LODa mg/kg |
LOQb mg/kg |
Recovery (%) | Repeatability (%RSDc) | Within-laboratory reproducibility (%RSD) | ||||||
|---|---|---|---|---|---|---|---|---|---|---|---|---|
| 0.01 | 0.05 | 0.1 | 0.01 | 0.05 | 0.1 | 0.01 | 0.05 | 0.1 | ||||
| mg/kg | mg/kg | mg/kg | ||||||||||
| Amisulbrom | 0.9998 | 0.0001 | 0.0003 | 90.4 | 80.0 | 84.0 | 4.5 | 2.5 | 5.4 | 5.8 | 2.4 | 4.5 |
| Bensulfuron-methyl | 0.9997 | 0.0001 | 0.0002 | 12.1 | 17.2 | 9.6 | 4.5 | 9.1 | 10.4 | 4.8 | 11.9 | 9.8 |
| Benzobicyclon | 0.9990 | 0.0001 | 0.0003 | 37.0 | 47.6 | 29.8 | 2.3 | 5.6 | 13.2 | 8.6 | 13.0 | 10.1 |
| Cyclosulfamuron | 0.9989 | 0.0001 | 0.0004 | 10.4 | 16.2 | 3.5 | 5.2 | 7.6 | 7.3 | 6.9 | 12.1 | 13.1 |
| Diflubenzuron | 0.9994 | 0.0001 | 0.0002 | 85.2 | 94.7 | 70.5 | 2.0 | 8.1 | 6.9 | 2.9 | 11.9 | 5.3 |
| Fenazaquin | 0.9998 | 0.0002 | 0.0007 | 81.6 | 78.5 | 70.6 | 0.7 | 0.8 | 10.1 | 13.9 | 10.7 | 7.1 |
| Fenhexamid | 0.9992 | 0.0005 | 0.0016 | 7.1 | 7.3 | 3.2 | 3.6 | 14.2 | 9.9 | 7.2 | 13.3 | 8.7 |
| Fenpyroximate | 0.9987 | 0.0001 | 0.0004 | 85.6 | 70.9 | 76.2 | 2.6 | 4.7 | 1.1 | 12.8 | 5.0 | 0.9 |
| Forchlorfenuron | 0.9995 | 0.0001 | 0.0003 | 70.4 | 88.4 | 76.4 | 4.1 | 4.8 | 8.9 | 3.5 | 10.7 | 6.3 |
| Imazalil | 0.9991 | 0.0002 | 0.0005 | 26.3 | 18.9 | 11.7 | 0.6 | 9.1 | 10.3 | 13.4 | 13.8 | 7.3 |
| Inabenfide | 0.9997 | 0.0006 | 0.0018 | 22.1 | 36.8 | 11.3 | 2.4 | 9.1 | 10.8 | 6.0 | 10.1 | 11.6 |
| Mepanipyrim | 0.9975 | 0.0003 | 0.0008 | 89.3 | 82.1 | 88.1 | 2.5 | 0.2 | 4.4 | 9.9 | 0.2 | 3.4 |
| Metamifop | 0.9989 | 0.0001 | 0.0002 | 91.7 | 78.8 | 83.7 | 2.0 | 7.2 | 1.2 | 13.3 | 5.5 | 2.5 |
| Methabenzthiazuron | 0.9991 | 0.0001 | 0.0002 | 85.2 | 84.1 | 87.5 | 2.4 | 0.9 | 6.8 | 4.4 | 3.9 | 5.1 |
| Penoxsulam | 0.9989 | 0.0002 | 0.0005 | 9.4 | 16.6 | 10.2 | 6.4 | 9.1 | 5.1 | 8.9 | 7.1 | 7.4 |
| Probenazole | 0.9984 | 0.0013 | 0.0040 | 88.1 | 86.1 | 90.7 | 3.4 | 0.6 | 5.7 | 9.2 | 1.2 | 4.4 |
| Propaquizafop | 0.9988 | 0.0001 | 0.0002 | 89.8 | 77.9 | 79.1 | 0.7 | 3.6 | 7.2 | 13.3 | 5.7 | 5.3 |
| Pyraclostrobin | 1.0000 | 0.0001 | 0.0003 | 89.4 | 83.3 | 88.7 | 1.9 | 1.5 | 0.1 | 5.3 | 3.0 | 1.2 |
| Pyrazolate | 0.9985 | 0.0001 | 0.0002 | 62.5 | 62.7 | 58.8 | 1.0 | 0.1 | 11.1 | 6.1 | 11.9 | 8.7 |
| Pyrazophos | 0.9997 | 0.0001 | 0.0003 | 92.7 | 96.3 | 99.7 | 0.3 | 7.6 | 13.1 | 1.3 | 8.1 | 10.2 |
| Pyridaben | 0.9990 | 0.0001 | 0.0004 | 70.3 | 77.7 | 90.3 | 0.3 | 4.4 | 10.2 | 0.4 | 6.2 | 8.5 |
| Pyrimethanil | 0.9994 | 0.0002 | 0.0005 | 88.3 | 85.4 | 88.5 | 2.4 | 0.7 | 4.7 | 4.4 | 4.8 | 3.4 |
| Pyrimidifen | 0.9987 | 0.0001 | 0.0002 | 86.3 | 76.9 | 78.0 | 1.3 | 4.0 | 6.1 | 7.6 | 7.1 | 4.8 |
| Quinoclamine | 0.9998 | 0.0002 | 0.0007 | 88.6 | 86.8 | 93.6 | 2.9 | 0.2 | 10.6 | 5.3 | 2.1 | 7.5 |
| Quizalofop-ethyl | 0.9992 | 0.0001 | 0.0002 | 91.9 | 84.3 | 87.9 | 1.2 | 2.8 | 5.6 | 8.3 | 3.1 | 4.6 |
| Sethoxydim | 0.9998 | 0.0002 | 0.0007 | 7.5 | 11.5 | 2.6 | 5.1 | 9.6 | 12.0 | 10.6 | 11.4 | 11.4 |
| Teflubenzuron | 0.9997 | 0.0004 | 0.0011 | 84.7 | 86.3 | 75.8 | 11.4 | 7.6 | 2.2 | 8.5 | 7.3 | 2.4 |
| Thiabendazole | 0.9986 | 0.0001 | 0.0004 | 18.0 | 19.2 | 7.4 | 3.3 | 6.5 | 9.7 | 7.2 | 11.2 | 7.0 |
| Thidiazuron | 0.9999 | 0.0001 | 0.0002 | 50.9 | 66.5 | 63.2 | 4.7 | 3.6 | 9.8 | 3.5 | 5.4 | 7.0 |
| Tiadinil | 1.0000 | 0.0002 | 0.0006 | 86.0 | 83.9 | 88.0 | 4.7 | 7.6 | 4.7 | 8.3 | 5.4 | 5.5 |
aLimit of detection
bLimit of quantification
cRelative standard deviation
Accuracy and precision
The concentration of 0.01, 0.05, and 0.1 mg/kg pesticide mixture was spiked in the kale sample and SCZ was used for clean-up. Accuracy and precision were expressed as the mean recovery (%) and intra- and inter-day RSDs (%), respectively. The recoveries of 19 pesticides analyzed were acceptable in the range of 70.3–99.7% and with RSDs < 15% when SCZ was used for clean-up. Mean recoveries of 19 analytes were in the range of 70.3–92.7% (0.01 mg/kg level), 70.9–96.3% (0.05 mg/kg level), and 70.5–99.7% (0.1 mg/kg level). These results are similar to previous study reported by Rutkowska et al. (2018) who detected pesticides in green herb.
The inter- and intra-day RSDs ranged from 0.3 to 11.4%, and 0.4–13.9%, respectively, at 0.01 mg/kg spiked (Table 2), indicating that an acceptable range for residual pesticide analysis was achieved. Eleven analytes (bensulfuron-methyl, benzobicyclon, cyclosulfamuron, fenhexamid, imazalil, inabenfide, penoxsulam, pyrazolate, sethoxydim, thiabendazole, and thidiazuron) did not exhibit the recommended recovery values (70–120%) for all three spiked concentrations.
Matrix effect
Variation of MEs depends on the physicochemical properties of pesticides and interactions between matrices and the concentration level of pesticides (Rutkowska et al., 2020). During extraction, matrix compounds co-eluting with the analyte cause MEs that affect the ionization yield during LC-MS/MS analysis (Hu et al., 2021). Therefore, a matrix-matched calibration curve was employed here to compensate for MEs. As shown in Fig. 4, the MEs were observed to be mild (± 20%) for all pesticides. The average ME for all pesticides was an average of − 3.9% at the three spiked concentrations using SCZ. Signal enhancement was observed for eight compounds with positive ME values, and signal suppression was observed for the other compounds. Pyrazolate showed the highest signal enhancement when it was clean-up with SCC and SCE (Fig. S3; 24.9% and 26.2%, respectively). On the contrary, pyrazolate was the most prominent signal suppression using SCZ (average − 16.5% at all spiked concentrations). This indicates that SCZ can compensate for the matrix effect as much as possible.
Fig. 4.

Matrix effect of 30 pesticides in kale after SCZ clean-up procedure. Spiked levels of 0.01 mg/kg, green filled circle; spiked levels of 0.05 mg/kg, green filled triangle; spiked levels of 0.1 mg/kg, green filled square
Applying the analytical method to actual samples
Real kale samples were used in the analysis to demonstrate the suitability of the optimized method. Ten kale samples obtained from a local market were randomly analyzed. All pesticides were detected below their LOD in kale samples. No MRLs were exceeded in all kale samples. Korea established MRLs for more items than CODEX (CODEX, 2021) and EU maximum residue levels (European Commission, 2019) as shown in Table S2.
In conclusion, a method for the analysis of pesticide residues in kale using a QuEChERS with clean-up procedure was developed for better recovery and color removal. High amounts of GCB had unacceptable recoveries for tested pesticides. Three sorbents (ENVI-Carb, ChloroFiltr, and Z-Sep+) were considered as alternatives to GCB. SCZ, based on 50 mg of Z-Sep+, showed the highest pesticide recovery (21/30) and excellent pigment removal capacity for the other combination of sorbents. Methods validated according to international guidelines showed acceptable range (within 70–120%) coverage and satisfactory RSDs (< 15%). Further research is needed for the other nine planar-pesticides with poor recoveries. Obviously, the Z-Sep+ sorbent combination provides a strategy for improving analytical accuracy in chlorophyll-rich samples.
Supplementary Information
Below is the link to the electronic supplementary material.
Supplementary material 1 (DOCX 1192.0 kb)
Acknowledgements
This research was supported by the Main Research Program (E0187200-03) of the Korea Food Research Institute, funded by the Ministry of Science and ICT. The authors thank S. Y. Oh (Korea Research Institute of Bioscience and Biotechnology) for supporting the graphic design.
Declarations
Conflict of interest
The authors declare no conflicts of interest.
Footnotes
Publisher’s note
Springer Nature remains neutral with regard to jurisdictional claims in published maps and institutional affiliations.
Young Sung Jung and Nho-Eul Song have contributed equally to this work.
Contributor Information
Young Sung Jung, Email: Youngsungjung@kfri.re.kr.
Nho-Eul Song, Email: nesong@kfri.re.kr.
Ji Yeon Choi, Email: jychoi@kfri.re.kr.
Sun Hye Hwang, Email: hsh0514@kfri.re.kr.
Minseon Koo, Email: minsk@kfri.re.kr.
Tae Gyu Nam, Email: tgzoo0706@kyonggi.ac.kr.
References
- Anastassiades M, Lehotay SJ, Stajnbaher D, Schenck FJ. Fast and easy multiresidue method employing acetonitrile extraction/partitioning and ‘‘dispersive solid-phase extraction” for the determination of pesticide residues in produce. Journal of AOAC International. 2003;86:412–431. doi: 10.1093/jaoac/86.2.412. [DOI] [PubMed] [Google Scholar]
- Batlokwa BS, Mokgadi J, Majors J, Turner C, Torto N. A novel molecularly imprinted polymer for the selective removal of chlorophyll from heavily pigmented green plant extracts prior to instrumental analysis. Journal of Chemistry. 2013;2013:1–4. doi: 10.1155/2013/540240. [DOI] [Google Scholar]
- CODEX Alimentarius Commission (2021) Codex Pesticides Residues in Food Online Database. Available online: http://www.fao.org/fao-who-codexalimentarius/codex-texts/dbs/pestres/commodities-detail/en/?c_id=305 (accessed 2021-10-26)
- de Oliveira Arias JL, Rombaldi C, Caldas SS, Primel EG. Alternative sorbents for the dispersive solid-phase extraction step in quick, easy, cheap, effective, rugged and safe method for extraction of pesticides from rice paddy soils with determination by liquid chromatography tandem mass spectrometry. Journal of Chromatography A. 2014;1360:66–75. doi: 10.1016/j.chroma.2014.07.082. [DOI] [PubMed] [Google Scholar]
- European Commission. SANTE/12682/2019. Guidance document on analytical quality control and method validation procedures for pesticides residues analysis in food and feed. European Commission Directorate-General for Health and Food Safety. (rev.0). 2019. https://www.eurl-pesticides.eu/docs/public/tmplt_article.asp?CntID=727. Accessed Dec. 06, 2021
- Han L, Sapozhnikova Y, Lehotay SJ. Streamlined sample cleanup using combined dispersive solid-phase extraction and in-vial filtration for analysis of pesticides and environmental pollutants in shrimp. Analytica Chimica Acta. 2014;827:40–46. doi: 10.1016/j.aca.2014.04.005. [DOI] [PubMed] [Google Scholar]
- Han L, Sapozhnikova Y, Matarrita J. Evaluation of a new carbon/zirconia-based sorbent for the cleanup of food extracts in multiclass analysis of pesticides and environmental contaminants. Journal of Separation Science. 2016;39:4592–4602. doi: 10.1002/jssc.201600920. [DOI] [PubMed] [Google Scholar]
- Han L, Matarrita J, Sapozhnikova Y, Lehotay SJ. Evaluation of a recent product to remove lipids and other matrix co-extractives in the analysis of pesticide residues and environmental contaminants in foods. Journal of Chromatography A. 2016;1449:17–29. doi: 10.1016/j.chroma.2016.04.052. [DOI] [PubMed] [Google Scholar]
- Han C, Hu B, Chen S, Wang N, Hou J, Jin N, Shen Y. Determination of Xinjunan pesticide residue in foodstuffs of plant origin by a modified QuEChERS method and ultra performance liquid chromatography-tandem mass spectrometry. LWT. 2021;151:112101. doi: 10.1016/j.lwt.2021.112101. [DOI] [Google Scholar]
- Hu M, Ben Y, Wong MH, Zheng C. Trace analysis of multiclass antibiotics in food products by liquid chromatography-tandem mass spectrometry: Method development. Journal of Agricultural and Food Chemistry. 2021;69:1656–1666. doi: 10.1021/acs.jafc.0c05778. [DOI] [PubMed] [Google Scholar]
- Hwang S-M, Lee H-U, Kim J-B, Chung M-S. Validation of analytical methods for organochlorine pesticide detection in shellfish and cephalopods by GC–MS/MS. Food Science and Biotechnology. 2020;29:1053–1062. doi: 10.1007/s10068-020-00748-0. [DOI] [PMC free article] [PubMed] [Google Scholar]
- ICH Harmonised Tripartite Guideline Validation of Analytical Procedures: Text and Methodology Q2(R1). In: International Conference on Harmonisation of Technical Requirements for Registration of Pharmaceuticals for Human Use. Geneva, Switzerland. 1–13 (2005)
- Islam AKMM, Lee HS, Ro JH, Kim D, Kwon H. Application of high-surface‐area graphitized carbon black with primary secondary amine as an alternative quick, easy, cheap, effective, rugged, and safe cleanup material for pesticide multi‐residue analysis in spinach. Journal of Separation Science. 2019;42:2379–2389. doi: 10.1002/jssc.201900066. [DOI] [PubMed] [Google Scholar]
- Kang HS, Kim M, Kim EJ, Choe W-J. Determination of 66 pesticide residues in livestock products using QuEChERS and GC–MS/MS. Food Science and Biotechnology. 2020;29:1573–1586. doi: 10.1007/s10068-020-00798-4. [DOI] [PMC free article] [PubMed] [Google Scholar]
- Kim L, Lee D, Cho HK, Choi SD. Review of the QuEChERS method for the analysis of organic pollutants: Persistent organic pollutants, polycyclic aromatic hydrocarbons, and pharmaceuticals. Trends in Environmental Analytical Chemistry. 2019;22:e00063. doi: 10.1016/j.teac.2019.e00063. [DOI] [Google Scholar]
- Kim SB, Bisson J, Friesen JB, Pauli GF, Simmler C. Selective chlorophyll removal method to “degreen” botanical extracts. Journal of Agricultural and Food Chemistry. 2020;83:1846–1858. doi: 10.1021/acs.jnatprod.0c00005. [DOI] [PMC free article] [PubMed] [Google Scholar]
- Kim J, Shin J, Park CG, Lee S-H. Pesticide residue monitoring and risk assessment in the herbal fruits Schisandra chinensis, Lycium chinense, and Cornus officinalis in Korea. Food Science and Biotechnology. 2021;30:137–147. doi: 10.1007/s10068-020-00840-5. [DOI] [PMC free article] [PubMed] [Google Scholar]
- Kruve A, Künnapas A, Herodes K, Leito I. Matrix effects in pesticide multi-residue analysis by liquid chromatography–mass spectrometry. Journal of Chromatography A. 2008;1187:58–66. doi: 10.1016/j.chroma.2008.01.077. [DOI] [PubMed] [Google Scholar]
- Lee J, Kim L, Shin Y, Lee J, Lee J, Kim E, Moon J-K, Kim J-H. Rapid and simultaneous analysis of 360 pesticides in brown rice, spinach, orange, and potato using microbore GC-MS/MS. Journal of Agricultural and Food Chemistry. 2017;65:3387–3395. doi: 10.1021/acs.jafc.7b00576. [DOI] [PubMed] [Google Scholar]
- Lehotay SJ. Determination of pesticide residues in foods by acetonitrile extraction and partitioning with magnesium. Journal of AOAC International. 2007;90:485–520. doi: 10.1093/jaoac/90.2.485. [DOI] [PubMed] [Google Scholar]
- Lehotay SJ, Maštovská K, Yun SJ. Evaluation of two fast and easy methods for pesticide residue analysis in fatty food matrixes. Journal of AOAC International. 2005;88:630–638. doi: 10.1093/jaoac/88.2.630. [DOI] [PubMed] [Google Scholar]
- Lozano A, Rajski Ł, Uclés A, Belmonte-Valles N, Mezcua M, Fernández-Alba AR. Evaluation of zirconium dioxide-based sorbents to decrease the matrix effect in avocado and almond multiresidue pesticide analysis followed by gas chromatography tandem mass spectrometry. Talanta. 2014;118:68–83. doi: 10.1016/j.talanta.2013.09.053. [DOI] [PubMed] [Google Scholar]
- Ministry of Food and Drug Safety. Food Additives Code. Pesticide MRLs. http://www.foodsafetykorea.go.kr/foodcode/02_01.jsp. Accessed Dec. 06, 2021
- Muhammad R, Ahad K, Mehboob F. Extraction techniques for pesticide residues analysis in edible oils and role of sorbents in cleanup. Separation Science Plus. 2020;3:51–62. doi: 10.1002/sscp.201900066. [DOI] [Google Scholar]
- Musarurwa H, Chimuka L, Tavengwa NT. Z-sep + based QuEChERS technique for the pre-concentration of malathion pesticide in fruits followed by analysis using UV-Vis spectroscopy. Food Additives & Contaminants: Part A. 2020;37:2093–2108. doi: 10.1080/19440049.2020.1794054. [DOI] [PubMed] [Google Scholar]
- Pszczolińska K, Kociołek B. The pesticide residue analysis in commodities with high content of chlorophyll based on the quick, easy, cheap, effective, rugged, and safe method: A review. Journal of Separation Science. 2022;45:149–165. doi: 10.1002/jssc.202100304. [DOI] [PubMed] [Google Scholar]
- Rejczak T, Tuzimski T. Recent trends in sample preparation and liquid chromatography/mass spectrometry for pesticide residue analysis in food and related matrixes. Journal of AOAC International. 2015;98:1143–1162. doi: 10.5740/jaoacint.SGE1_Rejczak. [DOI] [PubMed] [Google Scholar]
- Rutkowska E, Łozowicka B, Kaczyński P. Modification of multiresidue QuEChERS protocol to minimize matrix effect and improve recoveries for determination of pesticide residues in dried herbs followed by GC-MS/MS. Food Analytical Methods. 2018;11:709–724. doi: 10.1007/s12161-017-1047-3. [DOI] [Google Scholar]
- Rutkowska E, Łozowicka B, Kaczyński P. Compensation of matrix effects in seed matrices followed by gas chromatography-tandem mass spectrometry analysis of pesticide residues. Journal of Chromatography A. 2020;1614:460738. doi: 10.1016/j.chroma.2019.460738. [DOI] [PubMed] [Google Scholar]
- Song N-E, Kim DB, Lim T-G, Lee Y-Y, Yoo M, Nam TG. Determining pesticide residues in wheat flour by ultrahigh-performance liquid chromatography/quadrupole time-of-flight mass spectrometry with QuEChERS extraction. Food Additives & Contaminants: Part A. 2019;36:1337–1347. doi: 10.1080/19440049.2019.1628356. [DOI] [PubMed] [Google Scholar]
- Song N-E, Seo D-H, Choi JY, Yoo M, Koo M, Nam TG. Dispersive solid–liquid extraction coupled with LC-MS/MS for the determination of sulfonylurea herbicides in strawberries. Foods. 2019;8:273. doi: 10.3390/foods8070273. [DOI] [PMC free article] [PubMed] [Google Scholar]
- Trevisan MTS, Owen RW, Calatayud-Vernich P, Breuer A, Picó Y. Pesticide analysis in coffee leaves using a quick, easy, cheap, effective, rugged and safe approach and liquid chromatography tandem mass spectrometry: Optimization of the clean-up step. Journal of Chromatography A. 2017;1512:98–106. doi: 10.1016/j.chroma.2017.07.033. [DOI] [PubMed] [Google Scholar]
- Walorczyk S, Drożdżyński D, Kierzek R. Two-step dispersive-solid phase extraction strategy for pesticide multiresidue analysis in a chlorophyll-containing matrix by gas chromatography-tandem mass spectrometry. Journal of Chromatography A. 2015;1412:22–32. doi: 10.1016/j.chroma.2015.08.022. [DOI] [PubMed] [Google Scholar]
Associated Data
This section collects any data citations, data availability statements, or supplementary materials included in this article.
Supplementary Materials
Supplementary material 1 (DOCX 1192.0 kb)