Abstract
The mechanisms by which the fetal-type β-globin-like genes HBG1 and HBG2 are silenced in adult erythroid precursor cells remain a fundamental question in human biology and have therapeutic relevance to sickle cell disease (SCD) and β-thalassemia. Here, we identify via a CRISPR-Cas9 genetic screen two members of the NFI transcription factor family – NFIA and NFIX – as HBG1/2 repressors. NFIA and NFIX are expressed at elevated levels in adult erythroid cells compared to fetal cells, and function cooperatively to repress HBG1/2 in cultured cells and in human-to-mouse xenotransplants. Genomic profiling, genome editing, and DNA binding assays demonstrate that the potent concerted activity of NFIA and NFIX is explained in part by their ability to stimulate the expression of BCL11A, a known silencer of the HBG1/2 genes, and in part by directly repressing the HBG1/2 genes. Thus, NFI factors emerge as versatile regulators of the fetal-to-adult switch in β-globin production.
Elucidation of the mechanistic foundation for the switch in production from fetal (HbF, α2γ2) to adult hemoglobin (HbA, α2β2) has been a goal for several decades, fueled by the desire to reverse this switch for the treatment of β-globinopathies1. Breakthroughs in these endeavors include the discoveries that linked transcription factors BCL11A and LRF (ZBTB7A) to the silencing of the fetal type β-globin genes HBG1 and HBG22–5, as well as the demonstration that they directly repress these genes by occupying their promoters6,7. A multitude of studies has illustrated that additional transcription factors and co-regulators influence the regulation of the HBG1/2 genes8,9,18–20,10–17, several of which directly or indirectly impact the activity of BCL11A or its expression. These and other studies have defined an extensive transcriptional circuitry regulating the β-like globin genes, leaving open the potential for further discoveries and opportunities for novel therapeutic strategies. Genome-wide association studies implicated three loci – BCL11A, HBS1L-MYB, and HBB – as modifiers of HbF levels in humans, but they only account for 25-50% of HbF variation, which also suggests that additional HbF regulators exist1.
Results
Identification of NFI transcription factors as fetal hemoglobin repressors
To search for novel HbF regulators we carried out a CRISPR genetic screen in the human adult-type erythroid cell line HUDEP221, using a single-guide RNA (sgRNA) library targeting the DNA-binding domains of most human transcription factors (1,436 total; on average 6 sgRNAs per transcription factor)9,10. Cells with elevated HbF levels were enriched by FACS, and sgRNA sequences were identified by deep sequencing9,10. One of the genes most significantly enriched in the high HbF population was NFIA (Fig. 1a), a member of the NFI family that comprises four transcription factors, NFIA, NFIB, NFIC, and NFIX, which play diverse roles in gene expression22. Of note, a recent genome-wide association study (GWAS) linked a sequence variant within an intron of the NFIX gene to elevated HbF levels23. Although NFIX sgRNAs scored poorly in our screen (Fig. 1a), NFIX contributes to HbF silencing as shown in our studies below.
Fig. 1. NFIA and NFIX cooperatively silence HBG1/2 genes in HUDEP2 cells.
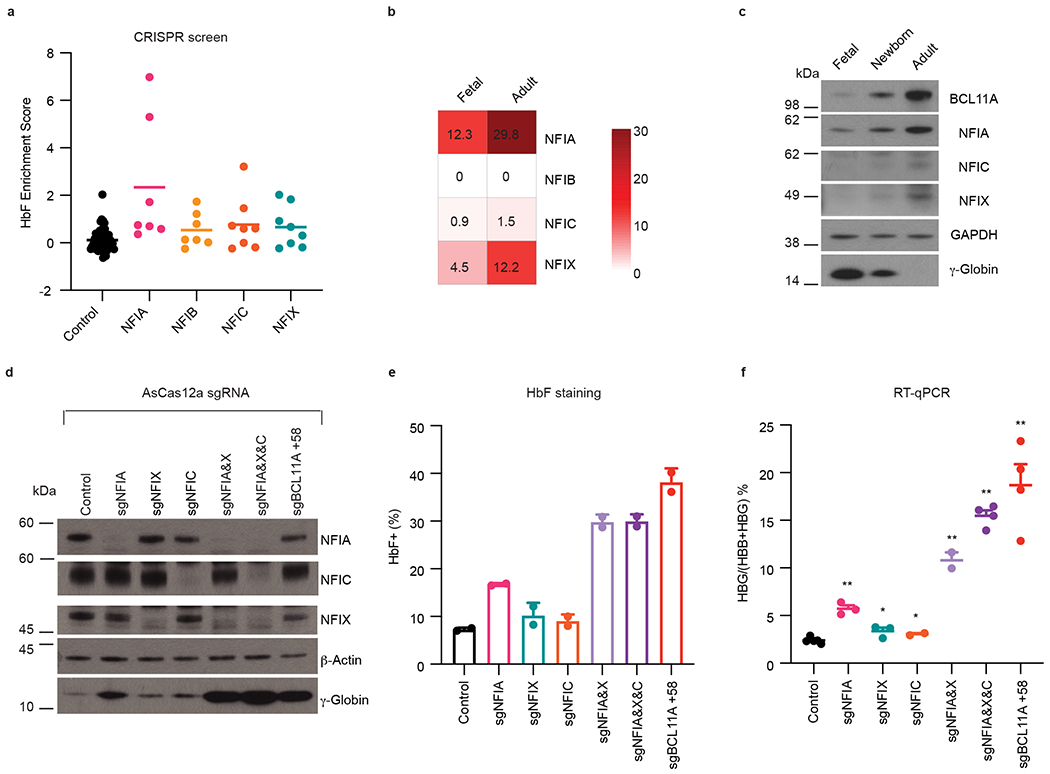
a, Enrichment scores of negative control sgRNAs (n = 12) and sgRNAs targeting NFI factors (NFIA, n = 7; NFIB, n = 7; NFIC, n = 8; NFIX, n = 8) in DNA binding domain-focused CRISPR-Cas9 screen. Data were obtained from Huang et al9. n represents different sgRNAs. b, Heatmap of NFI gene expression levels in primary erythroblasts from fetal liver (fetal, expressing HBG, n = 12) or bone marrow (adult, expressing HBB, n = 12). Fragments per kilobase of transcript per million mapped reads (FPKM) of indicated genes were obtained from Lessard et al.24. n represents different donors/biological replicates. c, Representative immunoblots of NFI proteins in erythroblasts derived from fetal liver (fetal, expressing HBG), cord blood (newborn, expressing both HBG and HBB), and peripheral blood (adult, expressing HBB). BCL11A and γ-globin served as positive controls and GAPDH as loading control. Experiments were performed twice with similar results. d-f, HUDEP2 cells expressing CRISPR-AsCas12a were transduced by a lentiviral vector carrying control sgRNA or sgRNAs targeting indicated NFI genes or the BCL11A +58 enhancer. Indicated HUDEP2 cells were analyzed at the end of differentiation (day 5). d, Representative immunoblots of NFI proteins and γ-globin in indicated HUDEP2 cells. β-Actin served as loading control. Experiments were performed three times with similar results. e, HbF+ fraction (%) of control (n = 2) and indicated gene edited HUDEP2 cells (n = 2) as determined by intracellular HbF staining. n represents two biological replicates. Data are expressed as mean ± SEM. f, The ratio of HBG/(HBG+HBB) of indicated HUDEP2 cells as determined by RT-qPCR (control, n = 5; sgNFIA, n = 3; sgNFIX, n = 3; sgNFIC, n = 2; sgNFIA&X, n = 2; sgNFIA&X&C, n = 4; sgBCL11A +58, n = 4). Data are expressed as means ± SEM. n represents biological replicates. * P < 0.05, ** P < 0.01. P values were calculated by comparing indicated samples to control with parametric unpaired two-tailed Student’s t-test. sgNFIA, P < 0.0001; sgNFIX, P = 0.0248; sgNFIC, P = 0.0426; sgNFIA&X, P < 0.0001; sgNFIA&X&C, P < 0.0001; sgBCL11A +58, P < 0.0001.
NFI proteins share a highly similar N-terminal domain that mediates homo- or hetero-dimerization and DNA binding, while their C-termini are more divergent and convey regulatory functions (Extended Data Fig. 1a)22. NFIA and NFIX are the predominantly expressed forms in erythroid cells, and both mRNA and protein levels are higher in adult compared to fetal cells, an expression pattern inverse to that of HBG1/2 and correlating with that of BCL11A (Fig. 1b,c)24,25.
To validate and extend the results from the screen we first disrupted NFI genes individually in bulk HUDEP2 cell populations using an optimized CRISPR-AsCas12a system (Extended Data Fig. 1b–c)26, with the intronic BCL11A enhancer (+58 kb with regards to the transcription start site) serving as a positive control target27. Loss of NFIA triggered modest increases in the fetal β-like hemoglobin subunit γ-globin (Fig. 1d), the percent of HbF expressing cells (Fig. 1e), and HBG1/2 mRNA levels (Fig. 1f). Loss of NFIX or NFIC, the two other members of this family with detectable expression in erythroid cells had minimal effects on γ-globin expression (Fig. 1d–f). Since NFI factors might be functioning combinatorially or redundantly22, we performed double or triple targeting by multiplexing NFIA, NFIX, and NFIC sgRNAs with the CRISPR-AsCas12a tool (Extended Data Fig. 1b–c)26. Co-targeting NFIA and NFIX markedly boosted γ-globin induction, the number of HbF expressing cells, and HBG1/2 mRNA to levels similar to that following disruption of the BCL11A +58 enhancer (Fig. 1d–f, Extended data Fig. 1d). Depletion of NFIA, NFIX, and NIFC together increased γ-globin protein and HBG1/2 mRNA even further albeit only slightly (Fig. 1d–f). In addition, we validated the above results using the CRISPR-SpCas9 system by joint delivery of NFIA and NFIX sgRNAs and observed the same degree of HBG1/2 mRNA and protein induction without a substantial change in HBB levels (Extended Data Fig. 1e–h). Taken together, these results indicate that the HBG genes are repressed cooperatively by multiple NFI proteins in HUDEP2 cells. Due to the low abundance of NFIC and its limited contribution to HbF regulation, we focused on characterizing NFIA and NFIX in follow-up experiments.
Regulation of fetal hemoglobin by NFIA/X in primary human erythroid cultures and xenografts
Next, we sought to validate our findings in primary human erythroid cells. We used a three-phase erythroid differentiation protocol to culture CD34+ hematopoietic stem and progenitor cells (HSPCs) isolated from healthy human donors (Extended Data Fig. 2a)28. NFIA and NFIX proteins became detectable by day 5 of primary erythroid cell culture, and their levels peaked at day 9 of differentiation (Extended Data Fig. 2b), consistent with prior expression data29. Therefore, we performed Cas9 ribonucleoprotein (RNP) mediated gene targeting on day 3 or 4 of differentiation. As demonstrated by immunoblot (Fig. 2a), HbF flow cytometry (Fig. 2b and Extended Data Fig. 2c), RT-qPCR (Fig. 2c), and HPLC (Fig. 2d), targeting NFIA and NFIX genes in primary cells cooperatively reactivated HbF, paralleling the findings in HUDEP2 cells (Fig. 1d–f). No overt changes in cell viability or erythroid maturation were observed in NFIA- and/or NFIX-depleted cells, as shown by cell surface phenotyping (CD235a and CD71) and Wright-Giemsa stains on day 15 of differentiation (Extended Data Fig 2d, e). To assess whether the HbF induction upon NFIA and/or NFIX depletion is sufficient to attenuate cell sickling, we disrupted NFIA and NFIX in SCD-patient-derived CD34+ cells, and exposed cultured erythroid progeny to hypoxia (2% O2). In agreement with our findings in cells from healthy donors, we observed strong HbF induction in NFIA and NFIX co-targeted populations (Extended Data Fig. 3a–d) as well as attenuation of sickle cell formation by more than 70% (Extended Data Fig. 3e).
Fig. 2. Co-depletion of NFIA and NFIX reactivates γ-globin in primary adult erythroblasts and xenotransplants.
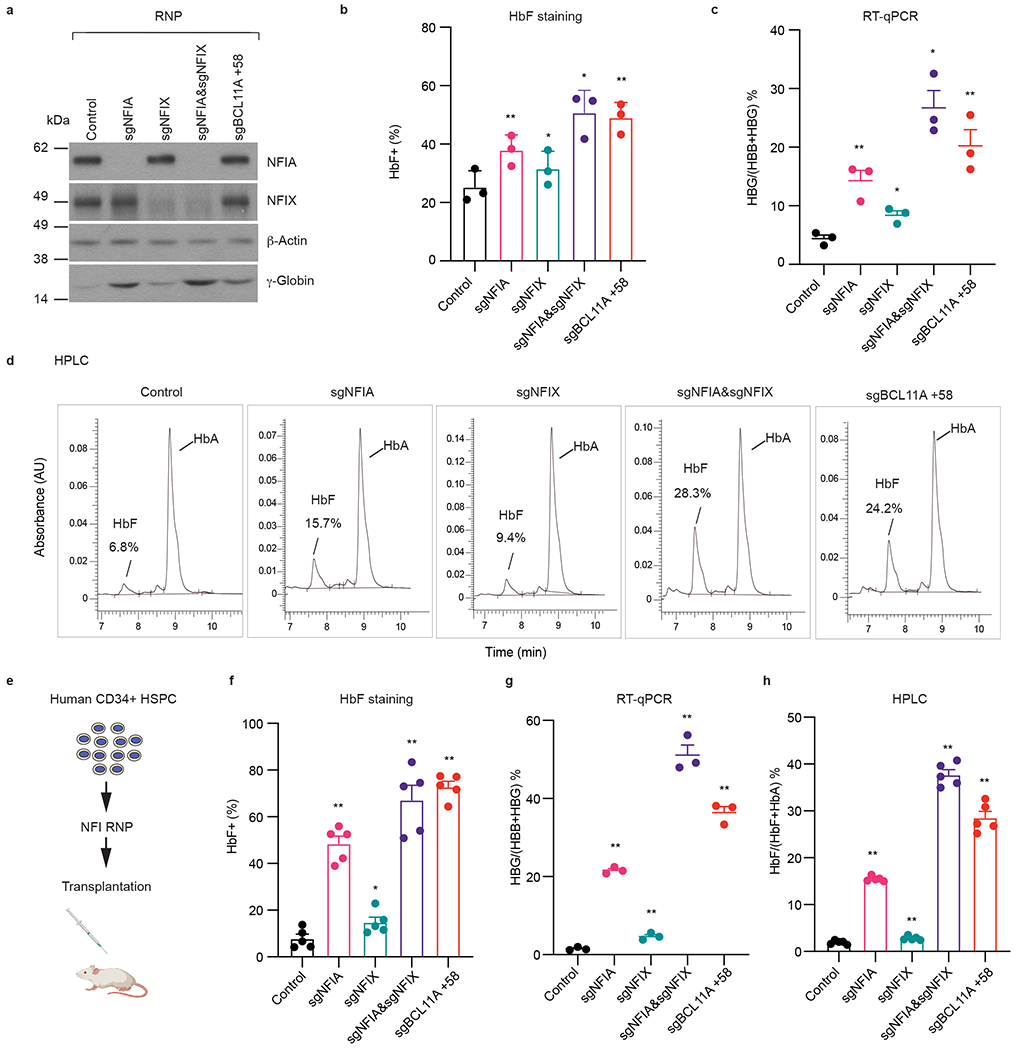
Frozen G-CSF mobilized human peripheral blood CD34+ hematopoietic stem and progenitor cells (HSPCs) were expanded for three days and transfected with indicated Cas9 and sgRNA RNPs by electroporation. On day 13 of differentiation, a subset of cells was harvested for RNA analysis. On day 15 of differentiation, the remaining cells were subjected to HbF staining, immunoblots, and HPLC analysis. a, Representative immunoblots of NFIA, NFIX, and γ-globin from indicated primary erythroblasts. Experiments were performed with three independent donors with similar results. b, HbF+ fraction (%) of indicated primary erythroblasts as determined by HbF intracellular staining (n = 3 independent donors/biological replicates). Data are expressed as mean ± SEM. * P < 0.05, ** P < 0.01. P values were calculated by comparing indicated samples to control with parametric paired two-tailed Student’s t-test. sgNFIA, P = 0.0099; sgNFIX, P = 0.0119; sgNFIA&NFIX, P = 0.0184; sgBCL11A +58, P = 0.0046. c, The ratio of HBG/(HBG+HBB) of indicated primary erythroblasts as determined by RT-qPCR (n = 3 independent donors/biological replicates). Data are expressed as mean ± SEM. * P < 0.05, ** P < 0.01. P values were calculated by comparing indicated samples to control with parametric paired two-tailed Student’s t-test. sgNFIA, P = 0.0140; sgNFIX, P = 0.0155; sgNFIA&NFIX, P = 0.0119; sgBCL11A +58, P = 0.0049. d, Representative HPLC analysis of fetal hemoglobin (HbF) and adult hemoglobin level (HbA) in indicated primary erythroblast cells. Experiment was performed with one donor. e-h, Human CD34+ HSPCs were electroporated with RNPs targeting negative control sequence, indicated NFI genes, or the BCL11A +58 enhancer. Control and NFI RNP edited cells were transplanted into NBSGW (NOD, B6. SCID Il2rg−/−KitW41/W41) mice via tail-vein injection as illustrated in e. After 16 weeks, erythroblasts (CD49d+, CD235a+) from bone marrows of the transplanted mice were analyzed for HbF+ fraction (%, f, n = 5 mice/biological replicates), RT-qPCR (g, n = 3 mice/biological replicates), and HPLC (h, n = 5 mice/biological replicates). Data are expressed as means ± SEM. * P < 0.05, ** P < 0.01. P values were calculated by comparing indicated samples to control with parametric unpaired two-tailed Student’s t-test. f. sgNFIA, P <0.0001; sgNFIX, P = 0.0424; sgNFIA&NFIX, P < 0.0001; sgBCL11A +58, P < 0.0001. g. sgNFIA, P < 0.0001; sgNFIX, P = 0.0051; sgNFIA&NFIX, P < 0.0001; sgBCL11A +58, P < 0.0001. h. sgNFIA, P < 0.0001; sgNFIX, P = 0.0107; sgNFIA&NFIX, P < 0.0001; sgBCL11A +58, P < 0.0001.
To test the impact of NFIA/NFIX depletion on the hematopoietic system, especially on the erythroid compartment, we disrupted each gene separately or together by transfecting RNPs into CD34+ HSPCs, followed by transplantation into immunodeficient non-irradiated NOD, B6.SCID Il2rg−/−KitW41/W41(NBSGW) mice (Fig. 2e)10,30,31. Sixteen weeks following transplantation, bone marrow hCD45+ cells were isolated by FACS. All experimental groups showed ~80% of human engraftment with equal proportions of myeloid, B cells, erythroid cells, and HSPCs (Extended Data Fig. 4, a and b). Moreover, the indel frequencies in each donor-derived lineage were similar to those in the bulk edited donor CD34+ HSPCs prior to xenotransplantation (Extended Data Fig. 4c–e), indicating the absence of significant counter-selective pressure. Thus, NFI deficiency did not significantly affect the capacity of CD34+ HSPCs to establish discrete human hematopoietic compartments in the bone marrow of NBSGW mice, contrasting with previous reports that Nfix is required for HSPCs homing in mice32,33. We isolated donor-derived human erythroblasts (hCD235a+) from engrafted bone marrow and determined their HbF levels. Co-depletion of NFIA and NFIX led to robust HbF activation, with the HbF+ cell fraction increasing from 8% to 67% (Fig. 2f), HBG/(HBG+HBB) transcript ratio increasing from 1% to 51% (Fig. 2g), and the HbF protein as measured by HPLC increasing from 2% to 38% (Fig. 2h). Taken together, these results demonstrate strong cooperativity by NFIA and NFIX in HbF silencing in vivo.
NFIA/X promote an adult type gene expression signature
To determine whether NFI factors suppress a global fetal-like state or whether they act more selectively on the HbF regulatory circuitry, we conducted RNA-seq in HUDEP2 cells expressing a control sgRNA and two sgRNAs for each NFI gene and performed differential analysis between control and each of the three NFIA/NFIX genotypes (Fig. 3a). We identified 257 and 173 genes up- and downregulated, respectively, upon NFIA and NFIX co-depletion (fold change > 1.5 and adjusted P < 0.05, Fig. 3a). NFIA single depletion changed the expression of only 71 genes in total, all of which overlapped with the NFIA&NFIX altered gene group, and NFIX single depletion had only minimal influence on the HUDEP2 transcriptome (Fig. 3a and Supplementary Table 1–3). When comparing expression levels of up- or downregulated genes in samples from three NFIA/NFIX genotypes, we observed that most genes were sensitive to the total NFI protein dosage (Fig. 3b). Indeed, hierarchical clustering of these genes’ expression patterns across samples defined four distinct groups (Extended Data Fig. 5a). The first two comprised most NFIA/NFIX regulated genes (408; 95%) and demonstrated strong NFI dose dependent up- or downregulation (Extended Data Fig. 5a). Consistent with our earlier findings (Fig. 1b–f), the HBG1/2 genes were at the top of the upregulated genes when depleting NFIA alone or together with NFIX (Extended Data Fig. 5b–d). In addition, the embryonic β-globin like gene HBE1 and the embryonic type α-globin gene HBZ were also upregulated upon loss of NFI factors (Fig. 3b). Thus, NFI factor deficiency partially reversed fetal and embryonic globin gene silencing24,25. Other fetal-specific transcripts (e.g., ESRRG, IGF2)24,25 were elevated in the NFI deficient cells as well (Fig. 3b). In contrast, genes that are normally more highly expressed in adult erythroid cells such as GCNT224 and TNXB24,34 were found to be downregulated (Fig. 3b). We performed gene set enrichment analysis (GSEA) using a complete list of genes that were expressed differently between fetal and adult erythroid cells (Supplementary Table 4). As expected, this showed that fetal-expressed genes are enriched in the transcriptome of NFIA and NFIX co-depleted samples, whereas adult-expressed genes were reduced (Fig. 3c, q = 0), suggesting a broader role for NFI factors in maintaining the adult cell fate.
Fig. 3. NFIA and NFIX support an adult-type erythroblast transcription program.
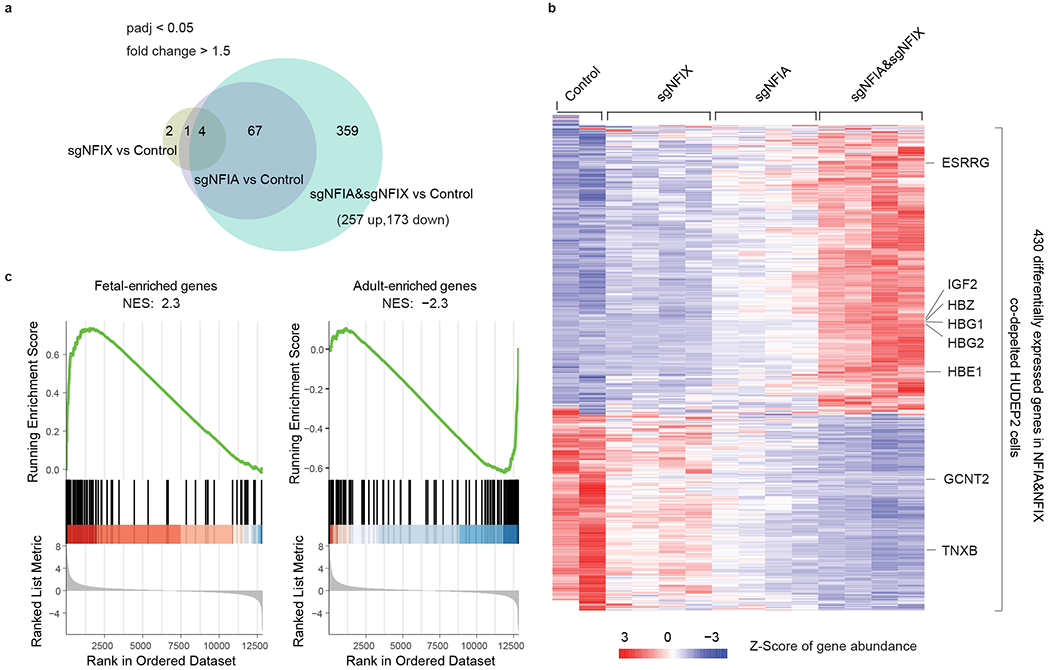
a-c, RNA-seq analysis of global gene expression changes upon NFIA and NFIX single or combined depletion in HUDEP2 cells, based on two biological replicates. a, Intersection analysis of genes whose expression level changes upon depletion of NFIA (sgNFIA), NFIX (sgNFIX), or NFIA and NFIX co-depletion (sgNFIA&sgNFIX) in HUDEP2 cells. Fold change > 1.5 and adjusted P value < 0.05 (adjusted for multiple comparisons) were used as cutoffs for identifying differentially expressed genes. b, Heatmap showing expression level changes of 430 NFIA and NFIX co-depletion affected genes in response to single or combined NFIA and NFIX depletion. c, Gene set enrichment analysis (GSEA) of NFIA and NFIX co-depletion affected genes. Fetal-enriched gene and adult-enriched gene sets were obtained from Lessard et al24. NES, normalized enrichment score.
Lastly, in line with our prior characterization (Extended Data Fig. 1), NFIA and NFIX depletion did not cause any significant changes in adult hemoglobin coding genes (HBA1/2, HBB, and HBD) or other red cell differentiation-related genes, such as GATA1, ALAS2, and BAND3 (Extended Data Fig. 5b–d). Thus, NFI factors play a broader role in modulating the fetal-to-adult switch with the HBG1/2 genes being influenced the most among the erythroid genes (Supplementary Table 1–3).
NFIA/X support BCL11A expression in adult erythroid cells
To determine the genomic occupancy of NFIA and NFIX, we carried out Cleavage Under Targets & Release Using Nuclease (CUT&RUN)6,35 both in HUDEP2 cells and in primary erythroblasts, with NFIA or NFIX knockout (KO) HUDEP2 cells serving as controls. This identified a total of 14,889 NFIA and 7,856 NFIX high-confidence peaks shared by both cell types. Peaks were specific because they were diminished in corresponding HUDEP2 KO cells (Fig. 4a, b and Extended Data Fig. 6a–d). Moreover, motif and footprint analyses of the peaks identified canonical NFI binding motifs (Fig. 4c)36. Consistent with the idea that NFI proteins share similar DNA-binding domains, we observed significant overlap between NFIA and NFIX peaks22,37. Indeed, the majority of NFIX binding sites are occupied by NFIA (Fig. 4a). Both NFIA and NFIX proteins are highly enriched at the locus control region (LCR) and at the HBD and HBB gene promoters, however, we failed to detect NFIA or NFIX enrichment within the HBG1/2 genes (Extended Data Fig. 6d and see below). In contrast, we detected strong NFIA or NFIX binding at the BCL11A intronic enhancer regions (Fig. 4d), which was further validated with three additional NFIA antibodies (Extended Data Fig. 6e), suggesting that NFI proteins might modulate BCL11A expression.
Fig. 4. NFIA and NFIX genomic occupancy profiles by CUT&RUN.
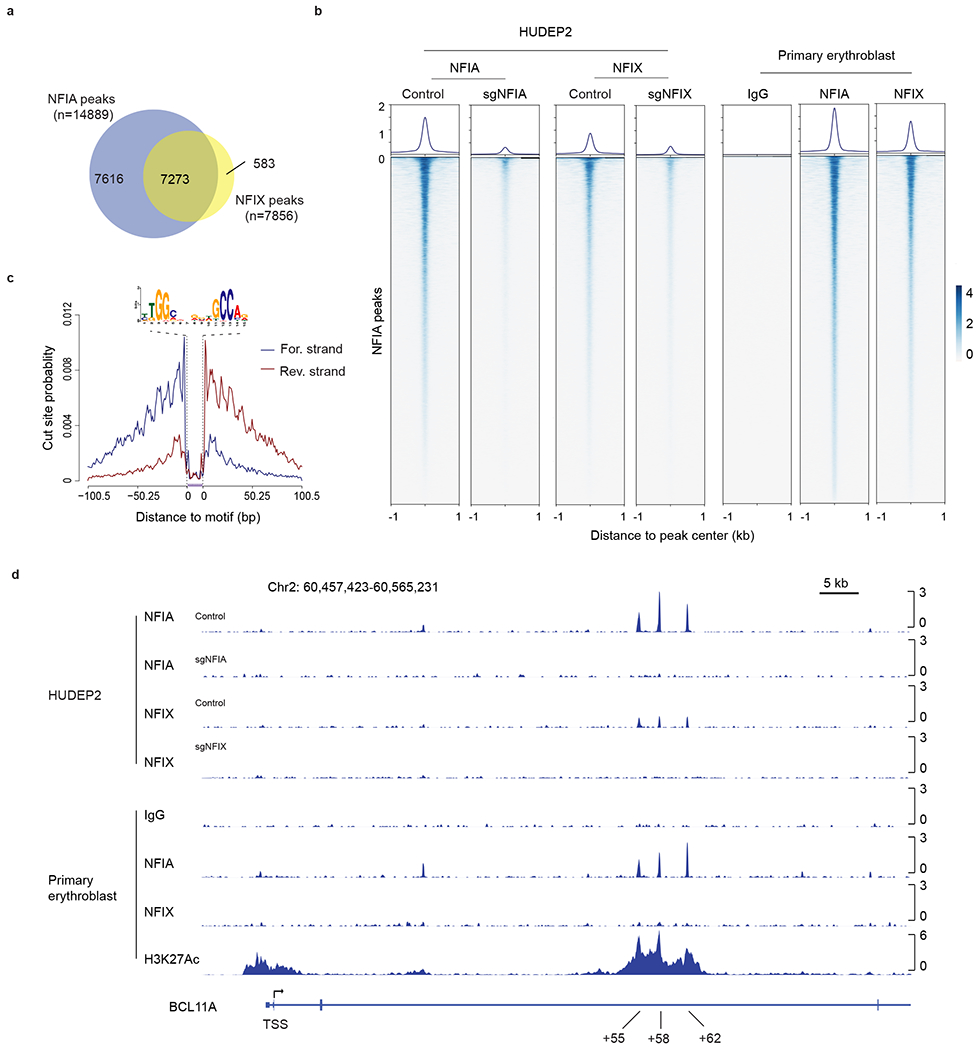
a, Venn diagram of NFIA and NFIX binding sites identified from CUT&RUN experiments. b, Visualization of NFIA and NFIX CUT&RUN peaks in HUDEP2 and primary erythroblasts by profile and heatmap plots. 14,889 NFIA peaks identified from HUDEP2 and primary cell CUT&RUN were used for generating this graph. Peaks are ranked by CUT&RUN tag counts. c, Representative footprint analysis result of de novo binding motif identified from the NFIA or NFIX CUT&RUN experiments. d, NFIA and NFIX occupancy profiles at the BCL11A locus in HUDEP2 and primary erythroblasts. NFIA KO (sgNFIA), NFIX KO (sgNFIX), and IgG served as controls.
Transcription factors can influence and are influenced by chromatin accessibility38. Therefore, we performed ATAC-seq39 in control and NFIA&NFIX co-depleted HUDEP2 cells (two biological replicates, Extended Data Fig. 7a). Consistent with our transcriptome analysis, we observed a 5.3-fold increase in accessibility at the promoters of HBG1/2 genes in NFIA&NFIX deficient cells (Extended Data Fig. 7b and Supplementary Table 5), reflecting increased promoter activity. We also detected decreased accessibility at the two BCL11A erythroid-specific enhancers +58 and +62 (Fig. 5a and Supplementary Table 5). Indeed, RNA-seq and RT-qPCR in HUDEP2 cells revealed a ~15% reduction of BCL11A mRNA in NFIA-depleted cells, and a ~30% reduction in NFIA&NFIX co-depleted cells (Fig. 5b, c). Similar findings were made in primary erythroblasts (Fig. 5d).
Fig. 5. NFI factors support BCL11A expression in adult erythroblast.
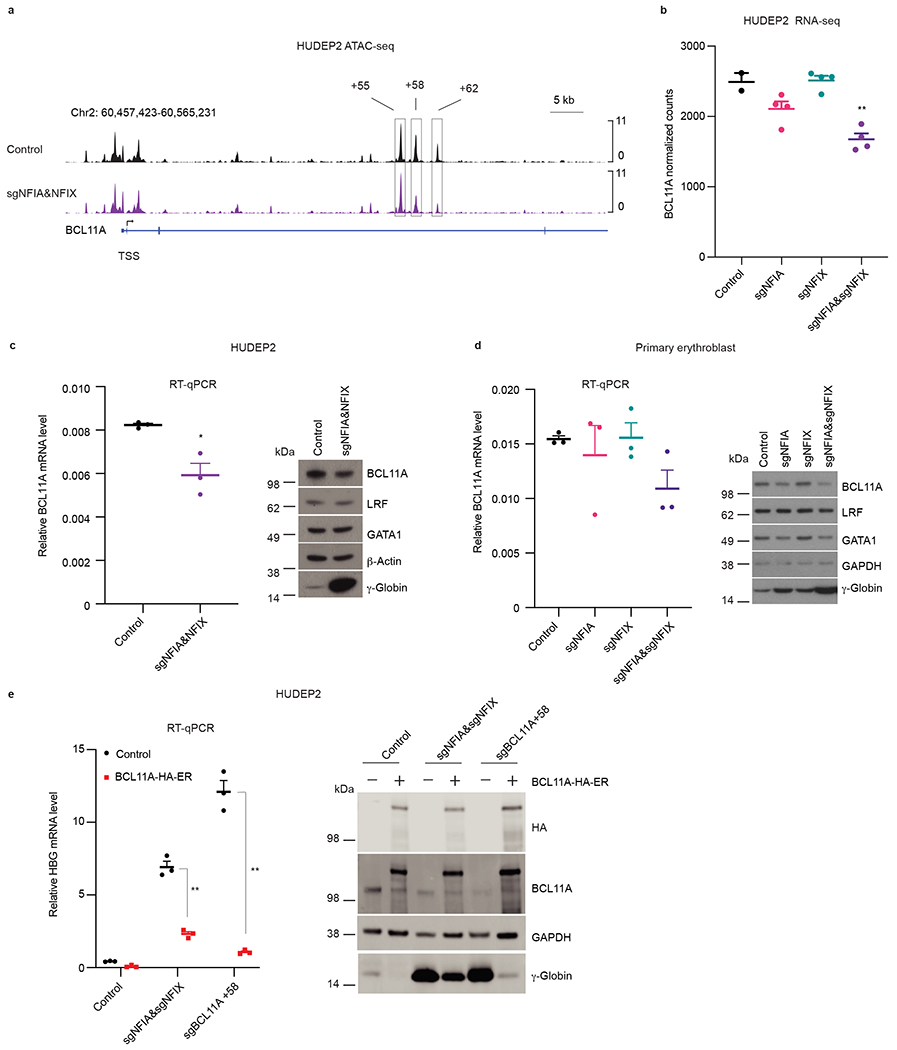
a, Enrichment of ATAC-seq signals at the BCL11A locus in control (n = 2) or NFIA and NFIX co-depleted (sgNFIA&NFIX, n = 2) HUDEP2 cells. The boxed regions are BCL11A +55, +58, and +62 enhancers. n represents biological replicates. b, Normalized counts of BCL11A mRNA in RNA-seq (n = 2 for control sgRNAs and n = 4 for NFIA depletion (sgNFIA), NFIX depletion (sgNFIX), and NFIA and NFIX co-depletion (sgNFIA&sgNFIX)). Data are expressed as mean ± SEM. ** P < 0.01. P values were calculated by comparing indicated samples to control with parametric unpaired two-tailed Student’s t-test. sgNFIA, P = 0.0952; sgNFIX, P = 0.8781; sgNFIA&NFIX, P = 0. 0049. c, BCL11A mRNA and protein levels in control and NFIA and NFIX co-depleted (sgNFIA&NFIX) HUDEP2 cells. RT-qPCR quantification of BCL11A mRNA in control and NFIA and NFIX co-depleted (sgNFIA&NFIX) HUDEP2 cells. Data were normalized to AHSP (n = 3 biological replicates). Data are expressed as mean ± SEM. * P < 0.05. P values were calculated by comparing indicated samples to control with parametric unpaired two-tailed Student’s t-test. P = 0.0141. Representative immunoblots of BCL11A, LRF, GATA1, and γ-globin in control and NFIA and NFIX co-depleted (sgNFIA&NFIX) HUDEP2 cells. β-Actin served as loading control. Experiments were performed more than three times with similar results. d, BCL11A mRNA and protein levels in indicated RNP modified primary cells. RT-qPCR quantification of BCL11A mRNA in control and indicated NFI factor depleted primary cells. Data were normalized to AHSP (n = 3 independent donors). Data are expressed as mean ± SEM. * P < 0.05, ** P < 0.01. p values were calculated by comparing indicated samples to control with parametric unpaired two-tailed Student’s t-test. sgNFIA, P = 0.6207; sgNFIX, P = 0.9306; sgNFIA&NFIX, P = 0. 0586. Representative immunoblots of BCL11A, LRF, GATA1, and γ-globin in control and NFIA/NFIX single or combined depleted primary cells. Similar results were obtained using samples from three additional donors. GAPDH served as loading control. e, HBG1/2 mRNA and γ-globin levels in control, NFIA and NFIX co-depleted (sgNFIA&sgNFIX) HUDEP2 cells, and sgBCL11A +58 HUDEP2 cells following overexpression of BCL11A cDNA as quantified by RT-qPCR and immunoblot. Data were normalized to AHSP (n = 3 biological replicates) and expressed as mean ± SEM. ** P < 0.01. P values were calculated by comparing samples from cells overexpressing BCL11A to those serving as controls with parametric unpaired two-tailed Student’s t-test. sgNFIA&sgNFIX, P < 0.0001; sgBCL11A +58, P < 0.0001. Endogenous and ectopic BCL11A were distinguished by anti-BCL11A and anti-HA antibodies. Immunoblots were performed twice with similar results.
To test to what extent downregulation of BCL11A contributes to HbF induction in our model, we restored BCL11A expression by introducing a conditionally active form of BCL11A fused to the ligand-binding domain of the estrogen receptor and an HA tag (BCL11A-HA-ER). The construct was driven by the human EF1α promoter and was introduced into NFIA&NFIX co-depleted HUDEP2 cells via lentiviral vector transduction. In the presence of tamoxifen, BCL11A-ER restored HBG silencing in NFIA&NFIX co-depleted cells, but did so only incompletely (Fig. 5e). As control, we expressed BCL11A-ER in BCL11A +58 sgRNA targeted cells, which led to a more complete restoration of HBG1/2 silencing compared to that of NFIA&NFIX co-depleted cells. In sum, NFIA and NFIX repress HBG1/2 expression in part by supporting BCL11A expression in adult erythroid cells.
Evidence for direct action of NFIA/X at the HBG genes
The incomplete restoration of HBG1/2 repression by BCL11A overexpression together with the disproportionate increase in HBG1/2 induction vis-à-vis the modest BCL11A reduction in NFIA&NFIX depleted cells suggests that NFI factors function by additional mechanisms to silence the HBG1/2 genes. Even though our CUT&RUN results showed no signal for NFIA or NFIX at the HBG1/2 genes, there are several reasons not to exclude a direct function of NFIA and/or NFIX at these genes. First, ChIP-seq40,41 detected NFIA and NFIC at the HBG1/2 genes in K562 cells, a myeloid leukemia cell line with erythroid features that represent an embryonic/fetal-like stage with active HBG1/2 genes (Extended Data Fig. 8a), indicating that NFI proteins are capable of binding to the HBG1/2 genes. Second, motif analysis identified several putative NFI binding sites at the HBG1/2 loci (see below). Third, a well-known challenge to the detection of transcriptional repressors is that they may not reside on chromatin once gene repression is fully established and subsequently maintained epigenetically42. The term hit-and-run has been coined to summarize such a scenario42. Hence, a repressor that is bound to its target only during a narrow time window might be challenging to detect by conventional ChIP experiments. Lastly, epitope occlusion might occur in a state of condensed repressed chromatin. Indeed, BCL11A and LRF have been exceedingly difficult to detect at the HBG1/2 promoters (ref4,7,43–45and our unpublished observations) even though a direct function at these genes is quite well established6,7.
For the above reasons, NFI chromatin occupancy might only be detectable in cells in which the HBG1/2 genes are incompletely silenced. A similar scenario has been described in the case of BCL11A, which is more easily detected in HBG-expressing cells6. To test this idea, we exploited the fact that sub-clonal populations of HUDEP2 cells vary in their basal HBG1/2 expression levels46. We identified a HUDEP2 clone (HUDEP2 clone 6, Fig. 6a, b) in which HBG1/2 genes were not fully silenced as measured by flow cytometry. Notably, NFIA CUT&RUN detected several strong NFIA peaks near the HBG1/2 genes in these cells (Fig. 6a, b). To extend these findings, we performed NFIA CUT&RUN in K562 and primary erythroblasts derived from human fetal liver and observed a similar binding pattern (Fig. 6a, b).
Fig. 6. NFI factors directly silence the HBG1/2 genes.
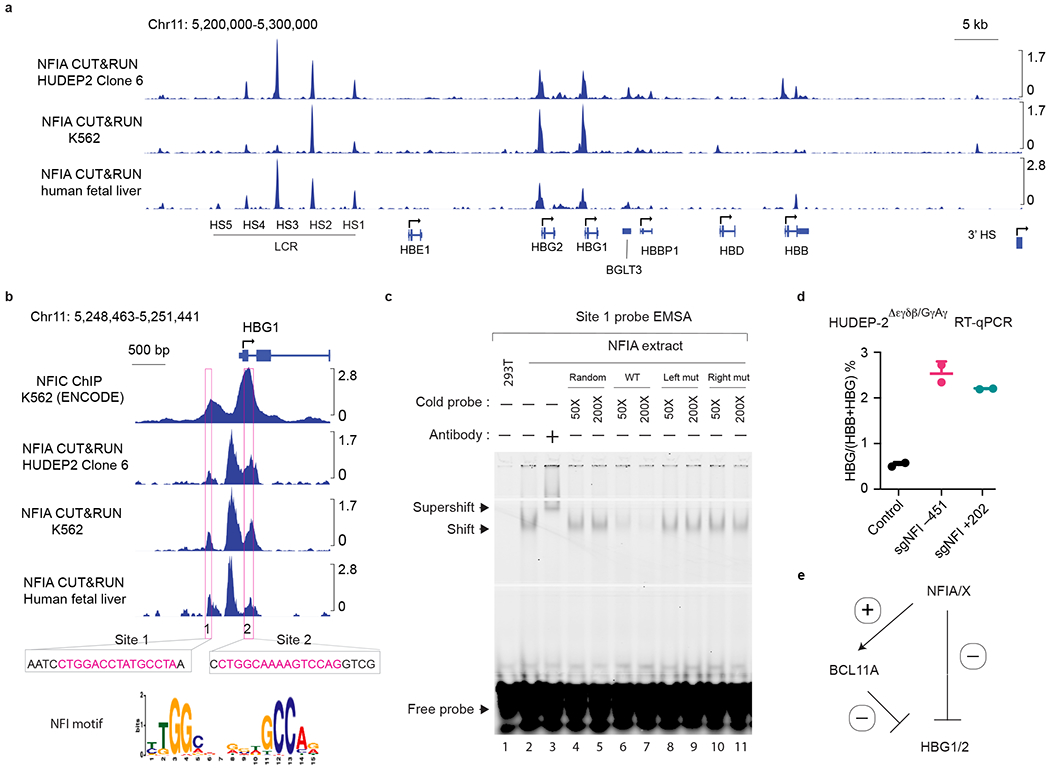
a, NFIA CUT&RUN tracks at the β-globin locus in a HUDEP2 sub-clonal population in which the HBG1/2 genes are not fully silenced (HUDEP2 Clone 6), K562 cells, and primary human fetal liver erythroblasts. b, Zoomed-in view of NFIC ChIP-seq (ENCODE: ENCSR796ITY) in K562 cells40 and three CUT&RUN tracks in a at the HBG1 gene. Boxes demarcate two regions with bearing NFI motifs. c, Electrophoretic mobility shift assay (EMSA) examining the binding of NFIA and the IRDye 700 labeled site 1 sequence probe. The interaction of NFIA and site 1 (~450 bp upstream of HBG1/2 TSS) probe produced a gel shift which was competed with unlabeled cold probes in 50 (50×) or 200 (200×) times excess molar concentration, including a random sequence (random), wild type (WT), or two mutant sequences (Left mut or Right mut) containing either mutated left or right half of the NFI full motif (TGGA or GCCT). Note that the NFIA-DNA interaction could only be out-competed by the WT probe but not by random probes or half-site mutated probes, indicating the interaction requires a full NFIA binding site. The identity of the NFIA-DNA complex was verified with an anti-AM tag antibody that recognized the recombinant NFIA protein and generated a “supershift”. Left mut: probes contain four mutated sequences at the right half of the NFI motif sequences; Right mut: probes contain four mutated sequences at the left half of the NFI motif sequences. Experiments were performed twice with similar results. d, HUDEP2Δεγδβ/GγAγ cells expressing CRISPR-Cas9 were transduced by a lentiviral vector carrying sgRNAs targeting NFI binding site 1 (NFI −451) or site 2 (NFI +202). control (n = 4) and edited (n = 2) HUDEP2 cells were harvested at day 5 of differentiation and subjected to RT-qPCR analysis. The ratio of HBG/(HBG+HBB) as determined by RT-qPCR. n represents biological replicates. Data are expressed as means ± SEM. e. Model of the dual roles of NFI transcription factors in the silencing of HBG1/2 genes in adult erythroid cells. NFI proteins act both directly on the HBG1/2 genes (transcription repression) and indirectly by stimulating BCL11A transcription (transcription activation).
Transcription factor binding sites can be protected from micrococcal nuclease cuts during the CUT&RUN procedure47 cuts leaving “footprints” behind. Therefore, we performed single locus footprint analysis on the putative NFI binding sites at the HBG1/2 loci. This revealed that two NFI motifs, one located at 450 bp upstream of HBG1/2 transcription start site (TSS) and the other in the first intron of the HBG1/2 genes 200 bp downstream of the TSS, showed some protection from nuclease digestion, suggesting that both sites may be occupied by NFIA protein(s) (Fig. 6c, d and Extended Data Fig. 8b).
To test whether NFI proteins can bind in vitro to the motifs found at the HBG1/2 genes, we performed NFIA and NFIX electrophoretic mobility assays (EMSA). Nuclear extracts from cells expressing NFIA and NFIX but not control extracts slowed the mobility of labeled oligonucleotides containing the full motifs represented in these two sites (Fig. 6e and Extended Data Fig. 8c–e). Incubation with an anti-NFIA or NFIX antibody produced a “supershift”, confirming the specificity of the complex (Fig. 6e and Extended Data Fig. 8c–e). NFI proteins can also bind half-site motifs (TGGCA) but with significantly lower affinity22. Indeed, we observed that the DNA-NFI protein complexes were out-competed by high concentrations of unlabeled oligonucleotides containing canonical NFI binding sites but not random sequences or NFI half-sites (Fig. 6e and Extended Data Fig. 8c–e). Both NFIA and NFIX performed similarly in this assay, suggesting that their different activities might be related to their expression levels in erythroid cells or their ability to form distinct homo- or heterodimeric complexes. Importantly, mutating these two motifs in HUDEP2 clone 6 or K562 cells by CRISPR-Cas9 abolished the NFIA CUT&RUN signals (Extended Data Fig. 9a), suggesting that these motifs mediate NFIA binding. Taken together, these results suggest that NFI factors can occupy the HBG1/2 genes in vivo and in vitro.
Having established that NFI proteins have the ability to bind directly to the HBG1/2 genes, we assessed their function at the HBG1/2 genes by removing the NFI binding sites. Since the HBG genes and their proximal regulatory sequences are duplicated, CRISPR-Cas9 editing frequently causes deletions of one of the HBG genes31. To bypass this issue, we performed the editing experiment in the HUDEP2 Δεγδβ/GγAγ line that possesses a single HBG gene resulting from an HBG1-HBG2 fusion20. We targeted via CRISPR-Cas9 either the −451 and +202 NFI binding sites, achieving 98% and 93% disruption rate, respectively (Extended Data Fig. 9b). Each of these individual modifications led to a 4- to 5-fold increase of the HBG/(HBG+HBB) mRNA ratio (Fig. 6f). Taken together, these results suggest that NFI factors repress the HBG1/2 genes in part via direct action.
Discussion
In this study, using a CRISPR genetic screen, we identified NFI factors as HbF repressors. NFIA and NFIX expression is elevated in adult erythroid cells compared to fetal cells and increases during erythroid maturation, similar to the expression pattern of BCL11A. NFIA is the dominant player in HbF silencing with NFIX exerting a lesser role. Combined loss of NFIA and NFIX substantially increases HbF production in cultured cells and in a human-to-mouse xenograft model. Evidence supports a dual mechanism by which NFIA and NFIX act both directly on the HBG1/2 genes and indirectly by stimulating BCL11A transcription, producing a strong combinatorial effect (Fig. 6g). Even though BCL11A and LRF have been considered the major direct repressors of the HBG genes, our findings add another transcription factor pair that in combination exerts HBG silencing activity comparable to that of BCL11A and LRF. Thus, our work supports a model in which complete HBG silencing requires the full complement of BCL11A, LRF, and NFI proteins, and that while necessary, none of these are by themselves sufficient for keeping the HBG genes in a completely repressed state.
NFIA and NFIX proteins bind to the +55, +58, and +62 BCL11A enhancers in HUDEP2 and primary erythroblasts (Fig. 4) and contribute to open chromatin formation (Fig. 5), suggesting they act as activators for BCL11A gene transcription. However, NFIA/NFIX depletion only reduced the BCL11A level by ~30% (Fig. 5), which is insufficient to account for the observed high HBG induction in these cells. Moreover, BCL11A expression failed to fully silence HBG expression in NFIA/NFIX-deficient cells (Fig. 5), prompting to more deeply explore a function of NFIA and NFIX at the HBG genes.
Although NFIA and NFIX CUT&RUN failed to detect these proteins at the HBG genes in parental HUDEP2 cells, we surmised that, analogous to BCL11A and LRF (ref7 and our unpublished observations), NFI detection on chromatin might require an open, i.e., partially active chromatin state. Indeed, NFI proteins were detectable at the HBG genes in K562 cells, primary fetal liver erythroid cells, and a HUDEP2 subclone with elevated HBG expression. These observations align with the idea is that once a gene is silenced, “passive” silencing mechanisms may take over (e.g., heterochromatin formation) in the absence of the repression-initiating factors, a scenario referred to as a hit-and-run mechanism42. In addition, it is possible that if the silencing factor does persist, epitopes might be occluded due to chromatin compaction42. A direct function of NFI proteins at the HBG genes is suggested by the presence of NFIA consensus elements under CUT&RUN peaks, by the fact that NFIA and NFIX can bind both elements in vitro, and that disruption of either NFI element increases HBG transcription. Lastly, a CRISPR-Cas9 tiling screen implicated both NFI binding sites in HBG repression12.
Additional genes with fetal (e.g., ESRRG, IGF2) or adult expression (e.g., GCN2, TNXB) were controlled in opposing fashion by NFIA and/or NFIX, analogously to the HBG and BCL11A genes. Hence, via the ability to activate and repress transcription NFI factors promote an adult type gene expression program while repressing a fetal one. Interestingly, and in agreement with our studies, comparing the enhancer repertoires between fetal and adult erythropoiesis in humans identified the NFI motif as among the top enriched motifs in gained enhancers in adult cells48. The dual nature of NFI proteins has also been described in different tissues22,49,50 but the mechanisms remain unclear. Repression by NFIA has been suggested to involve direct or indirect displacement of activators22,49. Of relevance, competition between activators and repressors near the HBG1/2 promoters has recently been suggested as a regulatory mechanism for HBG1/2 developmental control12,20. However, an initial search of transcription factor occupancy databases failed to reveal candidate activators whose binding sites overlap with NFI binding sites at the HBG genes. Interaction with transcriptional repressors is another possible mechanism by which NFI proteins might silence the HBG genes22. Murine NFIX has been found in a molecular complex with SOX651, a previously described repressor of embryonic globin genes in mice52. However, SOX6 did not score in our screen for HbF regulators9, and its role in human HbF control remains uncertain12. As far as transcription activation is concerned, NFI factors have been reported to recruit co-activators or polymerase components22 including the Mediator complex53 and to displace co-repressors22. The detection of NFIA and NFIX at the BCL11A intronic enhancers (Fig. 4) and their requirement for chromatin accessibility (Fig. 5) indicates that they directly stimulate BCL11A enhancer activity. However, the molecular context that enables NFIA and NFIX to activate (e.g., BCL11A) and repress transcription (e.g., HBG) at different genes requires further investigation.
A role for BCL11A and LRF in HBG silencing is strongly supported by genetic evidence1. The link between BCL11A and HbF levels was discovered by GWAS2,3, and disruption of binding sites for BCL11A or LRF at the HBG1/2 genes underlies some forms of HPFH (Hereditary Persistence of Fetal Hemoglobin), supporting their direct roles in HBG silencing7. Of note, NFIX was also implicated as an HbF modulator in a GWAS23, however, in light of the mild effects of NFIX loss on HbF levels, it remains unclear to what extent the reported sequence variant in the NFIX gene is causative for elevated HbF levels in carriers.
Our data show that near complete loss of NFIA and NFIX in adult erythroid cells led to substantial HbF upregulation and reduction in sickling of SCD-patient-derived erythroid cultures (Fig 2 and Extended Data Fig. 3). Therefore, disruption of NFIA and NFIX genes or inhibiting their transcriptional activities might be beneficial for β-globin disorders1. It is noteworthy that NFIA and NFIX protein levels are lower in fetal erythroid cells compared to adult cells, indicating that most non-globin erythroid functions are preserved in the absence of a full dose of NFI proteins. Thus, interference with NFI factor expression or activity might be well tolerated when aiming to raise HbF levels in patients with SCD or β-thalassemia.
Methods
Mouse transplantation experiments in this study were approved by the Institutional Animal Care and Use Committee (IACUC) of the St. Jude Children’s Research Hospital (protocol#: 579-100477-05/17). All other experimental procedures in this study were in compliance with research policy of the Children’s Hospital of Philadelphia.
Cell Culture.
HUDEP2 cells stably expressing SpCas9 (HUDEP2C) were established by transducing parental cells with SpCas9-puro lentivirus (Addgene, #108100)9,10,28,54. Cells were maintained in media containing StemSpan SFEM (StemCell Technologies, 9650) supplemented with 50 ng/ml recombinant human stem cell factor (SCF, Peprotech, 300-07), 3 IU/ml Epoetin alfa (Epogen, Amgen), 0.4 μg/ml dexamethasone (Sigma Aldrich, D9891), 1 μg/ml doxycycline (Sigma Aldrich, D9891) and 1% Pen-Strep (Invitrogen, 15140122). Cell densities throughout the culture were kept under 0.8 million/ml. Erythroid differentiation was induced by placing 2-5 million HUDEP2 cells into 1× Iscove’s modified Dulbecco’s medium (IMDM, Mediatech, MT10016CV) supplemented with 1% L-glutamine, 330 μg/ml human holo-transferrin (Sigma Aldrich, T4132), 10 μg/ml recombinant human insulin solution (Sigma Aldrich, I9278), 2 IU/ml heparin, 5% inactivated fetal bovine serum (FBS), 3 IU/ml Epoetin alfa (Epogen, Amgen), 1 μg/ml doxycycline and 1% Pen-Strep. Fresh media were replaced on day 3 and maintained for another 2-3 days before cells were used for analysis.
G-CSF mobilized human peripheral blood CD34+ hematopoietic stem and progenitor cells (HSPCs) were obtained from the Co-Operative Center for Excellence in Hematology at the Fred Hutchinson Cancer Research Center. Frozen cells were thawed according to the provider’s instruction. CD34+ HSPCs derived from human fetal liver were obtained from the Stem Cell and Xenograft Core at University of Pennsylvania. For SCD CD34+ HSPCs, cells were purified from waste apheresis bags of individuals undergoing clinical erythrocytapheresis at Children’s Hospital of Philadelphia with CD34 MicroBead Kit (MACS Miltenyi Biotech, # 130-100-453) following the manufacturer’s instructions55. The biospecimens were provided in a de-identified fashion, and thus are not classified as human subject research as determined by The Children’s Hospital of Philadelphia Research Institute Institutional Review Board. Erythroid differentiation of primary culture was achieved using a three-phase protocol with growth medium prepared in 1× IMDM as following: Phase I, 100 ng/ml human SCF, 5 ng/ml IL-3, 3 IU/ml Epoetin alfa, 2.5% human serum (Sigma, I9278), 10 ng/ml heparin, 10 mg/ml insulin, and 250 mg/ml holo-transferrin; Phase II, 100 ng/ml human SCF, 3 IU/ml Epoetin alfa, 2.5% human serum, 10 ng/ml heparin, and 10 mg/ml insulin, and 250 mg/ml holo-transferrin; Phase III, 3 IU/ml Epoetin alfa, 2.5% human serum, 10 ng/ml heparin, 10 mg/ml insulin, and 1.25 mg/ml holo-transferrin55.
293T cells were cultured in 1× DMEM medium supplemented with 10% FBS, 1× MEM non-essential amino acids (NEAA, Corning, Cat#25-025-CI), 6 mM L-glutamine, 1 mM sodium pyruvate, and 1% Pen-Strep.
CRISPR editing.
All sgRNAs in this study were designed by Benchling (www.benchling.com). Briefly, sgRNAs disrupting NFIA, NFIX, and NFIC genes were targeting gene exon regions and their validity were confirmed by immunoblot and indel analysis, whereas sgRNAs targeting regulatory elements (BCL11A +58 intronic enhancer or NFI binding motifs) were validated by ICE analysis (https://ice.synthego.com/) as described below. See the Supplementary Tables 6–8 for a list of sgRNA sequences.
For Cas9 mediated-editing in HUDEP2, we used the SpCas9 expressing HUDEP2 cells (HUDEP2C) as described above28. For Cas12a-mediated editing, we established the AsCas12a expressing HUDEP2 stable cell line by transducing HUDEP2 parental cells with lentivirus made from pRG232 (Addgene, #149723) and followed by 3 days of 1 μg/ml puromycin selection26. sgRNA synthetic oligonucleotides (Eurofins Genomics) were subcloned into lentiviral pLRG2.1 (Addgene, #108098), pLRCherry2.1 (Addgene, #108099), pRG212 (Addgene, #149722) and pRG212Cherry (GFP in pRG212 were replaced with mCherry from pLRCherry2.1 using BamHI and BsrGI double digestion) using the BsmBI restriction site. Unless otherwise indicated, NFIA and NFIX co-depletion generated by joint delivery of two CRISPR-Cas9 sgRNAs into HUDEP2 cells were named sgNFIA&sgNFIX, whereas sgNFIA&NFIX stands for CRISPR-Cas12a NFIA and NFIX dual sgRNA targeting26.
For CRISPR editing in CD34+ HSPCs, Cas9 Ribonucleoprotein (RNP)s were assembled in sterile PCR tubes and introduced into cells by electroporation using the P3 Primary Cell 4D-Nucleofector Kit (Lonza, V4XP-3032) following the manufacturer’s instructions9,10. 100 pmol chemically modified sgRNA (Synthego) and 50 pmol recombinant SpCas9 (IDT, #1081061) were used to electroporate 100,000 cells.
Indel detection.
Genome edits were detected by PCR amplification of regions of interest followed by Sanger sequencing or next-generation sequencing. Briefly, genomic DNA were extracted from control or CRISPR edited cells using PureLink™ Genomic DNA Mini Kit (Invitrogen, #K182002) according to the manufacturer’s instructions. A 600-bp-long fragment covering the sgRNA targeted sites was amplified using Phusion Flash High-Fidelity PCR Master Mix (Thermo Fisher, F548S).
For Cas12a editing and NFI motif targeting experiments, PCR reactions were purified by QIAquick PCR Purification Kit (Qiagen) and then subject to Sanger sequencing (Eurofins Genomics). The raw ABI files were uploaded to DECODR56 (v3.0, https://decodr.org/) or ICE (https://ice.synthego.com/) website to decomposition and estimate the editing efficiency of sgRNA. See Supplementary Table 9 for a list of PCR primers.
For indel detection in xenotransplant experiments, following the initial PCR amplification as described above, a second PCR reaction was performed using KAPAHiFi HotStart ReadyMix PCR Kit (Roche) to add the Illumina sequencing adapters with multiplexed barcode10,31. The sequencing libraries were pooled and paired-end (2 × 150 bp) sequenced on an Illumina Miseq platform. Results were analyzed by CRISPResso10,31,57.
Mouse studies.
6–8-week-old, female NBSGW (NOD.Cg-KitW-41J Tyr+ Prkdcscid Il2rgtm1Wjl/ThomJ, Stock#026622) mice were obtained from the Jackson Laboratory (Bar Harbor, ME, USA). Mice were housed in a conventional facility at ambient temperature of 20-22 °C with 40-60% humidity and with a 12-h day-night light cycle. Frozen CD34+ cells isolated from adult human peripheral blood as described above were thawed in X-VIVO medium (Lonza, #04-380Q) and electroporated with CRISPR/Cas9 RNPs as described above. 2 million control or SpCas9 RNP edited CD34+ cells were equally administered into 5 mice via tail-vein injection. Mouse bone marrows were harvested 16 weeks post-transplantation to assess engraftment and cell lineage composition using anti-CD45 (BD Biosciences, #560367), human-specific PE anti-CD49d (BioLegend, # 304304), PE/Cy7 anti-CD71 (BioLegend, #334112), FITC anti-human CD235a (BioLegend, #349104), PE anti-CD33 (BioLegend, #366608), APC anti-CD19 (BioLegend, #302212) and anti-Fetal-Hemoglobin (HbF-1), and anti-APC (Thermo Fisher Scientific, #MHFH05) antibodies. CD235a+ erythroblasts were purified using antibody-coated microbeads (Miltenyi Biotec, #130-050-501) and analyzed for indels, intracellular HbF staining, hemoglobin HPLC, and RNA analysis.
Lentivirus production and lentiviral transduction.
Lentivirus production were performed using 293T cells28. Briefly, 10 μg sgRNA lentiviral vector, 7.5 μg psPAX2 and 5 μg pVSVG packaging plasmid were transfected into confluent 293T cells in a 10-cm dish with 80 μl polyethylenimine (PEI, Sigma, #408727). The supernatants containing virus particles were harvested at 48 h post-transfection. For lentiviral transduction, 0.5 million HUDEP2 cells were spin-infected with 1 ml virus in the presence of 8 μg/ml polybrene, which were performed at 1,126 g for 1.5 h in a desktop centrifuge. The transduced HUDEP2 cells were sorted using BD FACS Aria Fusion Sorter at the Children’s Hospital of Philadelphia Flow Cytometry Core.
Immunoblotting.
Immunoblotting of proteins were performed by following standard protocol. Briefly, total protein from HUDEP2 cells at day 5 of differentiation or primary cells at day 13 of differentiation were extracted with RIPA buffer (50 mM Tris-HCl, pH 7.4, 150 mM NaCl, 1% Triton X-100, 0.5% sodium deoxycholate, 0.1% SDS, 1 mM EDTA)58. Equivalent amounts of protein (10-20 µg) were loaded onto 4-12% or 10% Bis-Tris protein gels (Invitrogen) and separated in 1× MES-SDS running buffer (Invitrogen, NP0002). Separated proteins were transferred onto PVDF membrane and incubated with primary antibodies overnight. Primary antibodies used were anti-NFIA (Active Motif, #39397), 1:5,000; anti-NFIX (clone 3D2, Sigma Aldrich, SAB1401263), 1:500; anti-NFIC (Cell Signaling, #11911), 1:1,000; anti-BCL11A (Abcam, ab19487), 1:1,000; anti-LRF (Thermo Fisher Scientific, #14-3309-82), 1:2,000; anti-hemoglobin γ (Santa Cruz, #21756), 1:1,000; anti-β-Actin (Santa Cruz, #47778), 1:1,000; anti-HA (Cell Signaling, #3724), 1:1,000.
Gene expression.
Total RNA from HUDEP2 cells at day 5 of differentiation and primary erythroid cells at day 13 of differentiation were extracted with RNeasy Plus Mini Kit (Qiagen, Cat#74136) following the manufacturer’s instructions. Total RNA from CD49d+, CD235a+ sorted cells were extracted with RNeasy Micro Kit (Qiagen, Cat#74004). Genomic DNA was removed by in-column DNase I digestion. 100-400 ng of total RNA was converted to cDNA using iScript™ master mix (Bio-Rad, Cat#1708841). See the Supplementary Table 10 for a list of primers used for quantitative real-time PCR. The ∆∆Ct method was used for quantifications. Values of 18s rRNA, GAPDH, β-Actin, or AHSP were used as the endogenous control as indicated.
HbF staining and analysis.
1-2 million HUDEP2 cells at day 5 of differentiation, or primary erythroid cells at day 15 of differentiation were washed with PBS and fixed in 0.05% glutaraldehyde (Sigma Aldrich, G6257) for 10 min. After three washes with PBS, cells were permeabilized with 0.1% Triton for 3 min at room temperature and stained with an APC-conjugated HbF antibody (NB110-41084, Novus Biological) on ice for 15-20 min. 1:500 dilution was used for HUDEP2 cells and 1:2,000 for primary cells, respectively. Data were acquired in a BD FACSCanto machine and analyzed by BD FACSDiva (8.0.2) and FlowJo V9.7.6. See Extended Data Figure 1d for a representative gating strategy for HbF staining.
Sickling assay.
Primary cells derived from SCD CD34+ HSPCs at day 21 of culture were resuspended in 100 μl HEMOX buffer supplemented with 20 mM glucose and 0.32% BSA. Cells were incubated under 2.5% O2 at 37 °C for 1 hour. Cells were immediately fixed with 200 μl 2% glutaraldehyde solution. Fixed cell suspensions were spread onto glass micro slides (Fiber Optic Center) and examined by bright field microscopy (40× magnification) of single-layer cells on an Olympus BX40 microscope fitted with an Infinity Lite B camera (Olympus), and the coupled Image Capture software. Images were randomized and blinded, and the percentage of sickled cells was obtained by manually counting the number of sickled cells.
BCL11A cDNA rescue experiment.
BCL11A cDNA rescue experiment was performed in gene edited HUDEP2 cells. Briefly, BCL11A-HA-ER-IRES-CFP cDNA lentiviral vector9,54 was introduced into control, NFIA&NFIX co-depleted or BCL11A +58 sgRNA targeted HUDEP2C cells by spin-infection as described above. CFP+ cells were enriched by FACS. Cells were maintained in expansion media and induced for differentiation for 5 days as described above in the presence of 10 μM tamoxifen and mature red cells were subject to RT-qPCR analysis.
Electrophoretic mobility shift assay (EMSA).
293T cells were utilized to generate NFIA and NFIX nuclear extracts. Briefly, 5 μg NFIA or NFIX cDNA with an AM tag plasmid were transfected into 6 million 293T cells by 20 μl PEI. After 48 h, 293T cell nuclei were isolated and lysed as described59. Soluble nuclear extracts were extracted by 0.4 M ammonium sulfate (AS) and dialyzed59. All EMSA experiments were performed with the Odyssey infrared EMSA Kit (LICOR, cat#829-07910) according to the manufacturer’s instruction. Oligonucleotides labeled with IRDye 700 were obtained from IDT. Data were acquired in an Odyssey Imaging System (LICOR). The antibody used for generating “supershift” was anti-AM (Active Motif, #61677). See the Supplementary Table 11 for a list of EMSA oligonucleotide sequences.
Hemoglobin high-performance liquid chromatography (HPLC).
1 million primary cells at day 15 of differentiation were collected for HPLC. After one wash in PBS, cells were lysed in 150 μl MilliQ H2O at room temperature for 15 min. Cell debris was cleared by centrifugation at maximum speed on a desktop centrifuge and analyzed with a Hitachi D-7000 Series (Hitachi Instruments, Inc., San Jose, CA), and a weak cation-exchange column (Poly CAT A: 35 mm × 4.6 mm, Poly LC, Inc., Columbia, MD). Cleared lysates from normal human cord blood samples (high HbF content) and a commercial standard containing approximately equal amounts of HbF, A, S, and C (Helena Laboratories, Beaumont, TX) were used as reference isotypes. Hemoglobin isotype peaks were eluted with a linear gradient of phase B from 0 to 80% at A410 nm (Mobile Phase A: 20 7 mM Bis-Tris, 2 mM KCN, pH 6.95; Phase B: 20 mM Bis-Tris, 2 mM KCN, 0.2 M sodium chloride, pH 6.55).
Wright-Giemsa staining.
0.1 million primary cells at day 15 of differentiation were harvested in PBS and spun on slides using a Cytospin 4 centrifuge (Thermo Fisher Scientific, #A78300003). Slides were stained for 2 minutes in May Grünwald (Sigma Aldrich) and 10 minutes in Giemsa stain (Sigma Aldrich) with 1:20 dilution55.
RNA-Seq and data analysis.
To assess genome-wide gene expression changes in HUDEP2 upon NFIA, NFIX single depletion, or NFIA& NFIX co-depletion, we prepared two replicates for each condition and two sgRNAs for each gene. RNA extractions were performed as described above. RNA-seq libraries were prepared using the TruSeq Stranded Total RNA kit (Illumina, San Diego, CA, USA) following the manufacturer’s instruction28 and sequenced on the Illumina Nextseq 500 platform.
RNA-seq data were processed using standard ENCODE project pipeline at https://www.encodeproject.org/pipelines/ENCPL002LPE/. Briefly, raw reads were aligned to the hg38 reference genome using STAR (2.7.4a)60 and quantified by RSEM (1.3.2)61. Differential expression analysis was performed with Deseq262 package (1.32.0) in R (4.1.0). We used adjusted P <0.05 and Fold Change > 1.5 as thresholds to identify differentially expressed genes. Clustering analysis was performed using DEGreport package (1.28.0). Gene set enrichment analysis was performed using clusterProfiler63 package (4.0.5). Gene sets were obtained from Lessard et al.24 and listed in the Supplementary Table 4. All plots were generated by the ggplot2 package (3.3.5) in R (4.1.0).
CUT&RUN and data Analysis.
0.5-1 million undifferentiated HUDEP2, HUDEP2 at day 2 of differentiation, or primary cells at day 8 of differentiation were used for CUT&RUN. We followed the experimental procedures published by Henikoff laboratory with minor adaptations35. Antibody incubations were performed in 300 μl PCR tubes for 2 h at 4 °C with rotation. pAG-MNase were obtained from Cell Signaling. Antibodies used in this study were: IgG (Cell signaling, #3900), anti-NFIA (Thermo Fisher Scientific, PA5-52252), anti-NFIX (Sigma Aldrich, SAB1401263), anti-H3K27ac (Invitrogen, MA5-23516). Anti-NFIA antibodies used in Extended Data Figure 6 were obtained from Sigma, #HPA008884; Active Motif, #39397; Invitrogen, #535936. Approximately 2 μg antibody were used per 200 μl reaction. The released DNA fragments were quantified by Qubit and sequencing libraries were generated using NEB Kits (E7645 and E6440S) with 15-30 ng input DNA6. The barcoded libraries were pooled and paired-end (2×50 bp) sequenced on the Illumina Nextseq 2000 platform.
Sequencing data from CUT&RUN were analyzed by CUT-RUNTOOLS-2.064 using default settings (https://github.com/fl-yu/CUT-RUNTools-2.0).
ATAC-seq and data analysis.
Two replicates of 50,000 control and NFIA&NFIX co-depleted HUDEP2 cells growing in expansion media were washed with 1× cold PBS and lysed in a modified Omni-ATAC-seq lysis buffer (10 mM Tris-HCl, pH 7.5, 10 mM NaCl, 3 mM MgCl2, 0.1% NP-40, 0.1% Tween-20 and 0.01% Digitonin) for 3 min. The lysates were washed 3 times with buffer (10 mM Tris-HCl, pH 7.5, 10 mM NaCl, 3 mM MgCl2, and 0.1% Tween-20) and spun at 500g for 10 min to harvest the nuclei. Transposition reaction was performed using Illumina Tagment DNA Enzyme and Buffer (Cat#20034197) in the presence of 0.1% Tween-20 and 0.01% Digitonin. DNA was isolated using Qiagen MinElute Reaction Cleanup Kit following the manufacturer’s instruction. Sequencing libraries were generated using NEB High Fidelity 2× PCR Master Mix using the following cycles: (1) 72 °C, 5 min (2) 98 °C, 30 sec (3) 98 °C, 10 sec (4) 63 °C, 30 sec (5) 72 °C, 1 min (6) Repeat steps 3-5, 10× (7) hold at 4 °C. The amplified DNA fragments were cleaned, and size selected by SPRIselect beads. The libraries were paired-end (2×50 bp) sequenced on Illumina Nextseq 2000 platform.
ATAT-seq data were processed using standard ENCODE project pipeline at https://www.encodeproject.org/pipelines/ENCPL787FUN/. Briefly, raw reads from ATAC-seq were trimmed and filtered by Trimmomatic (0.36) and aligned to the human genome (hg38) by bowtie265 (2.4.2, --very-sensitive --dovetail --phred33 -X 1000). Mitochondria reads, PCR duplicates and unmapped reads were removed by samtools (1.13)66. All remaining reads aligning to the plus strand were offset by +4 bp and aligning to the minus strand were offset −5 bp by deeptools (3.5.1)67. Peaks were called by macs268 (2.2.7.1, --nomodel --keep-dup=all -f BAMPE) and normalized by using the scale factor generated by calcNormFactors function in edgeR 69 package (3.34.1) in RStudio (1.4.1717). Differential binding analysis was performed with Deseq2 62 package (1.32.0).
Statistical analysis.
All results were presented as the mean ± standard error of the mean (SEM). Individual data points representing biological replicates were included in all the graphs. Statistical analysis was performed by two-tailed Student’s t-test. P value < 0.05 was considered statistically significant.
Extended Data
Extended Data Fig. 1. Co-depletion of NFIA and NFIX reactivates γ-globin in HUDEP2 cells.
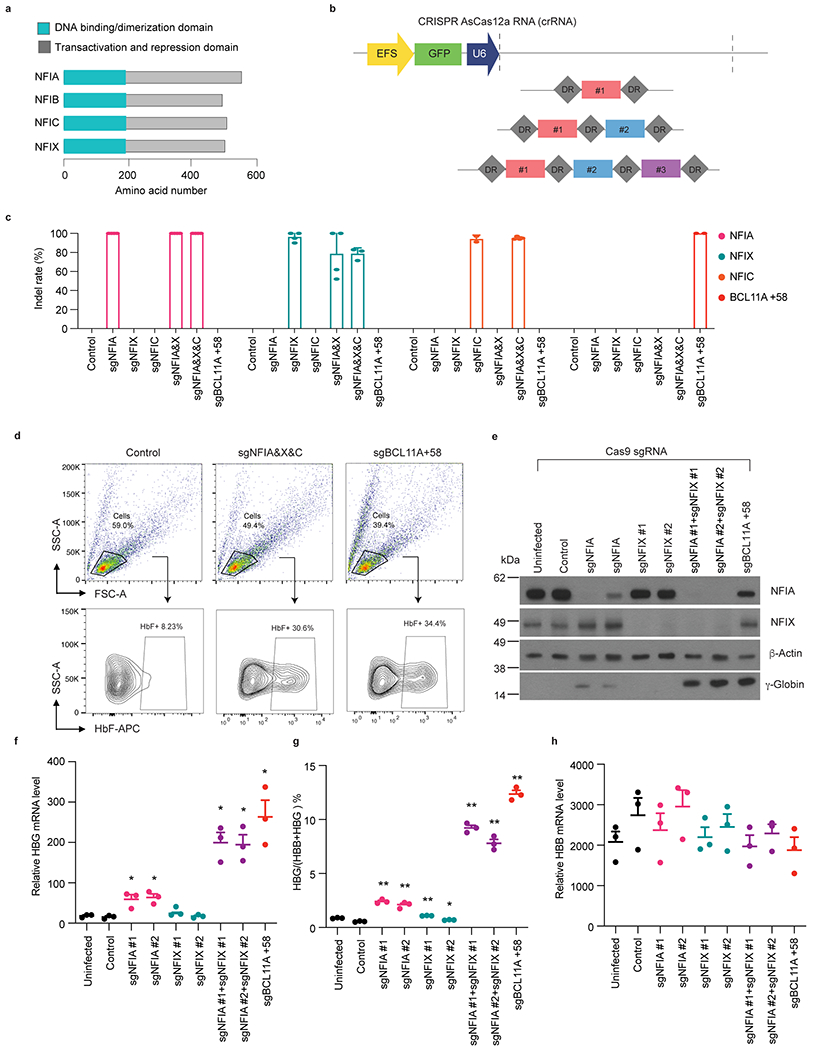
a, Diagram depicting the structure of NFI gene products. b, Schematic of multiplex AsCas12a sgRNAs. c, Editing efficiency of NFIA, NFIX, NFIC, and BCL11A +58 intronic enhancer in indicated sgRNA infected HUDEP2 cells by AsCas12a (control, n = 4; sgNFIA, n = 4; sgNFIX, n = 4, sgNFIC, n = 2; sgNFIA&X, n = 3; sgNFIA&X&C, n = 4; sgBCL11A +58, n = 2). n represent biological replicates generated from different experiments. Genomic DNAs were obtained from indicated 5 days post-infected HUDEP2 cells. d, Representative gating strategy and HbF staining results in control and indicated Cas12a sgRNA-infected HUDEP2 cells. The first gate selects the live cells in the population. The second gate distinguishes the HbF+ and HbF− population. Experiments were performed twice with similar results. e-h, HUDEP2 cells expressing CRISPR-Cas9 were infected with pLRG2.1 or pLRCherry2.1 lentivirus carrying control sgRNA or sgRNAs targeting indicated NFI genes or the BCL11A +58 enhancer and analyzed at the end of 5 days differentiation. e, Representative immunoblots of NFIA, NFIX, and γ-globin. β-Actin was used as loading control. Experiments were performed three times with similar results. f-h, RT-qPCR quantification of HBG1/2, HBB, and the ratio of HBG/(HBG+HBB) mRNA. Data were normalized to GAPDH (n = 3) and expressed as means ± SEM. *p < 0.05, **p < 0.01. p values were calculated by comparing indicated samples to control with parametric paired two-tailed Student’s t test. f, sgNFIA #1, p = 0.0422; sgNFIA #2, p = 0.0161; sgNFIX #1, p = 0.0644; sgNFIX #2, p = 0.4230; sgNFIA&NFIX#1, p = 0.0154; sgNFIA&NFIX#2, p = 0.0150; sgBCL11A +58, p = 0.0288. g, sgNFIA #1, p = 0.0033; sgNFIA #2, p = 0.0052; sgNFIX #1, p = 0.0005; sgNFIX #2, p = 0.0265; sgNFIA&NFIX#1, p = 0.0007; sgNFIA&NFIX#2, p = 0.0024; sgBCL11A +58, p = 0.0009.
Extended Data Fig. 2. Co-depletion of NFIA and NFIX reactivates γ-globin in primary erythroblasts derived from healthy donors.
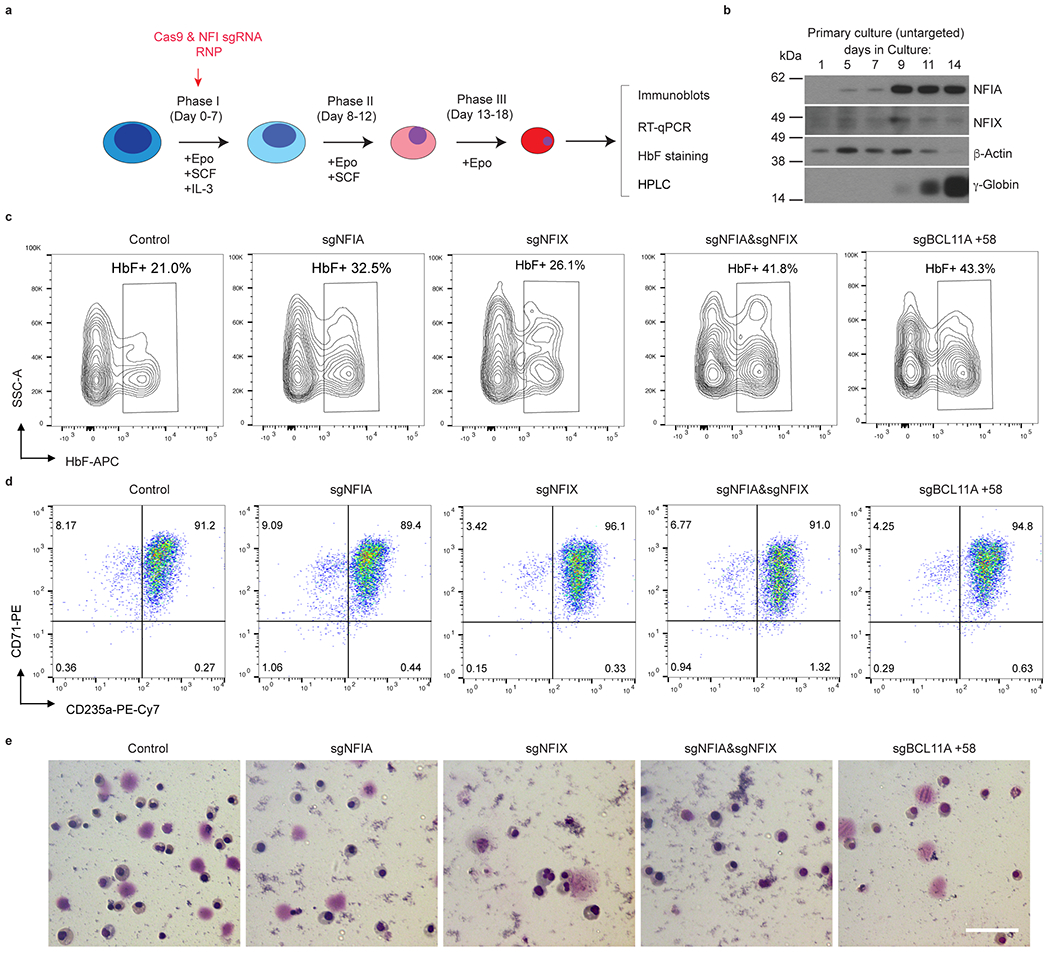
a, Three-phase in vitro culture system for human CD34+ HSPCs to differentiate into mature red cells. Cas9 and indicated NFI sgRNA RNPs were transfected into CD34+ HSPCs on day 4 of culture by electroporation. Erythroblasts were harvested and analyzed by RT-qPCR, immunoblot, HbF staining, and HPLC on day 13 or 15 of culture. b, Representative immunoblots of NFIA, NFIX, and γ-globin from untargeted primary cells at indicated days of differentiation. Experiments were performed on two donors with similar results. c, Representative HbF staining result from indicated gene edited primary erythroblasts at day 15 of differentiation. d, Representative CD71 and CD235a flow cytometry of primary erythroblasts at day 15 of differentiation. e, Representative Wright-Giemsa stains of primary erythroblasts at day 15 of differentiation. Experiments in c-e were performed on three donors/biological replicates with similar results. Scale bar, 25 μm.
Extended Data Fig. 3. Co-depletion of NFIA and NFIX reactivates γ-globin in primary erythroblasts derived from SCD patients.
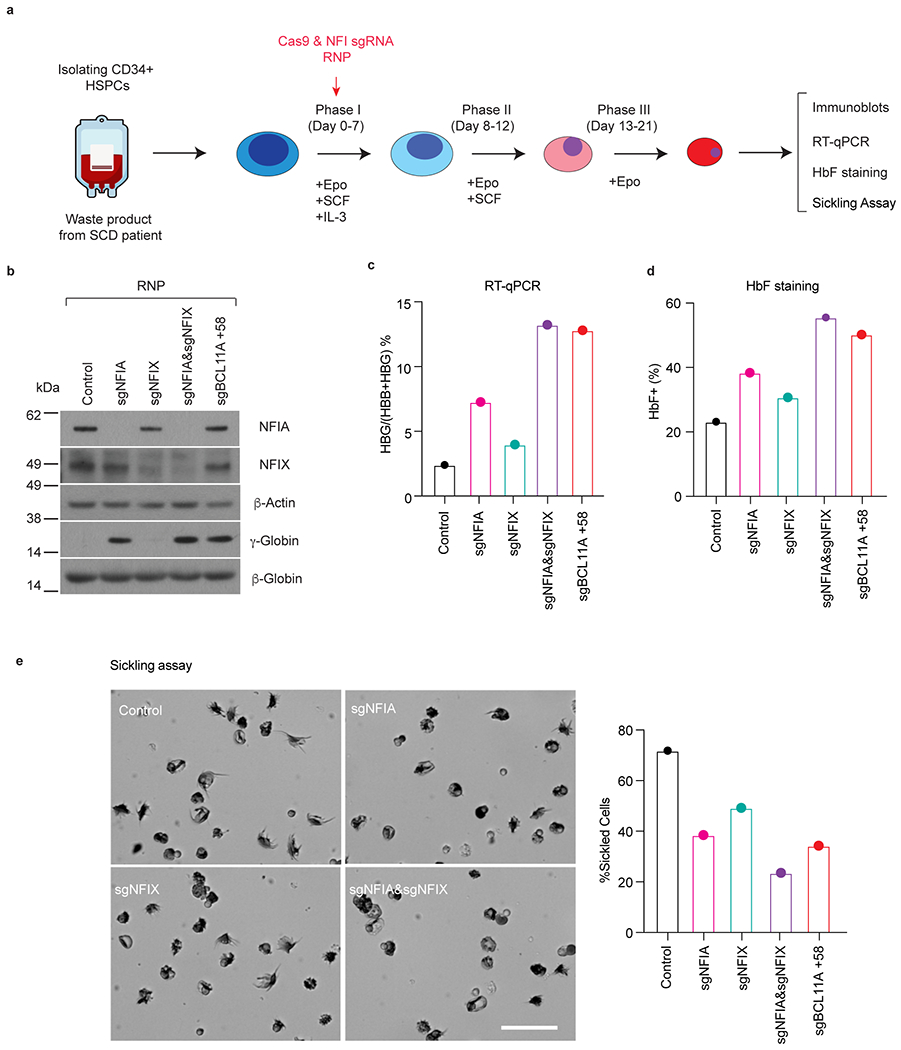
a, Procedure for depleting NFIA and/or NFIX in SCD CD34+ HSPCs in primary culture (n = 1). Isolated CD34+ HSPCs were transfected by indicated RNPs on day 4 of culture. On day 13, a subset of cells was harvested for RT-qPCR analysis. On day 15, a subset of cells was harvested for immunoblots and HbF flow cytometry analysis. On day 21, the remaining cells were collected for low O2 sickling assay. b, Immunoblots of NFIA, NFIX, γ-globin, and β-globin (n = 1 donor). c, The ratio of HBG/HBG+HBB as determined by RT-qPCR (n = 1 donor). d, HbF+ fraction (%) as determined by HbF flow cytometry (n = 1 donor). e, Representative micrographs of sickle cells, and quantification of the percentage of sickle cells (n = 1 donor). Scale bar, 25 μm.
Extended Data Fig. 4. Co-depletion of NFIA and NFIX strongly reactivates γ-globin in human-to-mouse xenotransplants.
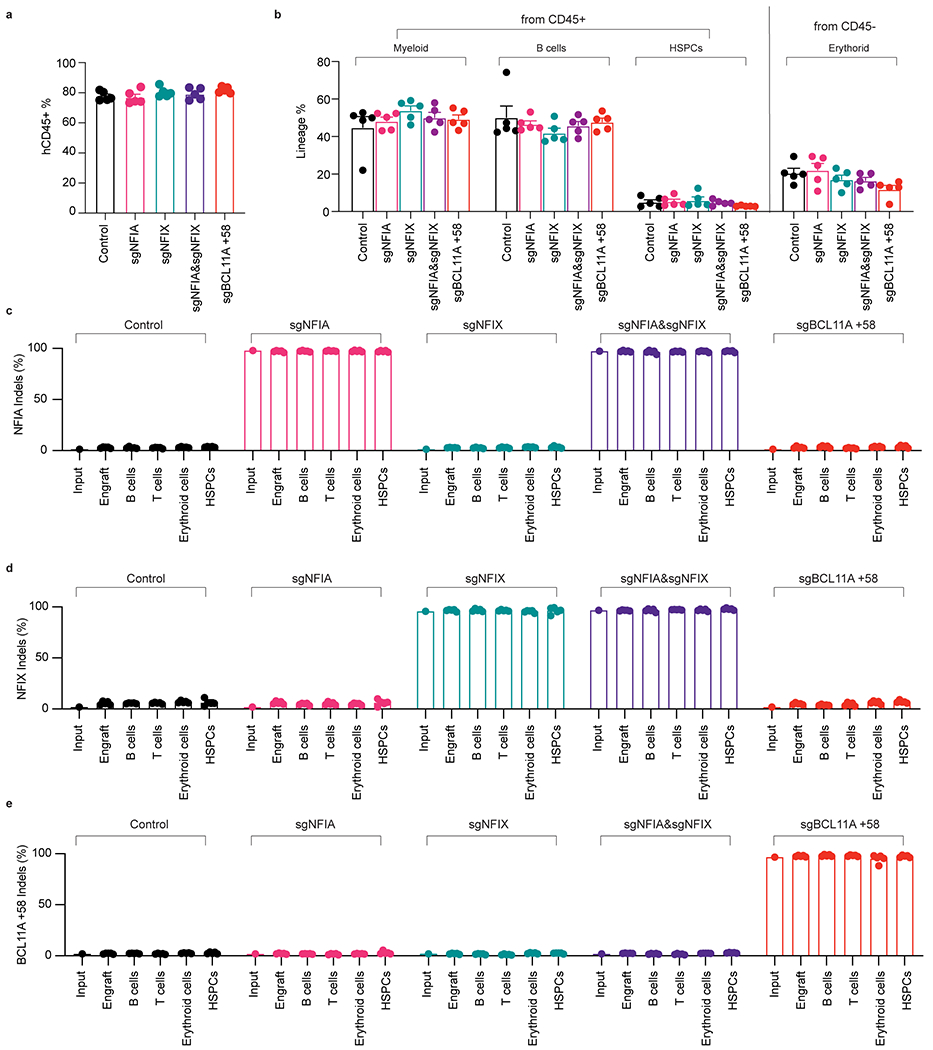
a, Percentage of human CD45+ cells in the bone marrow of the transplanted NBSGW mice (n = 5 mice/biological replicates). b, Composition of myeloid, B cells, and HSPCs from CD45+ sorted population and percentage of erythroid cells from hCD45- cells (n = 5 mice/biological replicates). c-e, Indel analysis of NFIA, NFIX, and BCL11A in input HSPCs, total engrafted cells, B cells, T cells, and HSPCs isolated from indicated recipient animals 16 weeks post-transplantation (n = 5 mice/biological replicates). Data are expressed as means ± SEM.
Extended Data Fig. 5. NFIA and NFIX support an adult-type erythroblast transcription program.
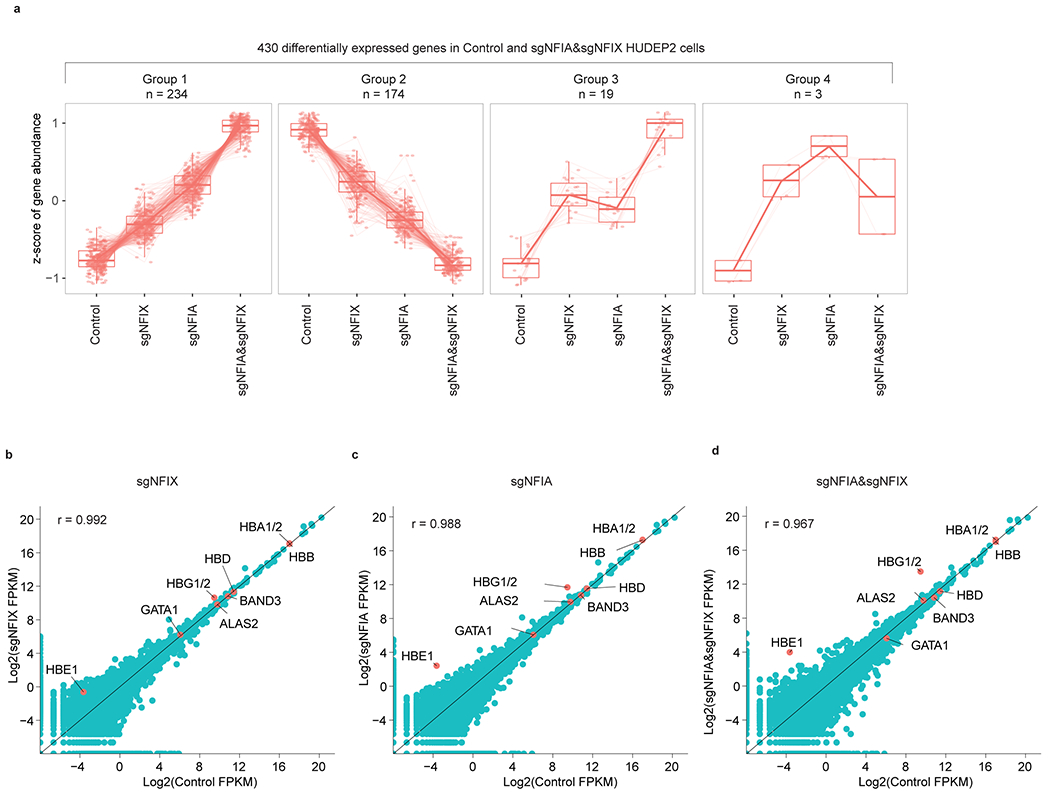
a, Clustering analysis of 430 NFIA and NFIX co-depletion affected genes in HUDEP2 cells. A total of four distinct expression patterns are identified. Boxplot showing expression levels of genes in Group1 (n = 234) and Group2 (n = 174) display a correlation with the dosage of total NFI proteins. Y-axes represent z-scores of gene abundance. Lower whisker, smallest observation greater than or equal to lower hinge - 1.5 x Interquartile range (IQR); lower hinge, 25% quantile; median, 50% quantile; upper hinge, 75% quantile; upper whisker, largest observation less than or equal to upper hinge + 1.5 x IQR. b-d, Scatter plot showing the comparison of adult globin genes (HBA1/2, HBB, and HBD) and red cell differentiation-related genes (GATA1, ALAS2, and BAND3) in representative control, NFIA and NFIX single or co-depleted (sgNFIA&NFIX) HUDEP2 cells.
Extended Data Fig. 6. Characterization of NFIA and NFIX genomic occupancy profiles by CUT&RUN.
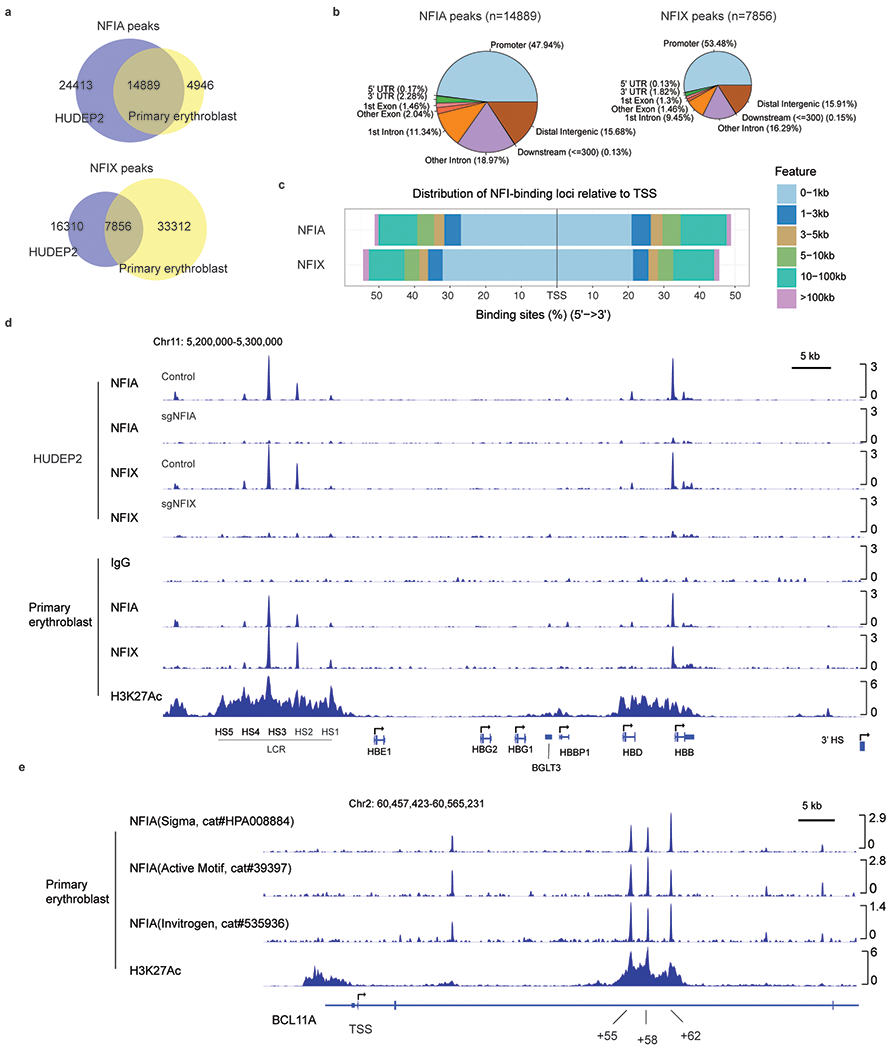
a, The statistics of NFIA and NFIX peaks identified from HUDEP2 and primary erythroblast CUT&RUN experiments. b, Genomic features of NFIA and NFIX CUT&RUN peaks. c, Distribution of NFIA and NFIX-binding loci relative to gene transcription start site. d, Genomic occupancies of NFIA and NFIX at β-globin locus in HUDEP2 and primary erythroblasts. NFIA KO (sgNFIA), NFIX KO (sgNFIX), and IgG were used as controls. e, CUT&RUN signals at the BCL11A locus with three indicated NFIA antibodies in primary cells at day 10 of differentiation.
Extended Data Fig. 7. NFI factors support BCL11A gene expression in adult erythroid cells.
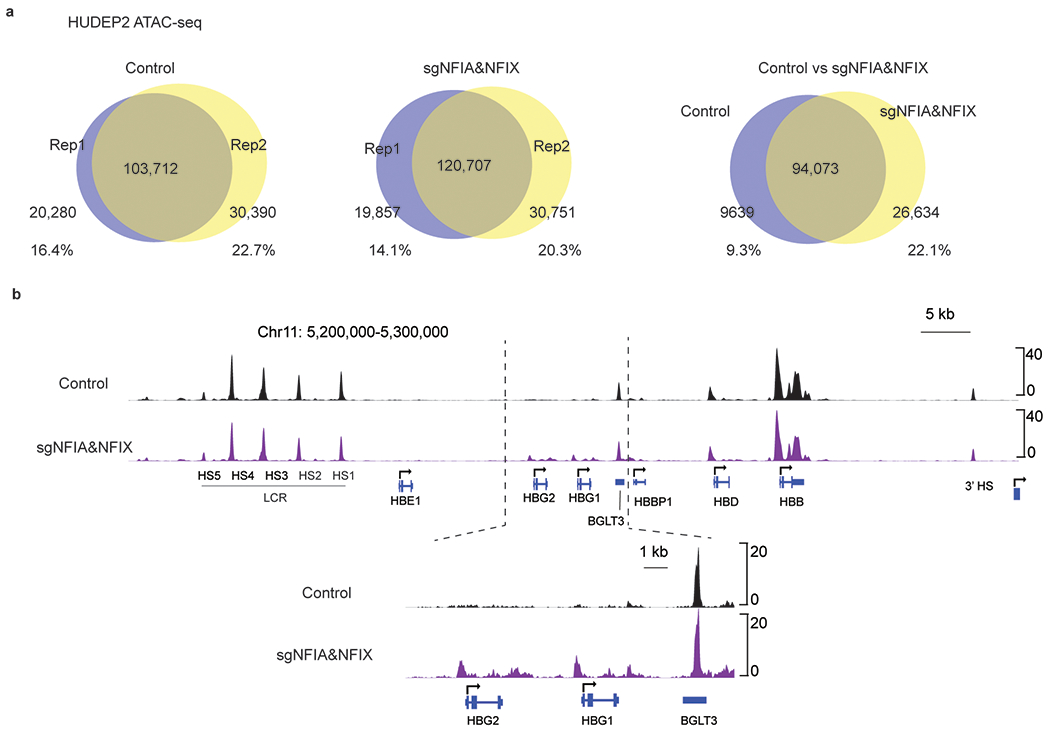
a, Venn diagrams showing statistics of ATAC-seq peaks (chromatin open regions) in control and NFIA and NFIX co-depleted (sgNFIA&NFIX) replicate samples. b, ATAC-seq tracks at the β-globin locus in control and NFIA and NFIX co-depleted (sgNFIA&NFIX) HUDEP2 cells.
Extended Data Fig. 8. NFI factors directly silence HBG1/2 genes.
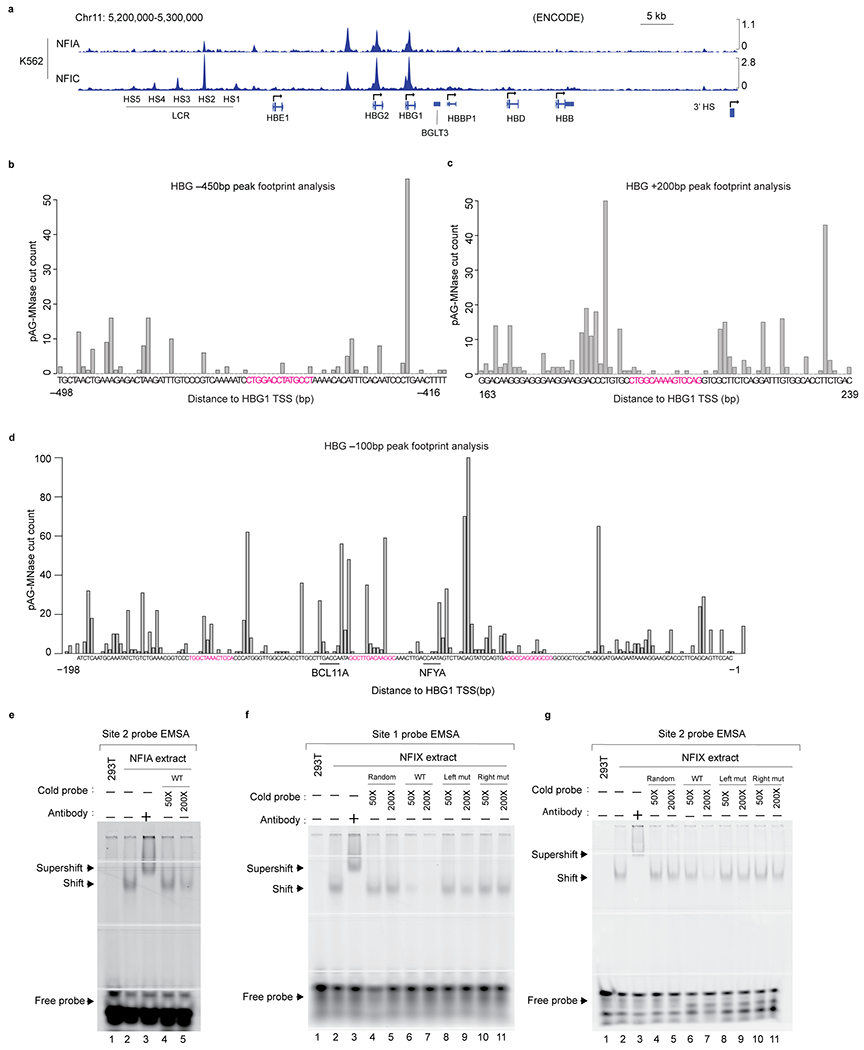
a, NFIA and NFIC ChIP-seq signals at the β-globin locus in K562 cells. NFIA ChIP-seq data were downloaded from GEO (GSM2574788) and NFIC ChIP-seq data were downloaded from ENCODE (ENCSR796ITY). b-c, Footprint analysis of NFIA CUT&RUN data at NFI binding sites that were protected from pAG-MNase cut in CUT&RUN assays. The location of site 1 is approximately 450 bp upstream of HBG1/2 TSS (transcription start site), whereas site 2 is in HBG1/2 first intron, 200 bp downstream of HBG1/2 TSS. Data were aggregates from three replicates of NFIA CUT&RUN-sequencing results in HUDEP2 clone 6 cells. d, Footprint analysis of NFIA CUT&RUN data at the HBG1/2 TSS-proximal region. Boxes denote three putative NFI binding sites that were not protected from the pAG-MNase cut in CUT&RUN assays. The BCL11A and NFYA binding sites are underlined3. Data were aggregates from three replicates of NFIA HUDEP2 clone 6 CUT&RUN. e-g, Electrophoretic mobility shift assay (EMSA) examining the binding of NFIA (e) and NFIX (f-g) with probes containing identified NFI binding sites sequence. In all experiments, the interaction of NFIA/NFIX and IRDye 700 labeled probes produced a gel shift which was competed with unlabeled cold probes in 50 (50x) or 200 (200x) times excess molar concentration, including a random sequence (random), wild type (WT), or two mutant sequences (Left mut or Right mut) containing either left or right half of the NFI full motif (TGGA or GCCT for site 1 and TGGC or TCCA for site 2). The identity of the NFIA/X-DNA complex was verified with an anti-AM tag antibody that recognized the recombinant NFIA or NFIX protein and generated a “supershift”. Left mut: probes contain four mutated sequences at the left half of the NFI motif sequences; Right mut: probes contain right mutated sequences at the left half of the NFI motif sequences.
Extended Data Fig. 9. Two putative NFI motifs are required for NFI binding in HBG1/2 genes.
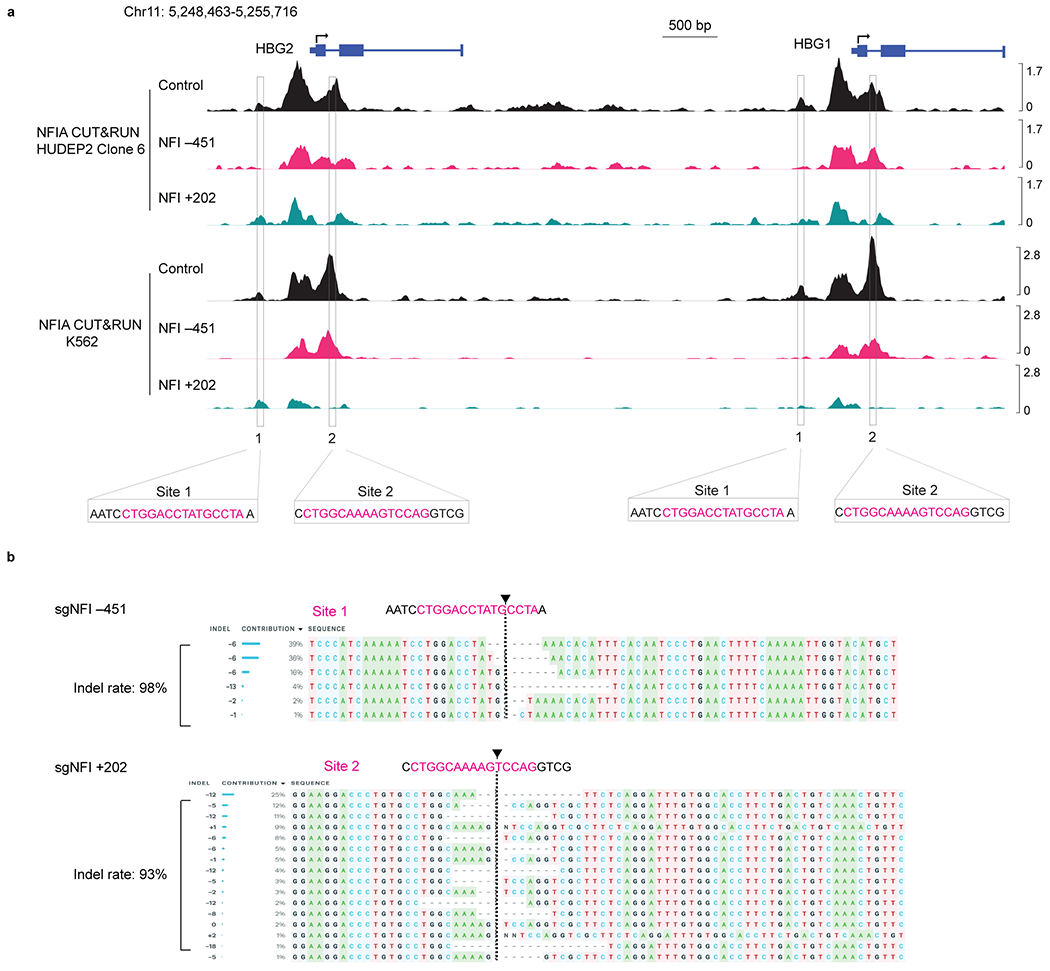
a, HUDEP2 clone 6 and K562 cells expressing CRISPR-Cas9 were infected with sgRNAs targeting NFI binding site 1 (NFI −451) and site 2 (NFI +202). NFIA CUT&RUN tracks at the HBG1/2 gene locus in control and NFI binding site 1 (NFI −451) and site 2 (NFI +202) edited HUDEP2 clone 6 and K562 cells. b, HUDEP2 Δεγδβ/GγAγ cells expressing CRISPR-Cas9 were infected with sgRNAs targeting NFI binding site 1 (NFI −451) and site 2 (NFI +202). Genomic DNA of control and edited cells were isolated and subject to PCR and sanger sequencing analysis (n = 2 biological replicates generated from independent experiments). The arrows denote the sgRNAs target sites.
Supplementary Material
Supplementary Tables 1-5
Supplementary Tables 6-11
Unprocessed Western Blots
Unprocessed Western Blots
Unprocessed Western Blots
Unprocessed EMSA gels
Unprocessed Western Blots
Unprocessed Western Blots
Unprocessed Western Blots
Unprocessed EMSA gels
Acknowledgments
We thank the staff of CHOP Flow Cytometry Core Facility for assistance with cell sorting, and members of the Blobel laboratory for helpful discussions. HUDEP2 cells were a gift from R. Kurita and Y. Nakamura (RIKEN BioResource Center). This work was supported by NIH grants from the National Heart, Lung, and Blood Institute (HL119479) and research funding from Pfizer (G.A.B.); the National Institute of Diabetes and Digestive and Kidney Diseases (R24DK106766) (G.A.B., M.J.W., and R.C.H.); P01HL053749 (to M.J.W.), R01HL156647 (to M.J.W.), the Assisi Foundation of Memphis (to M.J.W.); Doris Duke Charitable Foundation grant 2017093 (to M.J.W.); R01HL147879 (to S.T.C); K08 training grant (K08-DK129716) and the Doris Duke Charitable Foundation Physician Scientist Fellowship grant #2020062 (S.A.P.); T32 training grant (HL007150-42) and an American Society of Hematology Research Training Award for Fellows (E.K.); NIDDK F32DK118822 and Cooley’s Anemia Foundation (to P.A.D.); and the St. Jude Children’s Research Hospital Collaborative Research Consortium on Novel Gene Therapies for Sickle Cell Disease. We thank the DiGaetano family for their generous support.
Footnotes
Competing interests
The authors declare that there is no duality of interest associated with this manuscript.
Code availability
All code processing sequencing data were obtained from previous established pipelines and provided in this article.
Data availability
All RNA-seq, CUT&RUN and ATAC-seq data generated in this study have been deposited in the NIH Gene Expression Omnibus (GEO) with the accession code GSE180871. Gene abundance in fetal and adult erythroid cells were obtained from GSE9087824. Gene sets used for GSEA analysis were provided in this article. HUDEP2 CRISPR screen results were obtained from Table S1 of a published study9. All unprocessed immunoblot scanned images and uncropped gel images are included in the source data.
References
- 1.Orkin SH Molecular Medicine: Found in Translation. Med 2, 122–136 (2021). [DOI] [PMC free article] [PubMed] [Google Scholar]
- 2.Menzel S et al. A QTL influencing F cell production maps to a gene encoding a zinc-finger protein on chromosome 2p15. Nat. Genet 39, 1197–1199 (2007). [DOI] [PubMed] [Google Scholar]
- 3.Uda M et al. Genome-wide association study shows BCL11A associated with persistent fetal hemoglobin and amelioration of the phenotype of β-thalassemia. Proc. Natl. Acad. Sci. U. S. A 105, 1620–1625 (2008). [DOI] [PMC free article] [PubMed] [Google Scholar]
- 4.Sankaran VG et al. Human fetal hemoglobin expression is regulated by the developmental stage-specific repressor BCL11A. Science 322, 1839–1842 (2008). [DOI] [PubMed] [Google Scholar]
- 5.Masuda T et al. Gene regulation: Transcription factors LRF and BCL11A independently repress expression of fetal hemoglobin. Science 351, 285–289 (2016). [DOI] [PMC free article] [PubMed] [Google Scholar]
- 6.Liu N et al. Direct Promoter Repression by BCL11A Controls the Fetal to Adult Hemoglobin Switch. Cell (2018) doi: 10.1016/j.cell.2018.03.016. [DOI] [PMC free article] [PubMed] [Google Scholar]
- 7.Martyn GE et al. Natural regulatory mutations elevate the fetal globin gene via disruption of BCL11A or ZBTB7A binding. Nat. Genet 50, 498–503 (2018). [DOI] [PubMed] [Google Scholar]
- 8.Xu J et al. Corepressor-dependent silencing of fetal hemoglobin expression by BCL11A. Proc. Natl. Acad. Sci. U. S. A 110, 6518–6523 (2013). [DOI] [PMC free article] [PubMed] [Google Scholar]
- 9.Huang P et al. The HRI-regulated transcription factor ATF4 activates BCL11A transcription to silence fetal hemoglobin expression. Blood 135, 2121–2132 (2020). [DOI] [PMC free article] [PubMed] [Google Scholar]
- 10.Lan X et al. ZNF410 Uniquely Activates the NuRD Component CHD4 to Silence Fetal Hemoglobin Expression. Mol. Cell 81, 239–254.e8 (2021). [DOI] [PMC free article] [PubMed] [Google Scholar]
- 11.Vinjamur DS et al. ZNF410 represses fetal globin by singular control of CHD4. Nat. Genet 53, 719–728 (2021). [DOI] [PMC free article] [PubMed] [Google Scholar]
- 12.Liu N et al. Transcription factor competition at the γ-globin promoters controls hemoglobin switching. Nat. Genet 53, 511–520 (2021). [DOI] [PMC free article] [PubMed] [Google Scholar]
- 13.Sher F et al. Rational targeting of a NuRD subcomplex guided by comprehensive in situ mutagenesis. Nat. Genet 51, (2019). [DOI] [PMC free article] [PubMed] [Google Scholar]
- 14.Zhou D, Liu K, Sun CW, Pawlik KM & Townes TM KLF1 regulates BCL11A expression and γ- to β-globin gene switching. Nat. Genet 42, 742–744 (2010). [DOI] [PubMed] [Google Scholar]
- 15.Tanabe O et al. An embryonic/fetal β-type globin gene repressor contains a nuclear receptor TR2/TR4 heterodimer. EMBO J. 21, 3434–3442 (2002). [DOI] [PMC free article] [PubMed] [Google Scholar]
- 16.Rupon JW, Wang SZ, Gaensler K, Lloyd J & Ginder GD Methyl binding domain protein 2 mediates γ-globin gene silencing in adult human βYAC transgenic mice. Proc. Natl. Acad. Sci. U. S. A 103, 6617–6622 (2006). [DOI] [PMC free article] [PubMed] [Google Scholar]
- 17.Krivega I & Dean A Chromatin looping as a target for altering erythroid gene expression. Ann. N. Y. Acad. Sci 1368, 31–39 (2016). [DOI] [PMC free article] [PubMed] [Google Scholar]
- 18.Renneville A et al. EHMT1 and EHMT2 inhibition induces fetal hemoglobin expression. Blood 126, 1930–1939 (2015). [DOI] [PMC free article] [PubMed] [Google Scholar]
- 19.Macari ER & Lowrey CH Induction of human fetal hemoglobin via the NRF2 antioxidant response signaling pathway. Blood 117, 5987–5997 (2011). [DOI] [PMC free article] [PubMed] [Google Scholar]
- 20.Doerfler PA et al. Activation of γ-globin gene expression by GATA1 and NF-Y in hereditary persistence of fetal hemoglobin. Nat. Genet 53, (2021). [DOI] [PMC free article] [PubMed] [Google Scholar]
- 21.Kurita R, Suda N, Sudo K, Miharada K & Hiroyama T Establishment of Immortalized Human Erythroid Progenitor Cell Lines Able to Produce Enucleated Red Blood Cells) Establishment of Immortalized Human Erythroid Progenitor Cell Lines Able to Produce Enucleated Red Blood Cells. PLoS One 8, 59890 (2013). [DOI] [PMC free article] [PubMed] [Google Scholar]
- 22.Gronostajski RM Roles of the NFI/CTF gene family in transcription and development. Gene 249, 31–45 (2000). [DOI] [PubMed] [Google Scholar]
- 23.Danjou F et al. Genome-wide association analyses based on whole-genome sequencing in Sardinia provide insights into regulation of hemoglobin levels. Nat. Genet 47, 1264–1271 (2015). [DOI] [PMC free article] [PubMed] [Google Scholar]
- 24.Lessard S, Beaudoin M, Orkin SH, Bauer DE & Lettre G 14q32 and let-7 microRNAs regulate transcriptional networks in fetal and adult human erythroblasts. Hum. Mol. Genet 27, 1411–1420 (2018). [DOI] [PMC free article] [PubMed] [Google Scholar]
- 25.Huang P et al. Comparative analysis of three-dimensional chromosomal architecture identifies a novel fetal hemoglobin regulatory element. Genes Dev. 31, 1704–1713 (2017). [DOI] [PMC free article] [PubMed] [Google Scholar]
- 26.Gier RA et al. High-performance CRISPR-Cas12a genome editing for combinatorial genetic screening. Nat. Commun 11, 1–9 (2020). [DOI] [PMC free article] [PubMed] [Google Scholar]
- 27.Bauer DE et al. A erythroid enhancer of BCL11A subject to genetic variation. 342, 253–257 (2014). [DOI] [PMC free article] [PubMed] [Google Scholar]
- 28.Grevet JD et al. Domain-focused CRISPR screen identifies HRI as a fetal hemoglobin regulator in human erythroid cells. Science 361, 285–290 (2018). [DOI] [PMC free article] [PubMed] [Google Scholar]
- 29.Starnes LM et al. NFI-A directs the fate of hematopoietic progenitors to the erythroid or granulocytic lineage and controls β-globin and G-CSF receptor expression. Blood 114, 1753–1763 (2009). [DOI] [PubMed] [Google Scholar]
- 30.McIntosh BE et al. Nonirradiated NOD,B6.SCID Il2rγ−/− kitW41/W41 (NBSGW) mice support multilineage engraftment of human hematopoietic cells. Stem Cell Reports 4, 171–180 (2015). [DOI] [PMC free article] [PubMed] [Google Scholar]
- 31.Métais JY et al. Genome editing of HBG1 and HBG2 to induce fetal hemoglobin. Blood Adv. 3, 3379–3392 (2019). [DOI] [PMC free article] [PubMed] [Google Scholar]
- 32.Holmfeldt P et al. Nfix is a novel regulator of murine hematopoietic stem and progenitor cell survival. Blood 122, 2987–2996 (2013). [DOI] [PMC free article] [PubMed] [Google Scholar]
- 33.Hall T et al. Nfix Promotes Survival of Immature Hematopoietic Cells via Regulation of c-Mpl. Stem Cells 36, 943–950 (2018). [DOI] [PMC free article] [PubMed] [Google Scholar]
- 34.Tangprasittipap A et al. Comparison of gene expression profiles between human erythroid cells derived from fetal liver and adult peripheral blood. PeerJ 2018, 1–28 (2018). [DOI] [PMC free article] [PubMed] [Google Scholar]
- 35.Skene PJ & Henikoff S An efficient targeted nuclease strategy for high-resolution mapping of DNA binding sites. Elife 6, 1–35 (2017). [DOI] [PMC free article] [PubMed] [Google Scholar]
- 36.Zhu Q, Liu N, Orkin S & Yuan G-C CUT&RUNTools: a flexible pipeline for CUT&RUN processing and footprint analysis. Genome Biol. 20, 192 (2019). [DOI] [PMC free article] [PubMed] [Google Scholar]
- 37.Piper M, Gronostajski R & Messina G Nuclear Factor One X in Development and Disease. Trends Cell Biol. 29, 20–30 (2019). [DOI] [PubMed] [Google Scholar]
- 38.Klemm SL, Shipony Z & Greenleaf WJ Chromatin accessibility and the regulatory epigenome. Nat. Rev. Genet 20, 207–220 (2019). [DOI] [PubMed] [Google Scholar]
- 39.Buenrostro J, Wu B, Chang H & Greenleaf W ATAC-seq method. Curr. Protoc. Mol. Biol 2015, 1–10 (2016). [DOI] [PMC free article] [PubMed] [Google Scholar]
- 40.Davis CA et al. The Encyclopedia of DNA elements (ENCODE): Data portal update. Nucleic Acids Res. 46, D794–D801 (2018). [DOI] [PMC free article] [PubMed] [Google Scholar]
- 41.Venkataraman A et al. A toolbox of immunoprecipitation-grade monoclonal antibodies to human transcription factors. Nat. Methods 15, 330–338 (2018). [DOI] [PMC free article] [PubMed] [Google Scholar]
- 42.Shah M, Funnell APW, Quinlan KGR & Crossley M Hit and Run Transcriptional Repressors Are Difficult to Catch in the Act. BioEssays 41, 1–10 (2019). [DOI] [PubMed] [Google Scholar]
- 43.Xu J et al. Correction of sickle cell disease in adult mice by interference with fetal hemoglobin silencing. Science 334, 993–996 (2011). [DOI] [PMC free article] [PubMed] [Google Scholar]
- 44.Jawaid K, Wahlberg K, Thein SL & Best S Binding patterns of BCL11A in the globin and GATA1 loci and characterization of the BCL11A fetal hemoglobin locus. Blood Cells, Mol. Dis 45, 140–146 (2010). [DOI] [PubMed] [Google Scholar]
- 45.Xu J et al. Transcriptional silencing of γ-globin by BCL11A involves long-range interactions and cooperation with SOX6. Genes Dev. 24, 783–789 (2010). [DOI] [PMC free article] [PubMed] [Google Scholar]
- 46.Khandros E et al. Understanding heterogeneity of fetal hemoglobin induction through comparative analysis of F and A erythroblasts. Blood 135, 1957–1968 (2020). [DOI] [PMC free article] [PubMed] [Google Scholar]
- 47.Meers MP, Bryson TD, Henikoff JG & Henikoff S Improved CUT&RUN chromatin profiling tools. Elife 8, 1–16 (2019). [DOI] [PMC free article] [PubMed] [Google Scholar]
- 48.Huang J et al. Dynamic Control of Enhancer Repertoires Drives Lineage and Stage-Specific Transcription during Hematopoiesis. Dev. Cell 36, 9–23 (2016). [DOI] [PMC free article] [PubMed] [Google Scholar]
- 49.Hiraike Y et al. NFIA differentially controls adipogenic and myogenic gene program through distinct pathways to ensure brown and beige adipocyte differentiation. PLoS Genet. 16, e1009044 (2020). [DOI] [PMC free article] [PubMed] [Google Scholar]
- 50.Messina G et al. Nfix Regulates Fetal-Specific Transcription in Developing Skeletal Muscle. Cell 140, 554–566 (2010). [DOI] [PubMed] [Google Scholar]
- 51.Taglietti V et al. Nfix Induces a Switch in Sox6 Transcriptional Activity to Regulate MyHC-I Expression in Fetal Muscle. Cell Rep. 17, 2354–2366 (2016). [DOI] [PMC free article] [PubMed] [Google Scholar]
- 52.Yi Z et al. Sox6 directly silences epsilon globin expression in definitive erythropoiesis. PLoS Genet. 2, 129–139 (2006). [DOI] [PMC free article] [PubMed] [Google Scholar]
- 53.Quevedo M et al. Mediator complex interaction partners organize the transcriptional network that defines neural stem cells. Nat. Commun 10, (2019). [DOI] [PMC free article] [PubMed] [Google Scholar]
- 54.Lan X et al. The E3 ligase adaptor molecule SPOP regulates fetal hemoglobin levels in adult erythroid cells. Blood Adv. 3, 1586–1597 (2019). [DOI] [PMC free article] [PubMed] [Google Scholar]
- 55.Peslak SA et al. HRI depletion cooperates with pharmacologic inducers to elevate fetal hemoglobin and reduce sickle cell formation. Blood Adv. 4, 4560–4572 (2020). [DOI] [PMC free article] [PubMed] [Google Scholar]
- 56.Bloh K et al. Deconvolution of Complex DNA Repair (DECODR): Establishing a Novel Deconvolution Algorithm for Comprehensive Analysis of CRISPR-Edited Sanger Sequencing Data. Cris. J 4, 120–131 (2021). [DOI] [PMC free article] [PubMed] [Google Scholar]
- 57.Pinello L et al. Analyzing CRISPR genome-editing experiments with CRISPResso. Nat. Biotechnol 34, 695–697 (2016). [DOI] [PMC free article] [PubMed] [Google Scholar]
- 58.Qin K et al. SIRT6-mediated transcriptional suppression of Txnip is critical for pancreatic beta cell function and survival in mice. Diabetologia 61, 906–918 (2018). [DOI] [PMC free article] [PubMed] [Google Scholar]
- 59.Slomiany BA, Kelly MM & Kurtz DT Extraction of nuclear proteins with increased DNA binding activity. Biotechniques 28, 938–942 (2000). [DOI] [PubMed] [Google Scholar]
- 60.Dobin A et al. STAR: Ultrafast universal RNA-seq aligner. Bioinformatics 29, 15–21 (2013). [DOI] [PMC free article] [PubMed] [Google Scholar]
- 61.Li B & Dewey CN RSEM: accurate transcript quantification from RNA-Seq data with or without a reference genome. BMC Bioinformatics 12:323 (2011) doi: 10.1201/b16589. [DOI] [PMC free article] [PubMed] [Google Scholar]
- 62.Love MI, Huber W & Anders S Moderated estimation of fold change and dispersion for RNA-seq data with DESeq2. Genome Biol. 15, 1–21 (2014). [DOI] [PMC free article] [PubMed] [Google Scholar]
- 63.Wu T et al. clusterProfiler 4.0: A universal enrichment tool for interpreting omics data. Innovation(China) 2, 100141 (2021). [DOI] [PMC free article] [PubMed] [Google Scholar]
- 64.Yu F, Sankaran VG & Yuan G-C CUT&RUNTools 2.0: a pipeline for single-cell and bulk-level CUT&RUN and CUT&Tag data analysis. Bioinformatics 1–3 (2021) doi: 10.1093/bioinformatics/btab507. [DOI] [PMC free article] [PubMed] [Google Scholar]
- 65.Langmead B & Salzberg SL Fast gapped-read alignment with Bowtie 2. Nat. Methods 9, 357–359 (2012). [DOI] [PMC free article] [PubMed] [Google Scholar]
- 66.Danecek P et al. Twelve years of SAMtools and BCFtools. Gigascience 10, 1–4 (2021). [DOI] [PMC free article] [PubMed] [Google Scholar]
- 67.Ramírez F et al. deepTools2: a next generation web server for deep-sequencing data analysis. Nucleic Acids Res. 44, W160–W165 (2016). [DOI] [PMC free article] [PubMed] [Google Scholar]
- 68.Zhang Y et al. Model-based analysis of ChIP-Seq (MACS). Genome Biol. 9, (2008). [DOI] [PMC free article] [PubMed] [Google Scholar]
- 69.Robinson MD, McCarthy DJ & Smyth GK edgeR: A Bioconductor package for differential expression analysis of digital gene expression data. Bioinformatics 26, 139–140 (2009). [DOI] [PMC free article] [PubMed] [Google Scholar]
Associated Data
This section collects any data citations, data availability statements, or supplementary materials included in this article.
Supplementary Materials
Supplementary Tables 1-5
Supplementary Tables 6-11
Unprocessed Western Blots
Unprocessed Western Blots
Unprocessed Western Blots
Unprocessed EMSA gels
Unprocessed Western Blots
Unprocessed Western Blots
Unprocessed Western Blots
Unprocessed EMSA gels
Data Availability Statement
All RNA-seq, CUT&RUN and ATAC-seq data generated in this study have been deposited in the NIH Gene Expression Omnibus (GEO) with the accession code GSE180871. Gene abundance in fetal and adult erythroid cells were obtained from GSE9087824. Gene sets used for GSEA analysis were provided in this article. HUDEP2 CRISPR screen results were obtained from Table S1 of a published study9. All unprocessed immunoblot scanned images and uncropped gel images are included in the source data.


