Abstract
Here we describe an alternative approach to currently used cytotoxicity analyses through applying eukaryotic microbial biosensors. The yeast Saccharomyces cerevisiae was genetically modified to express firefly luciferase, generating a bioluminescent yeast strain. The presence of any toxic chemical that interfered with the cells' metabolism resulted in a quantitative decrease in bioluminescence. In this study, it was demonstrated that the luminescent yeast strain senses chemicals known to be toxic to eukaryotes in samples assessed as nontoxic by prokaryotic biosensors. As the cell wall and adaptive mechanisms of S. cerevisiae cells enhance stability and protect from extremes of pH, solvent exposure, and osmotic shock, these inherent properties were exploited to generate a biosensor that should detect a wide range of both organic and inorganic toxins under extreme conditions.
Many luminescent bacterial biosensors have been produced which detect a wide range of pollutants while simultaneously assessing bioavailability in environmental samples. Saccharomyces cerevisiae has been used previously to assess toxicity through the use of an amperometric gas diffusion (oxygen) electrode, which quantifies changes in culture respiration (1, 7, 8, 9, 17). Alternatively, the effect of a compound on S. cerevisiae cultures was measured directly through inhibition of maximum growth rates (2, 10). However, such toxicity assays are time-consuming and expensive in comparison to luminometry analysis. Walmsley et al. (18) created an S. cerevisiae biosensor that induces green fluorescent protein expression on exposure to genotoxic agents. The luminescent biosensor designed in the present study works on a different principal (reduction in reporter gene product activity) and complements the biosensor designed by Walmsley et al. (18) by detecting a wide range of toxins, not just genotoxic agents.
For the novel S. cerevisiae biosensor described here, a luminescence detection system was constructed using firefly luciferase (luc) from Photinus pyralis. The firefly luciferase light reaction relies on ATP being supplied by actively metabolizing cells. This dependence on endogenous energy supplies enables a luciferase assay system to report directly on cell health upon exposure to toxins. The luciferin substrate for P. pyralis luciferase is an amphipathic molecule with a charged carboxyl group at physiological pH. This prevents easy passage of luciferin across cell membranes, leading to problems during the exogenous addition for in vivo assays. This was overcome through the development of a novel assay system where the biosensor preparation was acidified after exposure to the toxicant and before luminescence quantification.
MATERIALS AND METHODS
Strains, media, and chemicals.
S. cerevisiae strain W303-1B (MATα leu2-3,112 his3-11,15 trp1-1 can1-100 ade2-1 ura3-1) (16) was the host for the chromosomal luciferase-expressing construct. Chromosomal insertion was carried out using a published method (5). S. cerevisiae was grown in synthetic complete medium (15) in a shaking incubator at 200 rpm and 30°C. Diuron [3-(3,4-dichlorophenyl)-1,1-dimethylurea] and mecoprop [(+/−)-2-(4-chloro-o-tolyloxy)propionic acid] were obtained from Greyhound Chemicals. d-Luciferin (potassium salt) was obtained from Molecular Probes.
Construction of the chromosomal luciferase expression system.
The pBluescript-based yeast centromeric plasmid pRS316 (14), was modified to create pPLUCΔP. A PGK terminator was amplified by PCR from YCpPLP (4). Primer S5R (5′-GTGTTGCTTTCTTATCCGCGGAGAAATAAATTGAAT-3′) introduced a SacII site at the 5′ end of the terminator region, and a SacI site was inserted by the S3R (5′-TTTTTCGAAACGCAGAGCTCTCGAGTTATTAAACTT-3′) oligonucleotide at the 3′ end. The PCR to amplify luc used the forward primer 5LEADL (5′-ACAGATCACCGGATCCATCAAGACACCAATCAAA ACAAATAAAACATCATCACAATGGAAGACGCCAAAAACATAAAGA AAGGCCCG-3′) and reverse primer N3RΔ (5′-TCTAGAGCGGCCGCTGAATACAGTTACATTTTACTTTCCGCCCTTCTTGGCCTTT-3′) for the inclusion of a NotI site 3′ to the luciferase gene. The template for this PCR was the pGL2 vector from Promega. The lucΔ and URA3 genes from the pPLUCΔP plasmid vector were amplified separately using PCR. Primers rLUC (5′-AGCC TCATAAATAAAGGTAGATAGTAAAGTATACAAGAGAAGAATCCCA AGATGGAAGACGCCAAAAACATAAAGAAAGGCCCG-3′) and S3R amplify a promoterless version of the lucΔ gene (includes the PGK terminator). Primers rURA (5′-ATCAAACATCATTCTGCAGAACTGAAAACATACTT GAACACTTGGGACAGCTGACCTGATGCGGTATTTTCTCCTTACGCA TCT-3′) and ST1K1 (5′-GAGCTCTGCGTTTCGAAAAACCGGAGACGGTCACAGCTT-3′) amplify the URA3 gene, including control regions. Homologous sequence for directing genomic integration at rps16a were included in the rLUC and rURA primers. Homology to the luciferase amplification product (present in ST1K1) allowed the luciferase and URA3 genes to fuse and amplify though this homologous region, resulting in a 3.5-kb product.
Bioassay procedure.
Stock concentrations of toxicants were prepared in deionized water, and the pH was adjusted to 5.5 using HCl or NaOH. S. cerevisiae biosensor cells were harvested at peak luminescence (optical density at 600 nm of around 3.7), centrifuged at 700 × g, and washed twice in 0.1 M KCl (twice the original volume). A potential toxicant (450 μl) was added to each 1-ml cuvette (Clinicon, catalog no. 2174 701), and the final volume was made up to 500 μl by adding 50 μl of diluted S. cerevisiae cells (approximately 2 × 10⁷ cells per assay). Following a 10-min exposure to the sample, 500 μl of pH 2.5 citrate phosphate buffer (containing luciferin to make the final concentration 0.1 mM per cuvette) was added. Bioluminescence was then monitored in a BioOrbit 1251 luminometer using a Multiuse software package (version 1.01, April 1991, JN). The units of luminescence were expressed as relative light units, which equated to 10 mV s−1 ml−1. For comparative bacterial assays, lyophilized Escherichia coli HB101 cultures containing the plasmid pUCD607 were prepared as described by Weitz (19). These lyophilized cells were resuscitated for 1 h in 10 ml of 0.1 M KCl at 25°C and 200 rpm. For the assay, 100 μl of resuscitated cells was added to 900 μl of toxicant standard in each cuvette. In order to interpret the bioassay data, the relative light units were translated into a percentage of maximum luminescence (the 100% value was determined by the blank cuvette). For toxicity detection in solvents, the standards were prepared using 10% solvent as a diluent. The maximum luminescence for these assays was determined using the relevant solvent diluent. Samples were run alongside standards prepared in H2O for comparative analysis. To determine the effects of external pH on light output, a pH range of 1 to 12 was prepared using HCl and NaOH to adjust the pH of H2O. To assay toxicity at pH extremes, the standards were prepared in the normal fashion except that the H2O for dilution had its pH adjusted accordingly.
RESULTS
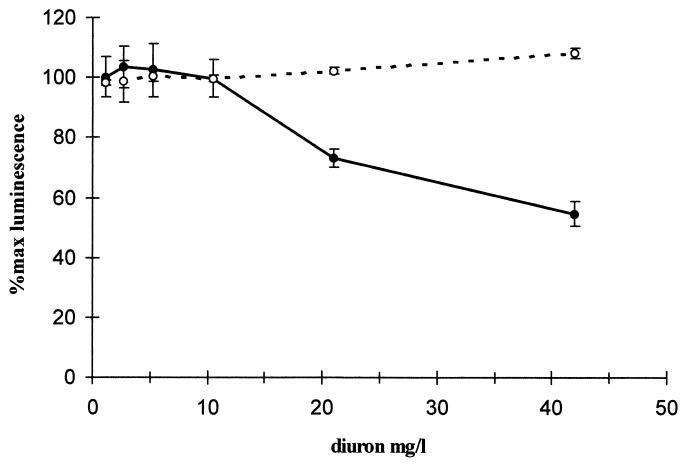
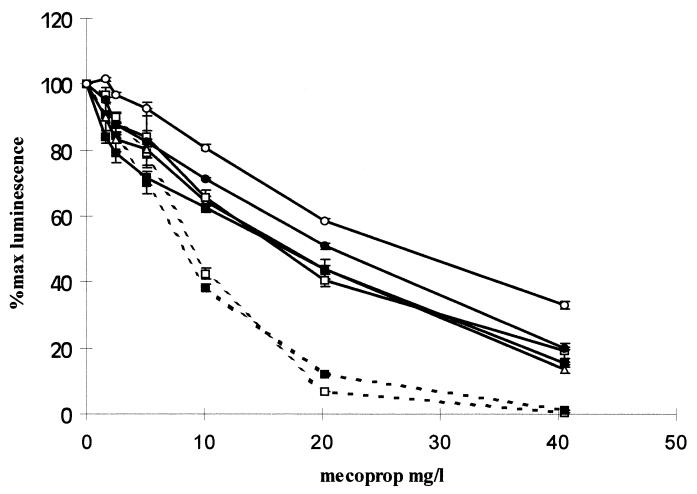
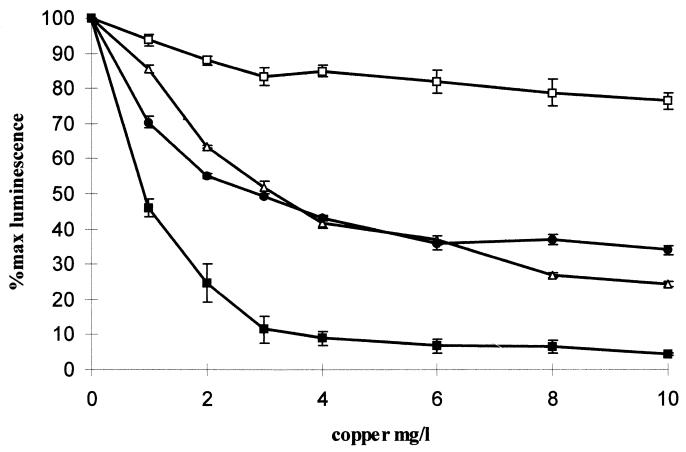
The herbicide diuron, a known eukaryotic toxin, was toxic to S. cerevisiae but not to a lux-marked luminescent bacterial strain (Fig. 1). Investigations performed to examine the effects of external pH on S. cerevisiae demonstrated that external pH had minimal effects on the metabolism of the cells if the cells were acidified prior to luminescence quantification (data not shown). To discover if altering the pH affected toxicity detection, two test compound solutions (copper and the organic toxin mecoprop) were pH adjusted. Copper was no longer found to be bioavailable at extremes of pH, presumably due to speciation effects (data not shown). However, the sensitivity of the S. cerevisiae biosensor to mecoprop was greatest at pH 1 and was reduced at pH 12 (Fig. 2), with a similar dose response over a pH range of pH 3 to 10. S. cerevisiae was found, in acute exposure, to be relatively tolerant to fairly high concentrations of solvents, with a reduction in light output of between 10 to 40% in the presence of 9% solvent. Two compounds were assayed to determine how the presence of solvent affected toxicity, and results were obtained for the heavy metal copper and the organic toxin diuron (data for copper are shown in Fig. 3). The presence of methanol severely reduced the biosensor response to both organic and inorganic toxins. Conversely, the presence of ethanol considerably enhanced the biosensor sensitivity to both toxins.
FIG. 1.
Differential response of E. coli HB101(pUCD607) and S. cerevisiae LucΔ to diuron. S. cerevisiae and E. coli cells were exposed to identical concentrations of diuron. S. cerevisiae (●) exhibits a toxic response at levels of toxin where the E. coli (○) cells do not sense any toxicity. The experiment was carried out in triplicate at 25°C, and the error bars represent standard errors of the mean triplicate values. For comparative assays the same biosensor sample was used; however, for the assays presented here, they were repeated on at least three occasions and the trends were found to be identical.
FIG. 2.
Effects of pH on mecoprop toxicity in S. cerevisiae LucΔ. The external pH was found to have minimal effects on dose-response curves for pH 3 (▵), pH 5.5 (□, solid lines), and pH 10 (■, solid lines). External pHs of 11 (●) and pH 12 (○) resulted in a loss of toxin sensitivity. When the external pH was lowered (dashed lines) to pH 1 (□) and pH 2 (■), there were dramatic increases in sensitivity to the toxin. The experiment was carried out in triplicate at 25°C, and the error bars represent standard errors of the mean triplicate values. For comparative assays the same biosensor sample was used; however, the assays were repeated on at least three separate occasions and the trends were found to be identical.
FIG. 3.
Effects of solvents on copper toxicity sensing in S. cerevisiae LucΔ. The presence of 9% ethanol (■) resulted in an increase in the toxic response, and a loss in sensitivity was observed for 9% methanol (□), compared to the dose-response curve for double-distilled H2O (▵). The presence of 9% acetone (●) resulted in a dose-response curve similar to that for double-distilled H2O. These experiments were carried out in triplicate at 25°C, and the error bars represent standard errors of the mean triplicate value. For comparative assays the same biosensor sample was used; however, the assays were repeated on at least three separate occasions and the trends were found to be identical.
DISCUSSION
During screening of known toxic herbicides, the S. cerevisiae biosensor sensed toxicity in samples that were not toxic to existing lux-based bacterial biosensors (Fig. 1). However, the bacterial biosensors did not utilize a luc-based luminescence system; therefore, the results demonstrated in Fig. 1 are not directly comparable. The effects of external pH on mecoprop toxicity, as detected by the luminescent S. cerevisiae biosensor, are shown in Fig. 2. The most dramatic increases in toxicity sensing were seen in toxic responses at pH 1 and 2. A possible explanation for this is that weak acids have been demonstrated to dissipate the proton motive force across plasma membranes in S. cerevisiae (6). To counteract this effect, the plasma membrane pumps out protons using the membrane ATPase at the expense of ATP production (12). Many organic toxins disrupt cell plasma membranes (13) which are required for defense against extreme pH, and therefore, the increase in toxicity at low pH may be caused by mecoprop disrupting the cell membrane, which in turn disrupts S. cerevisiae pH defense mechanisms, resulting in an amplified toxic effect.
S. cerevisiae has been applied in xenobiotic testing in other studies where its solvent tolerance was advantageous (2). However, possible synergistic effects of these solvents and xenobiotics were never discussed. The differences in toxicity detection in ethanol and methanol are quite distinct. Methanol did not act synergistically with either the organic or inorganic toxins (results for copper are shown in Fig. 3). This is unlikely to be explained by slightly reduced membrane disruption, as S. cerevisiae has many mechanisms that will readily import ethanol into the cell (3). Therefore, during ethanol transport into cells, it is possible that toxins simultaneously enter through similar uptake mechanisms. Comparable findings have been observed for higher eukaryotes; for example, the presence of ethanol increases the toxicity of paraquat in rabbits (11).
Toxic responses from these cytotoxicity analyses are indicative rather than definitive. This is because S. cerevisiae responds to some toxic compounds which are not deleterious to higher eukaryotes, for example, cyclohexane (17) and antifungal agents. However, luc-marked S. cerevisiae may be a very useful reporter of toxicity to other fungi, such as mycorrhizal fungi, which have major ecological importance.
ACKNOWLEDGMENTS
We acknowledge the support of the Natural Environment Research Council (NERC) and Yorkshire Water Services Ltd. for funding a studentship for R. P. Hollis.
REFERENCES
- 1.Campanella L, Faverso G, Mastrofini D, Tomassetti M. Toxicity order of cholanic acids using an immobilised cell biosensor. J Pharm Biomed Anal. 1996;14:1007–1013. doi: 10.1016/0731-7085(95)01709-7. [DOI] [PubMed] [Google Scholar]
- 2.Cascorbi I, Bittrich H, Ricklinkat J, Voss W, Seyfarth A, Forêt M. Effects of a heterogeneous set of xenobiotics on growth and plasma membranes of mammalian and fungal cell cultures. Ecotoxicol Environ Saf. 1993;26:113–126. doi: 10.1006/eesa.1993.1043. [DOI] [PubMed] [Google Scholar]
- 3.D'Amore T, Panchal C J, Russell I, Stewart G G. A study of ethanol tolerance in yeast. Crit Rev Biotechnol. 1990;9:287–304. doi: 10.3109/07388558909036740. [DOI] [PubMed] [Google Scholar]
- 4.Dickson L M, Brown A J P. mRNA translation in yeast during entry into stationary phase. Mol Gen Genet. 1998;259:282–293. doi: 10.1007/s004380050814. [DOI] [PubMed] [Google Scholar]
- 5.Gietz D, St. Jean A, Woods R A, Schiestl R H. Improved method for high efficiency transformation of intact yeast cells. Nucleic Acids Res. 1992;20:1425. doi: 10.1093/nar/20.6.1425. [DOI] [PMC free article] [PubMed] [Google Scholar]
- 6.Guldfeldt L U, Arneborg N. Measurement of the effects of acetic acid and extracellular pH on intracellular pH of nonfermenting, individual Saccharomyces cerevisiae cells by fluorescence microscopy. Appl Environ Microbiol. 1998;64:530–534. doi: 10.1128/aem.64.2.530-534.1998. [DOI] [PMC free article] [PubMed] [Google Scholar]
- 7.Haubenstricker M E, Meier P G, Mancy K H, Brabec M J. Rapid toxicity testing based on yeast respiratory activity. Bull Environ Contam Toxicol. 1990;44:669–674. doi: 10.1007/BF01701786. [DOI] [PubMed] [Google Scholar]
- 8.Henderson G. A comparison of effects of chromate, molybdate and cadmium oxide on respiration in the yeast Saccharomyces cerevisiae. Biol Metals. 1989;2:83–88. doi: 10.1007/BF01129205. [DOI] [PubMed] [Google Scholar]
- 9.Ikebukuro K, Miyata A, Cho S J, Nomura Y, Chang S M, Yamauchi Y, Hasebe Y, Uchiyama S, Karube I. Microbial cyanide sensor for monitoring river water. J Biotechnol. 1996;48:73–80. doi: 10.1016/0168-1656(96)01399-5. [DOI] [PubMed] [Google Scholar]
- 10.Koch H P. The yeast test: an alternative method for the testing of acute toxicity of drug substances and environmental chemicals. Methods Find Exp Clin Pharmacol. 1993;15:141–152. [PubMed] [Google Scholar]
- 11.Kuo T L, Nanikawa R. Effect of ethanol on acute paraquat toxicity in rabbits. Nippon Hoigaku Zasshi. 1990;44:12–17. [PubMed] [Google Scholar]
- 12.Pampulha M E, Loureiro-Dias M C. Combined effect of acetic acid, pH and ethanol on intracellular pH of fermenting yeast. Appl Microbiol Biotechnol. 1989;31:547–550. [Google Scholar]
- 13.Sikkema J, de Bont J A M, Poolman B. Mechanisms of membrane toxicity of hydrocarbons. Microbiol Rev. 1995;59:201–222. doi: 10.1128/mr.59.2.201-222.1995. [DOI] [PMC free article] [PubMed] [Google Scholar]
- 14.Sikorski R S, Hieter P. A system of shuttle vectors and yeast host strains designed for efficient manipulation of DNA in Saccharomyces cerevisiae. Genetics. 1989;122:19–27. doi: 10.1093/genetics/122.1.19. [DOI] [PMC free article] [PubMed] [Google Scholar]
- 15.Strathern J N. Ty Insertional mutagenesis. In: Johnston J R, editor. Molecular genetics of yeast: a practical approach. Oxford, United Kingdom: Oxford University Press; 1994. p. 118. [Google Scholar]
- 16.Thomas B J, Rothstein R. Elevated recombination rates in transcriptionally active DNA. Cell. 1989;56:619–630. doi: 10.1016/0092-8674(89)90584-9. [DOI] [PubMed] [Google Scholar]
- 17.Uribe S, Rangel P, Espínola G, Aguirre G. Effects of cyclohexane, an industrial solvent, on the yeast Saccharomyces cerevisiae and on isolated yeast mitochondria. Appl Environ Mirobiol. 1990;56:2114–2119. doi: 10.1128/aem.56.7.2114-2119.1990. [DOI] [PMC free article] [PubMed] [Google Scholar]
- 18.Walmsley R M, Billinton N, Heyer W-D. Green fluorescent protein as a reporter for the DNA damage-induced gene RAD54 in Saccharomyces cerevisiae. Yeast. 1997;13:535–545. doi: 10.1002/(SICI)1097-0061(199712)13:16<1535::AID-YEA221>3.0.CO;2-2. [DOI] [PubMed] [Google Scholar]
- 19.Weitz H J. Ph.D. thesis. Aberdeen, United Kingdom: University of Aberdeen; 1999. [Google Scholar]


