Abstract
U2AF1 mutations (U2AF1MT) occur commonly in myelodysplastic syndromes (MDS) without ring sideroblasts. The aim of this study was to investigate the clinical and biological implications of different U2AF1 mutation types in MDS. We performed targeted gene sequencing in a cohort of 511 MDS patients. Eighty-six patients (17%) were found to have U2AF1MT, which occurred more common in younger patients (P = .001) and represented ancestral lesions in a substantial proportion (71%) of cases. ASXL1MT and isolated +8 were significantly enriched in U2AF1MT-positive cases, whereas TP53MT, SF3B1MT, and complex karyotypes were inversely associated with U2AF1MT. U2AFS34 subjects were enriched for isolated +8 and were inversely associated with complex karyotypes. U2AF1MT was significantly associated with anemia, thrombocytopenia, and poor survival in both lower-risk and higher-risk MDS. U2AF1S34 subjects had more frequently platelet levels of <50 × 109/L (P = .043) and U2AF1Q157/U2AF1R156 subjects had more frequently hemoglobin concentrations at <80g/L (P = .008) and more often overt fibrosis (P = .049). In conclusion, our study indicates that U2AF1MT is one of the earliest genetic events in MDS patients and that different types of U2AF1MT have distinct clinical and biological characteristics.
1 ∣. INTRODUCTION
Myelodysplastic syndromes (MDS) comprise a heterogeneous group of clonal hematopoietic neoplasms characterized by ineffective and dysplastic hematopoiesis that presents clinically as peripheral blood cytopenias and by a variable propensity to progress to acute myeloid leukemia.1 Over the last 10 y, DNA sequencing has revolutionized our understanding of the pathogenesis of this disease, establishing that MDS arises through a sequential acquisition of somatic mutations in a set of recurrently involved genes.2-8 Since the initial discovery of spliceosome gene mutations in MDS,9,10 it is now known that spliceosome genes represent the most common targets of mutations in patients with MDS. Mutations in spliceosome genes, most commonly SF3B1, U2AF1, SRSF2, and ZRSR2, have been identified in approximately half of MDS patients.4-10 This suggests that SF3B1, SRSF2, and U2AF1 may be proto-oncogenes, as they are subject to highly specific missense mutations that are suggestive of gain- or alteration- of function.11-13 Thus, alterations in RNA splicing caused by spliceosome gene mutations add to the general transcriptional dysfunction that characterizes MDS and related myeloid malignancies. SF3B1 was the first spliceosome family member to be implicated, and is significantly associated with ringed sideroblasts.9,14,15 Besides SF3B1, U2AF1 is a common (~10%) mutated spliceosome gene in MDS.5,6,10,16-18 Understanding the clinical features and biological implications of U2AF1 mutation (U2AF1MT) in MDS is only just beginning to emerge.19-21
To investigate the clinical impact of U2AF1MT in MDS, we studied a cohort of 511 patients. We compared the mutational landscapes of U2AF1MT subjects, their clinical associations, survival, and clonal hierarchies. Our aims were to provide insights into the pathogenesis U2AF1MT-positive MDS, especially with respect to the clonal architecture and different mutation types of U2AF1MT, and to determine whether U2AF1MT should be grouped or considered separately, particularly with respect to the potential benefits of U2AF1MT inhibitors or pre-mRNA splicing modulators in a clinical context.
2 ∣. MATERIALS AND METHODS
2.1 ∣. Patients
A total of 511 MDS patients were investigated in this study. In the cohort, 308 (60%) were males and 203 (40%) females, with a median age of 52 y (range, 14–84 y). All subjects provided informed consent in compliance with the Declaration of Helsinki. According to the 2016 revised criteria of the World Health Organization (WHO),22 16 (3%) patients with MDS with single lineage dysplasia (MDS-SLD), 274 (54%) MDS with multilineage dysplasia (MDS-MLD), 14 (3%) MDS with ring sideroblasts (MDS-RS) with single lineage dysplasia (MDS-RS-SLD), 5 (1%) MDS-RS with multilineage (MDS-RS-MLD), 83 (16%) MDS with excess blasts-1 (MDS-EB-1), 104 (20%) MDS-EB-2, 6 (1%) MDS with isolated del(5q), and 9 (2%) MDS unclassifiable (MDS-U) were included in this cohort. Patient characteristics are detailed in the Supporting Information Table S1. Bone marrow samples were obtained from all patients at diagnosis. A total of 523 samples from 511 patients were subjected to targeted 112-gene sequencing (Supporting Information, Table S2). Serial samples of five patients were included in the analysis. A total of 457 (89%) patients had evaluable karyotypes. The prognostic impact was evaluated with the International Prognostic Scoring System (IPSS).23 According to the IPSS, patients were classified as lower-risk (Low and Intermediate-1 risk) and the higher-risk groups (Intermediate-2 and High risk). A total of 257 (50%) subjects received immune suppressive drugs including cyclosporine and thalidomide.24 Sixteen subjects (3%) received anti-cancer therapy(ies) including aclacinomycin or homoharringtonine combined with cytarabine and granulocyte-colony stimulating factor (G-CSF; termed CAG or HAG), idarubicin or daunorubicin combined with cytarabine (IA or DA) or melphalan.25 Eighty-two (16%) subjects received erythropoietin with or without G-CSF, red blood cell and/or platelet transfusions and/or iron chelation with desferrioxamine. Sixty-five (13%) subjects received decitabine, 39 (8%) an allotransplant, and 52 (10%) traditional Chinese medicines. Treatment response was assessed according to the criteria standardized by the MDS International Working Group.26 Follow-up data were available for 482 (94%) subjects. Median follow-up for survivors was 20 mo (range, 1–144).
2.2 ∣. Targeted gene sequencing
DNA was obtained from bone marrow and oral epithelial cells (germline control samples). Details about targeted gene sequencing and the copy number at the locus of each mutation analysis are described in the Supplementary Methods. We sequenced 112 genes across all patients upon diagnosis, resulting in 1067 high-confidence mutation (Supporting Information, Table S3). The average gene coverage was 98.1%. The average read depth was 718×. Also, >95% of targeted regions were covered with >20×.
2.3 ∣. Analysis of clonal architecture
Variant allele fractions (VAF) can be used to estimate the proportion of tumor cells carrying a given mutation and to identify ancestral clonal or subclonal events.27 VAFs were adjusted by using the copy number information at the locus of each mutation. Ancestral versus subclonal events were determined using a copy number-adjusted VAF difference between two events with a higher VAF indicating ancestral origin. We applied this approach in patients with two or more mutations to establish the clonal architecture. Given that there were two mutations in a patient, the mutation with significantly higher VAF was considered as ancestral and both mutations were considered as ancestral when there was no difference in VAFs.5,28
2.4 ∣. Statistical analyse
Correlations between sample groups and clinical and laboratory data were calculated with the χ2 test for qualitative variables with discrete categories and the Mann–Whitney U test or Kruskal–Wallis analysis of variance for continuous variables. Survival distributions were estimated by the Kaplan-Meier method. Two-tailed P values ≤.05 were considered significant.
3 ∣. RESULTS
3.1 ∣. Gene mutations in MDS
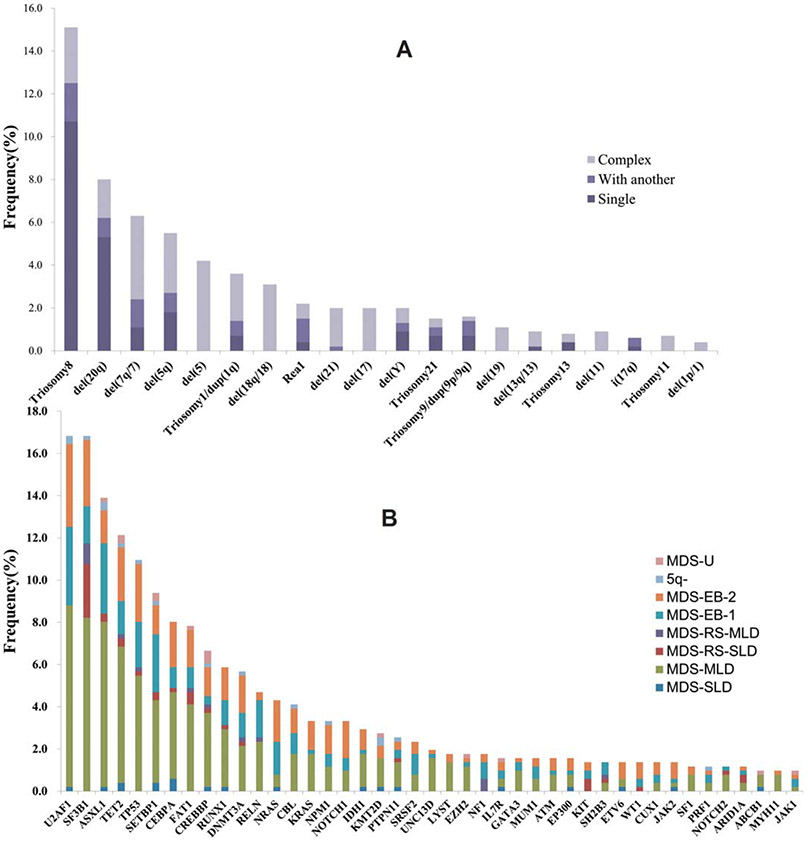
We found 1067 mutations in 83 distinct genes with mutation loads varying from 2% to 100%. Four hundred and forty (86%) patients had at least one gene mutation, including 149 (29%) subjects with one mutated gene, 138 (27%) with two mutated genes, 80 (16%) with three mutated genes, and 73 (14%) with more than three mutated genes. Eleven genes were mutated in more than 5% of patients, namely U2AF1 (17%), SF3B1 (17%), ASXL1 (14%), TET2 (12%), TP53 (11%), SETBP1 (9%), CEBPA (8%), FAT1 (8%), CREBBP (7%), RUNX1 (6%), and DNMT3A (6%). The overall distribution of abnormal karyotypes and gene mutations (>1%) are shown in Figure 1A,B. Considering gene mutations combined with cytogenetics, 467 (91%) subjects had recurrent genetic abnormalities. Mutated genes were grouped into several functional pathways. Among these, the most frequent targets were genes associated with spliceosome (37%), followed by signal transduction (34%), chromatin modification (28%), transcription factors (24%), DNA methylation (21%), cell cycle/apoptosis (17%), and DNA damage control (2%; Supporting Information, Figure S1A).
FIGURE 1.
Karyotypes and mutated genes in MDS. (A) Frequency of abnormal karyotypes in 511 cases. (B) Frequency of 43 significantly mutated genes (>1%) in 511 patients with different WHO subtypes, as indicated with different colors
3.2 ∣. Clinical characteristics associated with U2AF1 mutations
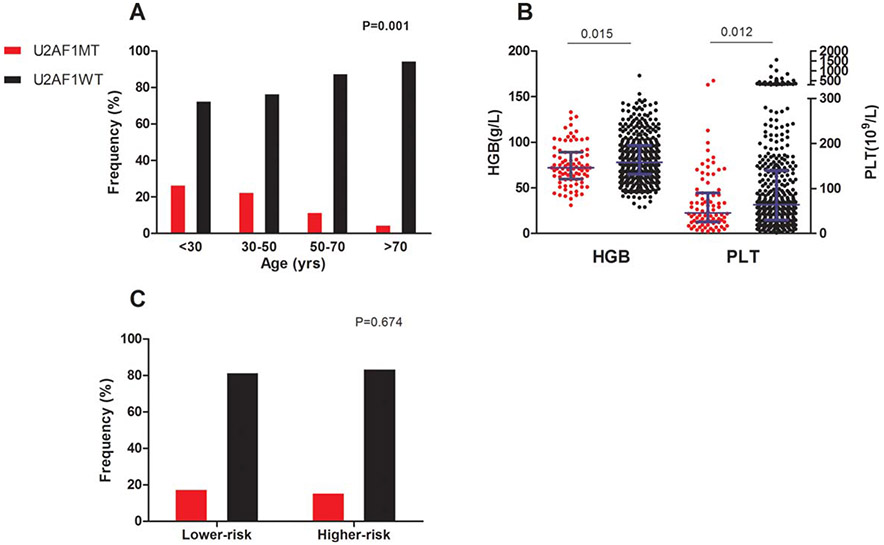
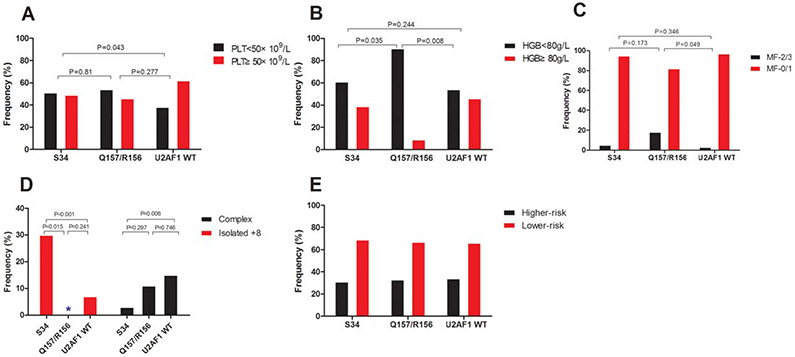
Among the 511 patient samples tested, we identified U2AF1MT in 86 (17%) subjects. Compared with many MDS-related gene mutation, such as SF3B1, ASXL1, TET2, and TP53, U2AF1MT more frequently occurred in younger patients (P = .001, Figure 2A and Supporting Information, Figure S1B). Compared with U2AF1 wildtype (U2AF1WT) subjects, U2AF1MT subjects more often had anemia (P = .015; Figure 2B) and thrombocytopenia (P = .012; Figure 2B). U2AF1MT subjects were more likely to have isolated +8 (P < .001; Figure 3A) and less likely to have complex karyotypes (P = .007; Figure 3A) compared with U2AF1WT subjects. U2AF1MT was not associated with a lower or higher IPSS risk group (Figure 2C). Of the U2AF1MT mutations, U2AF1S34F (64%, N = 55) was the most common, followed by U2AF1S34Y (23%, N = 20), U2AF1Q157R (6%, N = 5), U2AF1Q157P (5%, N = 4), and U2AF1R156H (2%, N = 2; Supporting Information, Figure S1C). One subject had both S34F and Q157R. Supporting Information, Figure S1D shows the distribution of the different types of U2AF1MT within the disease categories. Considering the different type of U2AF1 mutations, U2AF1S34 subjects had more frequent platelet levels of <50 × 109/L (Figure 4A) and U2AF1Q157/U2AF1R156 subjects had more frequent hemoglobin concentrations at <80 g/L (Figure 4B) and more frequent marrow fibrosis (MF)-2/3 (P = .002; Figure 4C). Moreover, U2AF1S34 was enriched for isolated +8 and was inversely associated with complex karyotypes (Figure 4D). However, there was no different distribution of the IPSS lower-risk and higher-risk group between subjects with different types of U2AF1MT (Figure 4E).
FIGURE 2.
Clinical characteristic of patients with U2AF1MT. (A) The percentage of U2AF1MT in different age group. (B) The hemoglobin and platelet level in the U2AF1MT and U2AF1WT groups. (C) The percentage of U2AF1MT in lower-risk and higher-risk groups. Longer blue lines in (B) indicate median and shorter blue lines indicate interquartile range
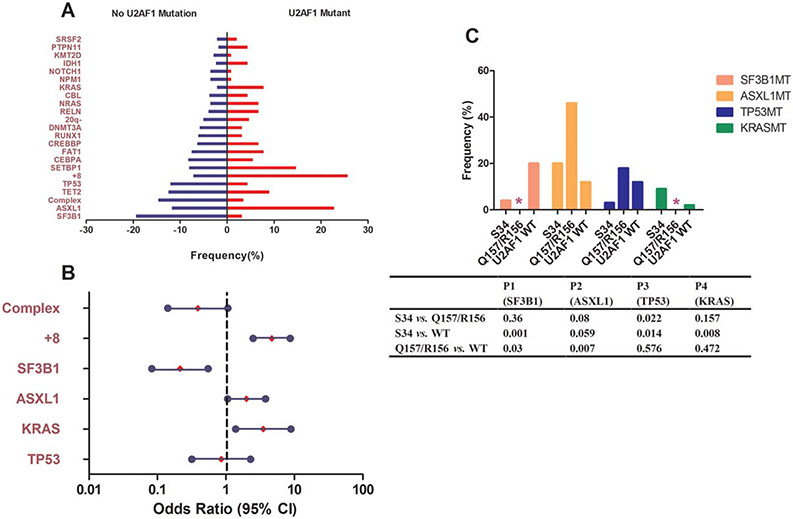
FIGURE 3.
Most and least frequently co-occurring gene mutations and abnormal karyotypes in U2AF1MT patients. (A) Prevalence of co-occurring gene mutations and abnormal karyotypes in U2AF1MT subjects compared with U2AF1WT subjects, using univariate analysis. (B) Odds ratios of significant co-occurring gene mutations and abnormal karyotypes in U2AF1MT subjects in multivariate analysis. (C) Prevalence of co-occurring gene mutations in subjects with different types of U2AF1MT. * indicates no sample; S34 indicates U2AF1S34; Q157/R156 indicates U2AF1Q157/U2AF1R156; and U2AF1WT indicates U2AF1 wild type
FIGURE 4.
Clinical characteristic of patients with different types of U2AF1MT. The association between U2AF1S34 or U2AF1Q157/U2AF1R156 and thrombocytopenia (A), anemia (B), myelofibrosis (C), isolated +8, and complex karyotype (D), and lower-and higher-risk groups (E). S34 indicates U2AF1S34; Q157/R156 indicates U2AF1Q157/U2AF1R156; and U2AF1WT indicates U2AF1 wild type
3.3 ∣. Biological characterization of U2AF1MT MDS
Overall, U2AF1MT patients were likely to have more mutations than U2AF1WT patients (P < .001, Supporting Information, Table S1). To characterize the molecular features of U2AF1MT patients with MDS, we analyzed associations between U2AF1MT and other common gene mutations and cytogenetic abnormalities. In univariate comparisons (Figure 3A), KRASMT (P = .006), ASXL1MT (P = .006), and isolated +8 (P < .001) were significantly enriched in U2AF1MT subjects, whereas TP53 MT (P = .04), SF3B1MT (P < .001), and complex karyotypes (P = .007) were inversely associated with U2AF1MT subjects. To exclude the effects of correlations between different mutations that might confound the results, we performed multivariate analysis. SF3B1MT (P = .001, OR = 0.214, 95% CI: 0.083-0.55) was inversely associated with U2AF1MT subjects, while isolated +8 (P < .001, OR = 4.671, 95% CI: 2.510-8.689), KRASMT (P = .008, OR = 3.521, 95% CI: 1.388-8.934), and ASXL1MT (P = .033, OR = 2.003, 95% CI: 1.059-3.786) were significantly enriched in U2AF1MT subjects (Figure 3B). More detailed association between different types of U2AF1MT and other gene mutations is shown in Figure 3C.
3.4 ∣. Clonal architecture of U2AF1MT patients
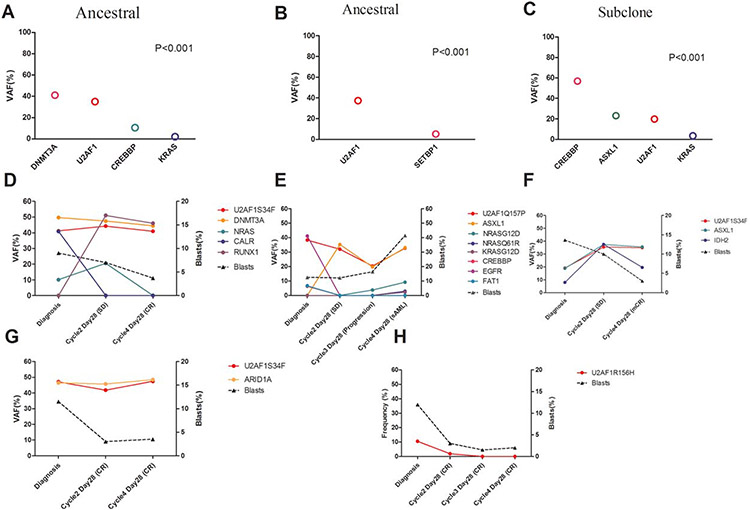
Using copy number-adjusted VAF, we reconstructed the clonal architecture of U2AF1MT patients to establish whether a U2AF1MT was an ancestral or subclonal mutation. Figure 5A-C show examples of clonal architecture of U2AF1MT. Sixty-five patients with one or more mutations, except for U2AF1MT, were analyzed. U2AF1MT was an ancestral mutation in 46 (71%) patients and was a subclonal mutation in 19 (29%) patients. With regard to different mutation types, 41 (75%) U2AF1MT were ancestral mutations in 55 patients with U2AF1S34 and 5 (50%) were ancestral mutations in 10 patients with U2AF1Q157/U2AF1R156. There was no significant association between ancestral or subclonal U2AF1MT and other gene mutations (Supporting Information, Figure S1E). Five U2AF1MT MDS-EB patients, who received at least four cycles of single-agent decitabine and from whom serial bone marrow samples were available, were enrolled to detect gene mutations during treatment. Among these five patients, four had at least one gene mutation except for U2AF1MT and one had only U2AF1MT at diagnosis. The clearance of U2AF1MT tended to have no correlation with clinical response, but the clearance of leukemia-specific mutations (eg, IDH2, NRAS, and KRAS) correlated closely with clinical response (Figure 5D-H). However, definitive conclusions from this subset analysis are hindered by the limited number of cases.
FIGURE 5.
Analysis of clonal architecture of U2AF1-mutated cases. Variant allele fractions (VAF) of gene mutations identified in three representative patients with U2AF1 mutations. According to the statistically significant differences in observed VAF among gene mutations, the U2AF1 mutation is classified as ancestral in (A) and (B) and as subclonal (C). Gene mutation clearance observed in five U2AF1MT patients who received single-agent decitabine treatment (D-H). The VAF (left y-axis) and percentage of BM blasts (right y-axis) are indicated across time points (x-axis)
3.5 ∣. Prognostic effects of U2AF1 mutations
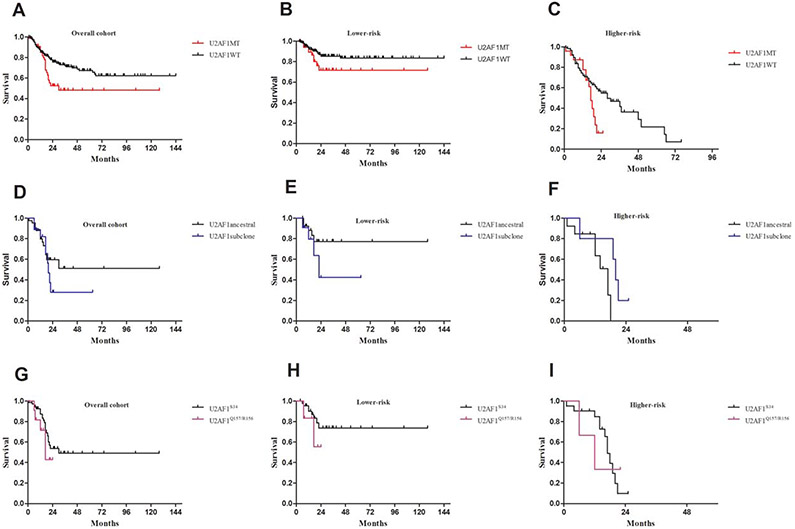
In our cohort, U2AF1MT was associated with worse overall survival (OS, P = .01; Figure 6A). In subset analyses, U2AF1MT tended to be associated with worse OS both in lower-risk patients (P = .076; Figure 6B) and in higher-risk patients (P = .064; Figure 6C). Patients with subclonal U2AF1MT tended to have a reduced median OS than patients with ancestral U2AF1MT (20 mo vs. not reached, P = .369; Figure 6D). Compared with ancestral U2AF1MT patients, we found that subclonal U2AF1MT tended to have a reduced median OS in lower-risk patients (22 vs. not reached, P = .211; Figure 6E) but an increased median OS in higher-risk patients (20 vs. 17 mo, P = .54; Figure 6F). To identify whether the subtype of U2AF1MT impacts OS, U2AF1MT was classified as two types, namely U2AF1S34 and U2AF1Q157/R156. MDS patients with U2AF1Q157/R156MT tended to have a reduced median survival as opposed to patients with S34 (17 vs. 30 mo, P = .318; Figure 6G). Compared with U2AF1S34MT patients, U2AF1Q157/R156 MT patients tended to have a worse prognosis in lower-risk patients (P = .339; Figure 6H), but not in higher-risk patients (P = .989; Figure 6I). Considering that U2AF1S34MT was most frequent in MDS patients, we further analyzed whether ancestry or subclone of U2AF1S34MT impacts OS in lower-risk and higher-risk patients. In the lower-risk cohort, patients with a subclonal U2AF1S34MT tended to have a reduced median OS compared with patients with ancestral U2AF1S34MT (22 vs. not reached, P = .153, Supporting Information, Figure S2A). However, in the higher-risk cohort, patients with ancestral mutations had a worse survival rate than patients with subclonal U2AF1S34MT (P = .012, Supporting Information, Figure S2B). Again, definitive conclusions from the subset analysis are hindered by the limited number of cases.
FIGURE 6.
Overall survival in patients with U2AF1 mutations. (A) Survival curves of U2AF1MT patients. (B) and (C) Subset survival analyses of U2AF1MT patients in lower-risk and higher-risk groups. (D) Survival curves of U2AF1MT patients stratified as ancestral or subclonal groups. (E) and (F) Subset survival analyses of U2AF1MT patients stratified as ancestral or subclonal groups in lower-risk and higher-risk groups. (G) Survival curves of U2AF1MT patients stratified as U2AF1S34 or U2AF1Q157/U2AF1R156. (H) and (I) Subset survival analyses of U2AF1MT patients stratified as U2AF1S34 or U2AF1Q157/U2AF1R156 in lower-risk and higher-risk groups
4 ∣. DISCUSSION
Genomic analyses have identified that MDS is characterized by a high frequency of mutations in genes encoding messenger RNA (mRNA) splicing factors as well as epigenetic modifiers.2-7 The discovery of mutations in RNA splicing factors, in particular, was quite unexpected as these mutations are generally uncommon in cancer yet are presented in about 50% of MDS patients. Acquired U2AF1MT was reported as the third most common spliceosome gene mutation, following mutations in SF3B1 and SRSF2 in previous studies.4-7 In our comprehensive analysis of 511 MDS patients, we identified that mutations involved in the splicing pathway are the most common mutations (37%) in our cohort. Compared with previous studies,4-7,16-18 U2AF1MT was slightly more frequent (17%), but SRSF2 mutations were rare (2.3%) and obviously less frequent in this cohort, and the distributions of S34 versus Q157 mutations were also much higher in our cohort. We considered several reasons to explain these differences. Firstly, the age distribution of patients is different among these cohorts. Furthermore, there may be fundamental biological differences in MDS between Chinese and predominately-Western people, as many well-defined diseases differ in different races and ethnic groups. For example, in previous studies from China,29,30 we also found a higher frequency of +8 in Chinese MDS patients than in patients of predominately European descent and speculated that this difference is due to the different exposure levels to chemicals and background ionizing radiation. Certainly, the genetic background on which these diseases occur may also play a role.
Interestingly, we observed that U2AF1MT patients were younger with an age-dependent trend, which was also reported by Wu et al.18 This is a surprising difference between U2AF1MT and many mutations closely associated with MDS, such as SF3B1, ASXL1, TET2, and TP53. However, data from four centers in Germany17 and one center in USA16 (Supporting Information, Figure S1F) show no significant association between U2AF1MT and age. We speculate that the reasons for the differences include the different number and age distribution of patients and possible ethnic differences among these cohorts (Supporting Information, Table S4). In accordance with previous studies,31-35 we also found that SF3B1, ASXL1, TET2, and TP53 more frequently occurred in older patients rather than in younger patients. Recently, three genetic studies of large populations have revealed that somatic mutations in hematopoietic cells leading to clonal expansion are commonly acquired during human aging.36-38 These studies demonstrated clonal hematopoiesis in ~10% of individuals older than 65 y of age. More than 80% of the observed mutations occur in known genes associated with leukemia, MDS, or lymphoma, including DNMT3A, TET2, ASXL1, and TP53. Because of the overlaps of the age and the gene mutation spectrum between MDS patients and healthy older people, these age-associated gene mutations may not function as driver events in MDS initiation. In contrast, U2AF1MT more frequently occur in MDS patients younger than 50 y of age. Jaiswa et al.37showed that detectable somatic mutations were rare in healthy subjects less than 40 y of age. Moreover, U2AF1MT occurs rarely in other tumors (pancreatic ductal adenocarcinomas 2% and lung adenocarcinomas 3%), but are particularly common in MDS without ring sideroblasts. Therefore, we speculate that U2AF1MT may be a potential driver event in MDS initiation. Furthermore, U2AF1MT was significantly associated with anemia, thrombocytopenia, isolated +8, and myelofibrosis but not with patients’ MDS subgroups or risks. However, Wu et al.18 found no significant differences in the hemograms and that U2AF1MT occurred more frequently in patients with isolated −20/20q–. We speculate that the association between U2AF1MT and cytopenia may be explained by the dysfunction of hematopoietic stem/progenitor cells with U2AF1MT, which have been observed.10,39,40 Data from both a U2AF1S34F transgenic mouse model36 and mutant S34F-transduced cells10,40 showed reduced cell proliferation with a marked increase in the G2/M fraction (G2/M arrest) together with enhanced apoptosis and impaired erythroid differentiation. However, the association between U2AF1MT and abnormal karyotypes needs to be studied further.
Using both univariate and multivariate analyses, we observed that SF3B1MT was inversely associated with U2AF1MT subjects, while KRASMT and ASXL1MT were significantly enriched in U2AF1MT subjects. Our observation is in accordance with previous studies,5,6 which showed that mutations in individual splicing factors are almost always mutually exclusive and that these mutations appear to coexist with distinct mutations in epigenetic modifiers. U2AF1 tends to coexist significantly with those in ASXL1MT, whereas mutations in SF3B1 frequently coexist with those in DNMT3A. The reason(s) for the association between spliceosome gene mutation and epigenetic modification is unclear and efforts to understand the mechanistic and biological contributions of these coexisting mutations on splicing and epigenetics may greatly facilitate our understanding of how mutations in RNA splicing promote MDS development. Perhaps one of the most intriguing potential links between splicing mutations and altered epigenetic regulation is the skewed splicing of H2AFY, which encodes the histone variant macroH2A1, in association with mutant U2AF1.39,40
The role of U2AF1 in MDS development is still unclear. The concept that mutant spliceosome genes are not required for disease maintenance is supported by recent data from Park et al.41 In their study, the authors identified that overexpression of mutant U2AF1S34F is capable of transforming cytokine-dependent Ba/F3 cells. However, once transformed, the cells no longer require the mutant RNA splicing factor for cytokine-independent growth. Overall, these data argue that mutations in RNA splicing factors may not be required once MDS or other forms of cancer are established. The non-requirement for RNA splicing factor mutations in disease maintenance would suggest that these mutations may be important in disease initiation, a possibility supported by the fact that mutations in RNA splicing factors appear to be some of the earliest genetic events in MDS development.5-7 Our current findings also support this. Firstly, we demonstrate, in a substantial proportion of cases (71%), that U2AF1MT represents an ancestral lesion, less often, U2AF1MT follows other ancestral mutations as subclonal events. Secondly, the clearance of U2AF1MT tended not to correlate with the clinical response. However, because of the limited number of samples in our cohort, analysis of a larger cohort with U2AF1MT is needed to confirm our findings. Lastly, U2AF1MT also occurs as a subclonal event following other ancestral mutations. Moreover, compared with ancestral U2AF1MT patients, subjects with subclonal U2AF1MT had a worse prognosis. Therefore, based on our data, we speculate that ancestral and subclonal U2AF1MT have different mechanisms in MDS initiation and development. Future studies are needed to determine the role of U2AF1MT in disease development.
U2AF1MT is concentrated in sequence encoding the S34 and Q157 residues,10,16-18 which lie within the first and second C3H zinc “knuckles” of the protein. S34 and Q157 mutations, respectively, affect recognition of the −3 (pyrimidine normally preferred) and +1 (purine normally preferred) positions, where the coordinates are defined with respect to the intron–exon boundary to induce different changes in 3′ splice site recognition.42 Similarly to Grauber et al.16 and Wu et al.,18 who reported that point mutations in codon S34 were more frequent than mutations in codon Q157, we observed that S34F was the most frequent (64%), followed by S34Y (23%), Q157R (6%), Q157P (5%), and R156H (2%) in our cohort. However, Thol et al.17 found more mutations in codon Q157. Compared with S34 patients, the Q157, or R156 patients tended to have a worse prognosis, particularly in lower-risk patients. Our findings support that S34 and Q157 have different functions and biological implications in MDS. At present, most data about how U2AF1MT affect downstream target gene expression are based on S34 mutant cells or on mouse models, but there is a lack of data about Q157/R156. Because of the different splice site recognition, we speculate that S34 and Q157/R156 may affect distinguishing downstream targets, which may result in distinct lineage-specific splicing alterations and phenotypes. Therefore, identifying these affected downstream targets will help to further our understanding of the molecular pathogenesis of MDS. To the best of our knowledge, this is the first time observed that different clinical, biological, and survival features have been reported among different types of U2AF1MT.
In summary, we present data that for the first time demonstrate distinct differences among different types of U2AF1MT, that is, S34 versus Q157 and ancestral versus subclonal. These data may be important for understanding the biological and clinical consequences of these mutations. Considering the frequency of U2AF1MT and that it may be an early genetic event in MDS, we believe that pre-mRNA splicing modulators,40,43,44 or U2AF1MT inhibitors will benefit patients with MDS carrying ancestral U2AF1MT.
Supplementary Material
Funding information
National Natural Science Funds, Grant Number: 81530008, 81370611, 81600098, 81270585, and 81470295; Program for Peking Union Scholars and Innovative Research Team; PUMC Youth Fund & Fundamental Research Funds for the Central Universities, Grant Number: 3332016089; Science and technology project of Tianjin, Grant Number: 15ZXLCSY00010
Footnotes
SUPPORTING INFORMATION
Additional Supporting Information may be found online in the supporting information tab for this article.
REFERENCES
- [1].Chamseddine AN, Jabbour E, Kantarjian HM, Bohannan ZS, Garcia-Manero G. Unraveling myelodysplastic syndromes: current knowledge and future directions. Curr Oncol Rep. 2016;18:4. [DOI] [PubMed] [Google Scholar]
- [2].Haider M, Duncavage EJ, Afaneh KF, Bejar R, List AF. New insight into the biology, risk stratification, and targeted treatment of myelodysplastic syndromes. AM Soc Clin Oncol Educ Book. 2017;37:480–494. [DOI] [PubMed] [Google Scholar]
- [3].Della Porta MG, Gallì A, Bacigalupo A, et al. Clinical effects of driver somatic mutations on the outcomes of patients with myelodysplasbiolog-icalbiologicaltic syndromes treated with allogenetic hematopoietic stem-cell transplantation. J Clin Oncol. 2016;34:3627–3637. [DOI] [PMC free article] [PubMed] [Google Scholar]
- [4].Bejar R, Stevenson K, Abdel-Wahab O, et al. Clinical effect of point mutations in myelodysplastic syndromes. N Engl J Med. 2011;364:2496–2506. [DOI] [PMC free article] [PubMed] [Google Scholar]
- [5].Papaemmanuil E, Gerstung M, Malcovati L, et al. Clinical and biolog myelodysplasticical implications of driver mutations in myelodysplastic syndromes. Blood. 2013;122:3616–3627. [DOI] [PMC free article] [PubMed] [Google Scholar]
- [6].Haferlach T, Nagata Y, Grossmann V, et al. Landscape of genetic lesions in 944 patients with myelodysplastic syndromes. Leukemia. 2014;28:241–247. [DOI] [PMC free article] [PubMed] [Google Scholar]
- [7].Makishima H, Yoshizato T, Yoshida K, et al. Dynamics of clonal evolution in myelodysplastic syndromes. Nat Genet. 2017;49:204–212. [DOI] [PMC free article] [PubMed] [Google Scholar]
- [8].Elias HK, Schinke C, Bhattacharyya S, Will B, Verma A, Steidl U. Stem cell origin of myelodysplastic syndromes. Oncogene. 2014;33:5139–5150. [DOI] [PubMed] [Google Scholar]
- [9].Papaemmanuil E, Cazzola M, Boultwood J, et al. Somatic SF3B1 mutation in myelodysplasia with ring sideroblasts. N Engl J Med. 2011;365:1384–1395. [DOI] [PMC free article] [PubMed] [Google Scholar]
- [10].Yoshida K, Sanada M, Shiraishi Y, et al. Frequent pathway mutations of splicing machinery in myelodysplasia. Nature. 2011;478:64–69. [DOI] [PubMed] [Google Scholar]
- [11].Lee Y, Rio DC. Mechanisms and regulation of alternative pre-mRNA splicing. Annu Rev Biochem. 2015;84:291–323. [DOI] [PMC free article] [PubMed] [Google Scholar]
- [12].Dvinge H, Kim E, Abdel-Wahab O, Bradley RK. RNA splicing factors as oncoproteins and tumor suppressor. Nat Rev Cancer. 2016;16:413–430. [DOI] [PMC free article] [PubMed] [Google Scholar]
- [13].Zhang J, Manley JL. Misregulation of pre-mRNA alternative splicing in cancer. Cancer Discov. 2013;3:1228–1237. [DOI] [PMC free article] [PubMed] [Google Scholar]
- [14].Cui R, Gale RP, Xu Z, et al. Clinical importance of SF3B1 mutations in Chinese with myelodysplastic syndromes with ring sideroblasts. Leuk Res. 2012;36:1428–1433. [DOI] [PubMed] [Google Scholar]
- [15].Malcovati L, Karimi M, Papaemmanuil E, et al. SF3B1 mutation identifies a distinct subset of myelodysplastic syndrome with ring sideroblasts. Blood. 2015;126:233–241. [DOI] [PMC free article] [PubMed] [Google Scholar]
- [16].Graubert TA, Shen D, Ding L, et al. Recurrent mutations in the U2AF1 splicing factor in myelodysplastic syndromes. Nat Genet. 2011;44:53–57. [DOI] [PMC free article] [PubMed] [Google Scholar]
- [17].Thol F, Kade S, Schlarmann C, et al. Frequency and prognostic impact of mutations in SRSF2, U2AF1, and ZRSR2 in patients with myelodysplastic syndromes. Blood. 2012;119:2578–2584. [DOI] [PubMed] [Google Scholar]
- [18].Wu SJ, Tang JL, Lin CT, et al. Clinical implications of U2AF1 mutations in patients with myelodysplastic syndrome and its stability during disease progression. Am J Hematol. 2013;88:E277–E282. [DOI] [PubMed] [Google Scholar]
- [19].Inoue D, Bradley RK, Abdel-Wahab O. Spliceosomal gene mutations in myelodysplasia: molecular links to clonal abnormalities of hematopoiesis. Genes Dev. 2016;30:989–1001. [DOI] [PMC free article] [PubMed] [Google Scholar]
- [20].Jenkins JL, Kielkopf CL. Splicing factor mutations in myelodysplasia: insights from spliceosome structures. Trends Genet. 2017;33:336–348. [DOI] [PMC free article] [PubMed] [Google Scholar]
- [21].Joshi P, Halene S, Abdel-Wahab O. How do messenger RNA splicing alterations drive myelodysplasia? Blood. 2017;129:2465–2470. [DOI] [PMC free article] [PubMed] [Google Scholar]
- [22].Arber DA, Orazi A, Hasserjian R, et al. The 2016 revision to the World Health Organization classification of myeloid neoplasms and acute leukemia. Blood. 2016;127:2391–2405. [DOI] [PubMed] [Google Scholar]
- [23].Greenberg P, Cox C, LeBeau MM, et al. International scoring system for evaluating prognosis in myelodysplastic syndromes. Blood. 1997;89:2079–2088. [PubMed] [Google Scholar]
- [24].Xiao Z, Xu Z, Zhang Y, Qin T, Zhang H, Fang L. Cyclosporin A and thalidomide in patients with myelodysplastic syndromes: results of a pilot study. Leuk Res. 2011;35:61–65. [DOI] [PubMed] [Google Scholar]
- [25].Xiao Z, Liu L, Xu Z, Qin T, Zhang Y, Zhang T. Low-dose melphalan in myelodysplastic syndromes: an effective treatment for elderly RAEB-I or II patients? Leuk Lymphoma. 2010;51:549–551. [DOI] [PubMed] [Google Scholar]
- [26].Cheson BD, Bennett JM, Kantarjian H, et al. Report of an international working group to standardize response criteria for myelodysplastic syndromes. Blood. 2000;96:3671–3674. [PubMed] [Google Scholar]
- [27].Nik-Zainal S, Van Loo P, Wedge DC, et al. The life history of 21 breast cancers. Cell. 2012;149:994–1007. [DOI] [PMC free article] [PubMed] [Google Scholar]
- [28].Molenaar RJ, Thota S, Nagata Y, et al. Clinical and biological implications of ancestral and non-ancestral IDH1 and IDH2 mutations in myeloid neoplasms. Leukemia. 2015;29:2134–2142. [DOI] [PMC free article] [PubMed] [Google Scholar]
- [29].Qu SQ, Liu XP, Xu ZF, et al. Study on prognostic significances of different cytogenetic risk categories in patients with primary myelodysplastic syndromes.Zhonghua Xue Ye Xue Za Zhi. 2011;32:819–824. [PubMed] [Google Scholar]
- [30].Chen B, Zhao W-L, Jin J, et al. Clinical and cytogenetic features of 508 Chinese patients with myelodysplastic syndrome and comparison with those in Western countries. Leukemia. 2005;19:767–775. [DOI] [PubMed] [Google Scholar]
- [31].Hirsch CM, Przychodzen BP, Radivoyevitch T, et al. Molecular features of early onset adult myelodysplastic syndrome. Haematologica. 2017;102:1028–1034. [DOI] [PMC free article] [PubMed] [Google Scholar]
- [32].Mason CC, Khorashad JS, Tantravahi SK, et al. Age-related mutations and chronic myelomonocytic leukemia. Leukemia. 2016;30:906–913. [DOI] [PMC free article] [PubMed] [Google Scholar]
- [33].Silva P, Neumann M, Schroeder MP, et al. Acute myeloid leukemia in the elderly is characterized by a distinct genetic landscape. Leukemia. 2017;31:1640–1644. [DOI] [PubMed] [Google Scholar]
- [34].McKerrell T, Park N, Moreno T, et al. Leukemia-associated somatic mutations drive distinct patterns of age-related clonal hemopoiesis. Cell Rep. 2015;10:1239–1245. [DOI] [PMC free article] [PubMed] [Google Scholar]
- [35].Ley TJ, Miller C, Cancer Genome Atlas Research Network, et al. Genomic and epigenomic landscapes of adult de novo acute myeloid leukemia. N Engl J Med. 2013;2013:2059–2074. [DOI] [PMC free article] [PubMed] [Google Scholar]
- [36].Xie M, Lu C, Wang J, et al. Age-related mutations associated with clonal hematopoietic expansion and malignancies. Nat Med. 2014;20:1472–1478. [DOI] [PMC free article] [PubMed] [Google Scholar]
- [37].Jaiswal S, Fontanillas P, Flannick J, et al. Age related clonal hematopoiesis associated with adverse outcomes. N Engl J Med. 2014;371:2488–2498. [DOI] [PMC free article] [PubMed] [Google Scholar]
- [38].Genovese G, Kähler A, Handsaker R, et al. Clonal hematopoiesis and blood-cancer risk inferred from blood DNA sequence. N Engl J Med. 2014;371:2477–2487. [DOI] [PMC free article] [PubMed] [Google Scholar]
- [39].Shirai CL, Ley JN, White BS, et al. Mutant U2AF1 expression alters hematopoiesis and pre-mRNA splicing in vivo. Cancer Cell. 2015;27:631–643. [DOI] [PMC free article] [PubMed] [Google Scholar]
- [40].Yip BH, Steeples V, Repapi E, et al. The U2AF1S34F mutation induces lineage-specific splicing alterations in myelodysplastic syndromes. J Clin Invest. 2017;127:2206–2221. [DOI] [PMC free article] [PubMed] [Google Scholar]
- [41].Park SM, Ou J, Chamberlain L, et al. U2AF35 (S34F) promotes transformation by directing aberrant ATG7 pre-mRNA 3′ end formation. Mol Cell. 2016;62:479–490. [DOI] [PMC free article] [PubMed] [Google Scholar]
- [42].Ilagan JO, Ramakrishnan A, Hayes B, et al. U2AF1 mutations alter splice site recognition in hematological malignancies. Genome Res. 2015;25:14–26. [DOI] [PMC free article] [PubMed] [Google Scholar]
- [43].Lee SC-W, Dvinge H, Kim E, et al. Modulation of splicing catalysis for therapeutic targeting of leukemia with mutations in genes encoding spliceosomal proteins. Nat Med. 2016;22:672–678. [DOI] [PMC free article] [PubMed] [Google Scholar]
- [44].Shirai CL, White BS, Tripathi M, et al. Mutant U2AF1-expressing cells are sensitive to pharmacological modulation of the spliceosome. Nat Commun. 2017;8:14060. [DOI] [PMC free article] [PubMed] [Google Scholar]
Associated Data
This section collects any data citations, data availability statements, or supplementary materials included in this article.


