Abstract
The lag time of Listeria monocytogenes growing under suboptimal conditions (low nutrient concentrations, pH 6, and 6.5°C) was extended when the inoculum was severely stressed by starvation and the inoculum size was very small. Predictive microbiology should deal with bacterial stress and stochastic approaches to improve its value for the agro-food industry.
In predictive microbiology, it is commonly assumed that inoculum size has no effect on subsequent microbial growth, and some studies (8, 9, 10) have confirmed this for growth of Listeria monocytogenes. However, Gay et al. (12) observed that inoculum size could have an effect on the duration of the lag phase of L. monocytogenes under particular conditions simulating soft cheese ripening. This observation could challenge the validity of predictive models because growth modelling is usually done with initial concentrations of bacteria higher than 103 CFU · ml−1, even though foods are usually contaminated with lower numbers of cells.
It has been shown with other bacteria, like Bacillus (19), Achromobacter delmarvae, Micrococcus luteus (see reference 16 for review), and Salmonella (26), that the duration of the lag phase depends inversely on the size of the inoculum. This phenomenon was observed only under a restricted range of conditions, for example, in poor but not in rich media, with starved cells (16), or with heat-injured cells (26). The aim of this work was to study the effect of inoculum size on the lag phase of L. monocytogenes growing in a poor medium, i.e., broth, containing only 1 g of Bacto Peptone (Difco Laboratories, Detroit, Mich.) per liter plus 0.85% sodium chloride (Prolabo, Paris, France) (TS), under suboptimal conditions: pH 6 and 6.5°C and with cells stressed by starvation.
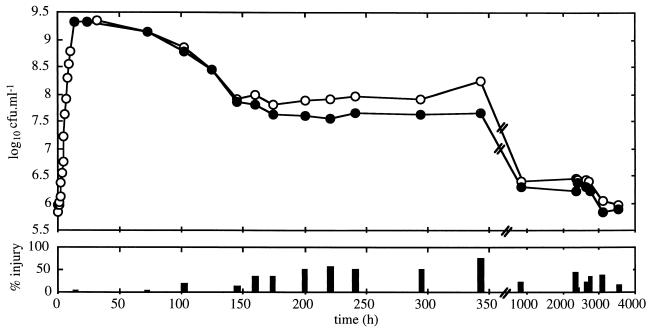
L. monocytogenes Scott A maintained on tryptone-soya agar (Oxoid, Unipath, Ltd., Basingstoke, Hampshire, England) at 4°C was subcultured onto tryptone-soya agar (Oxoid) plus 0.6% yeast extract (AES, Combourg, France) (TSYE) at 37°C for 24 h, and five colonies were transferred into TSYE broth and incubated at 30°C for 24 h. This culture was used to inoculate TSYE broth to prepare inocula at 30°C. The change in viable count of L. monocytogenes in TSYE broth at 30°C determined on nonselective TSYE agar and selective Palcam (Oxoid) agar is shown in Fig. 1. The percentage of injured cells was determined by differential counts on selective and nonselective media (24). Inocula were prepared at 30°C for 14, 160, and 840 h to obtain cells in late log phase, early stationary phase after a decrease in cell viability of 96.8% viable cells and 35% injured cells and late stationary phase with a loss of viability of 99.9% and 21% injured cells (Fig. 1). Samples were prepared by filtering 10 ml of culture through a 0.45-μm-pore-size sterile filter (Schleicher & Schuell, Dassel, Federal Republic of Germany). Cells were washed three times with 10 ml of sterile TS and removed from the membrane with 10 ml of TS.
FIG. 1.
Viable counts on TSYE agar (○) and Palcam agar (●) of L. monocytogenes incubated in TSYE broth at 30°C.
TS agar (100 ml) with pH adjusted to 6.0 with 1 M HCl in 250-ml flasks was inoculated with 1 ml of a 10- or 100-fold dilution of filtered cells and incubated at 6.5°C. Initial bacterial concentrations for cells in late log and early and late stationary phases ranged from 104 to 10−2, 102 to 10−2, and 104 to 100 CFU · ml−1, respectively. The cultures were grown once, except for cells in late log phase with initial concentrations of 101 and 10−2 CFU · ml−1, which were grown in triplicate. Flasks containing high bacterial concentrations (more than 30 CFU · ml−1) were enumerated by performing plate counts on TSYE agar incubated at 37°C for 24 h. Flasks containing low bacterial concentrations (<30 CFU · ml−1) were enumerated by the most-probable-number technique used by Gay et al. (12).
Growth curves were fitted using the logistic equation with delay, i.e., with a breakpoint at the transition between the lag and the exponential phase (3, 18, 24):
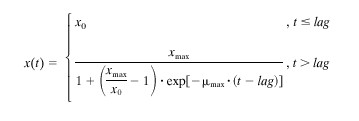 |
where x(t) is the bacterial concentration (CFU per milliliter) at time t (in hours), x0 is the initial bacterial concentration, xmax is the maximum bacterial concentration, lag is the duration of the lag phase (in hours), and μmax is the maximum specific growth rate (per hour).
Fits were performed by nonlinear regression using the weighted-least-squares criterion (5) by minimizing the sum of the weighted squared residuals (SWSR). SWSR is defined as follows:
 |
where n is the number of datum points and wi is the reciprocal of the variance of log(xi) observed. These variances were estimated from replicates when they were available or were theoretically calculated from the variances of the numbers of microorganisms per sample (11) and from dilution and plating errors (15). The minimum SWSR values were computed with the NLINFIT subroutine of MATLAB 5.2 software (The Math Works Inc., Natick, Mass.), modified for weighted method of least squares.
Maximum specific growth rates and lag times obtained for growth of L. monocytogenes in TS agar at 6.5°C are shown in Table 1. Confidence regions for parameter estimations were defined as parameter values checking Beale's inequality (4, 20):
 |
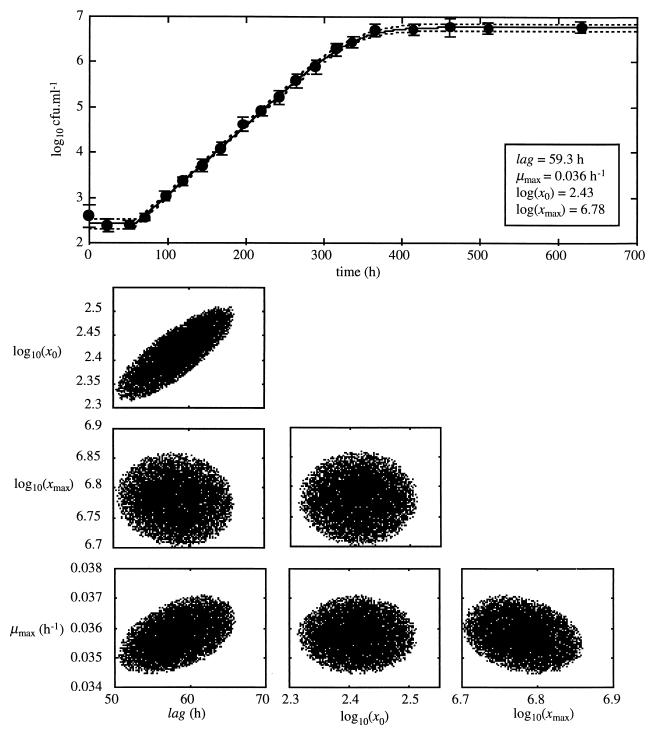
where Θ is the vector of parameter values, Θ̂ is the vector of weighted-least-squares-estimated parameters, n is the number of datum points, p is the number of parameters, and Fp, n-pα is the α quantile for Fisher's F distribution with p and n - p degrees of freedom. Random sampling in the parameter space of points whose SWSR value checked the inequality was made with MATLAB software. Confidence limits for parameter values were determined by projecting these points in each of the parameter planes (Fig. 2). No significant effect of inoculum size or duration of storage at 30°C in TSYE broth was observed on maximum specific growth rates (Table 1) or on lag time with storage of 14 h, and an average lag time of 40.6 ± 13.4 h (standard deviation [SD]) was obtained.
TABLE 1.
Growth parameters of L. monocytogenes in TS, pH 6, at 6.5°C after different durations of storage at 30°Ca
| Duration of storage (h) | log10(x0) | Duration of log phase (h) | μmax (h−1) |
|---|---|---|---|
| 14 | 4.30 (4.22, 4.39) | 61.6 (28.3, 75.8) | 0.068 (0.038, 0.103) |
| 3.32 (3.23, 3.41) | 24.7 (16.9, 40.9) | 0.040 (0.036, 0.048) | |
| 2.38 (2.26, 2.47) | 32.6 (21.9, 43.9) | 0.048 (0.045, 0.052) | |
| 1.32 (1.20, 1.45) | 26.6 (8.19, 78.7) | 0.044 (0.035, 0.105) | |
| 0.39 (0.24, 0.53) | 44.2 (31.6, 56.1) | 0.057 (0.053, 0.062) | |
| −0.68 (−1.05, −0.32) | 50.9 (34.0, 69.1) | 0.055 (0.053, 0.057) | |
| −1.66 (−Infb, −1.14) | 43.6 (−Inf, 101) | 0.046 (0.039, 0.055) | |
| 160 | 2.43 (2.32, 2.51) | 59.3 (50.4, 65.9) | 0.036 (0.034, 0.037) |
| 1.41 (1.10, 1.70) | 79.1 (55.6, 98.4) | 0.037 (0.035, 0.040) | |
| 0.54 (0.15, 1.00) | 93.1 (66.0, 126) | 0.035 (0.034, 0.037) | |
| −0.41 (−1.08, 0.28) | 95.1 (47.4, 139) | 0.035 (0.034, 0.039) | |
| −1.41 (−2.50, −0.34) | 98.8 (32.9, 160) | 0.041 (0.038, 0.044) | |
| 840 | 4.70 (4.61, 4.78) | 43.3 (35.2, 51.9) | 0.045 (0.041, 0.051) |
| 2.68 (2.64, 2.75) | 56.8 (50.7, 60.7) | 0.043 (0.038, 0.045) | |
| 0.74 (0.59, 0.89) | 66.6 (56.7, 79.8) | 0.046 (0.044, 0.049) |
In parentheses are the 95% confidence limits.
Inf, infinity.
FIG. 2.
Growth curve of L. monocytogenes grown in TS, pH 6, at 6.5°C after storage at 30°C for 160 h. The solid line is the best fit of the growth model to the data, and the dotted lines define the 95% confidence region for the growth curve. Vertical bars indicate 1 SD of the bacterial cell count. At the bottom are the 95% confidence regions of estimated growth parameters.
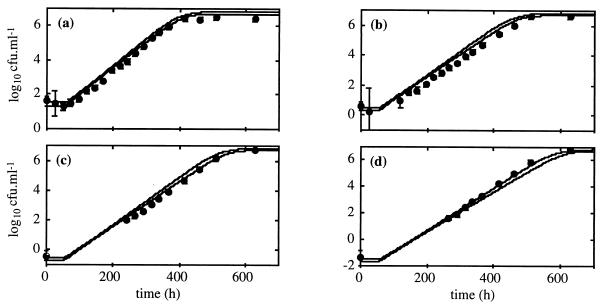
Increasing lag time was observed with storage for 160 h when the inoculum size was decreased from 102 to 100 CFU · ml−1 (Table 1). Because large 95% confidence regions were obtained for these estimated lag times, this increase was not significant. The growth curve with an initial bacterial concentration of 102 CFU · ml−1 was used to derive growth parameters with their confidence regions (Fig. 2) and to predict confidence regions of growth curves for smaller inoculum sizes (Fig. 3). Because the growth model is a monotonous function for each parameter, confidence regions (α = 0.05) for the predicted growth curves were constructed by determining the minimum and the maximum of the function when the parameter values belong to the confidence regions (13). Longer lag times were observed for inoculum sizes of 101 to 10−1 CFU · ml−1 but not with the inoculum size of 10−2 CFU · ml−1. The effect of inoculum size on lag time was considered not significant given the available datum sets. The average lag time for the cells stored for 160 h at 30°C was 85.1 ± 16.2 h (SD).
FIG. 3.
Predicted growth curves and observed bacterial cell counts of L. monocytogenes in TS, pH 6, at 6.5°C after storage for 160 h at 30°C for suspensions with initial bacterial concentrations of 101 (a), 100 (b), 10−1 (c), and 10−2 (d) CFU · ml−1. The solid lines define the 95% confidence regions of the predicted growth curves from the parameters estimated with the initial bacterial concentration of 102 CFU · ml−1. Vertical bars indicate 1 SD.
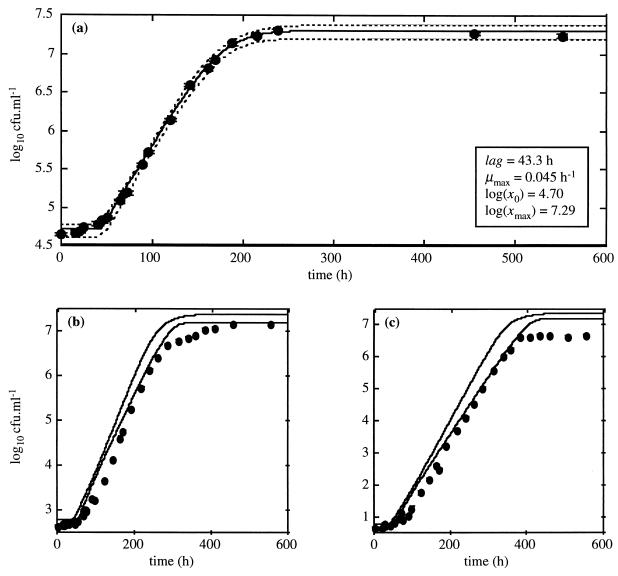
A uniform increase in lag time with decreased inoculum size was observed for storage for 840 h, and the difference between lag times obtained for initial concentrations of 104 and 100 CFU · ml−1 was significant, as 95% confidence regions did not overlap (Table 1). By using the growth curve with an initial bacterial concentration of 104 CFU · ml−1 to predict 95% confidence regions for growth curves with smaller inoculum sizes (Fig. 4), discrepancies between predicted growth regions and observed growth curves were found for initial bacterial concentrations of 102 and 100 CFU · ml−1.
FIG. 4.
Growth curve of L. monocytogenes in TS, pH 6, at 6.5°C after storage for 840 h at 30°C for the suspension with initial bacterial count of 104 CFU · ml−1 (a) and predicted growth curves and observed bacterial cell counts for suspensions with initial bacterial concentrations of 102 (b) and 100 (c) CFU · ml−1. In panel a, the solid line is the best fit of the growth model to the data and the dotted lines define the 95% confidence region for the growth curve. In panels b and c, the solid lines define the 95% confidence regions of the predicted growth curves. Vertical bars indicate 1 SD of the bacterial cell count.
The change from an inoculum of approximately 102 CFU · ml−1 maintained at 30°C for 14 h to an inoculum of about 1 CFU · ml−1 starved for 840 h at 30°C led to an increase in lag time from 32.6 to 66.6 h. The extension of lag phase with physical injury of cells has been frequently reported (14, 17, 21, 22), and models describing the effect of heat injury on subsequent lag period have been published for L. monocytogenes (6, 7, 23). Albertson et al. (1) also observed a uniform increase in lag time with increasing starvation time for a Vibrio sp., but no models have been published.
The inoculum size effect, observed only with cells severely stressed by starvation, could be explained by an increase in the variation of individual cells' lag time when cells are stressed (2, 26). Predictive microbiology should deal with stochastic models for the prediction of the growth of the small populations typically encountered in foods, especially when microbial cells have been subject to injury.
Acknowledgments
This work was supported by the Association Vétérinaire d'Hygiène Alimentaire.
We thank Cécile Lahellec and Olivier Cerf, who initiated this work, and Tobin Robinson for the helpful and critical reading of the manuscript.
REFERENCES
- 1.Albertson N H, Nyström T, Kjelleberg S. Macromolecular synthesis during recovery of the marine Vibrio sp. S14 from starvation. J Gen Microbiol. 1990;136:2201–2207. [Google Scholar]
- 2.Baranyi J. Comparison of stochastic and deterministic concepts of bacterial lag. J Theor Biol. 1998;192:403–408. doi: 10.1006/jtbi.1998.0673. [DOI] [PubMed] [Google Scholar]
- 3.Baranyi J, Roberts T A, McClure P. A non-autonomous differential equation to model bacterial growth. Food Microbiol. 1993;10:43–59. [Google Scholar]
- 4.Bates D M, Watts D G. Nonlinear regression analysis and its applications. New York, N.Y: Wiley; 1988. pp. 200–231. [Google Scholar]
- 5.Box G E P, Hunter W G, Hunter J S. Statistics for experimenters: an introduction to design, data analysis and model building. New York, N.Y: Wiley; 1978. pp. 505–509. [Google Scholar]
- 6.Bréand S, Fardel G, Flandrois J P, Rosso L, Tomassone R. A model describing the relationship between lag time and mild temperature increase duration. Int J Food Microbiol. 1997;38:157–167. doi: 10.1016/s0168-1605(97)00093-7. [DOI] [PubMed] [Google Scholar]
- 7.Bréand S, Fardel G, Flandrois J P, Rosso L, Tomassone R. A model describing the relationship between regrowth lag time and mild temperature increase for Listeria monocytogenes. Int J Food Microbiol. 1999;46:251–261. doi: 10.1016/s0168-1605(98)00200-1. [DOI] [PubMed] [Google Scholar]
- 8.Buchanan R L, Phillips J G. Response surface model for predicting the effects of temperature, pH, sodium chloride content, sodium nitrite concentration and atmosphere on the growth of Listeria monocytogenes. J Food Prot. 1990;53:370–376. doi: 10.4315/0362-028X-53.5.370. [DOI] [PubMed] [Google Scholar]
- 9.Denis F, Ramet J-P. Antibacterial activity of the lactoperoxidase system on Listeria monocytogenes in trypticase soy broth, UHT milk and French soft cheese. J Food Prot. 1989;52:706–711. doi: 10.4315/0362-028X-52.10.706. [DOI] [PubMed] [Google Scholar]
- 10.Duffy G, Sheridan J J, Buchanan R L, McDowell D A, Blair I S. The effect of aeration, initial inoculum and meat microflora on the growth kinetics of Listeria monocytogenes in selective enrichment broths. Food Microbiol. 1994;11:429–438. [Google Scholar]
- 11.Finney D J. Statistical method in biological assay. London, England: Griffin; 1978. pp. 418–439. [Google Scholar]
- 12.Gay M, Cerf O, Davey K R. Significance of pre-incubation temperature and inoculum concentration on subsequent growth of Listeria monocytogenes at 14°C. J Appl Bacteriol. 1996;81:433–438. doi: 10.1111/j.1365-2672.1996.tb03530.x. [DOI] [PubMed] [Google Scholar]
- 13.Huet S, Jolivet E, Messéan A. La régression non-linéaire: méthodes et applications en biologie. Paris, France: Institut National de la Recherche Agronomique; 1992. pp. 201–213. [Google Scholar]
- 14.Jackson H, Woodbine M. The effect of sublethal heat treatment on the growth of Staphylococcus aureus. J Appl Bacteriol. 1963;26:152–158. [Google Scholar]
- 15.Jarvis B. Errors associated with colony count procedures. Prog Ind Microbiol. 1989;21:95–116. [Google Scholar]
- 16.Kaprelyants A S, Kell D B. Do bacteria need to communicate with each other for growth? Trends Microbiol. 1996;4:237–242. doi: 10.1016/0966-842X(96)10035-4. [DOI] [PubMed] [Google Scholar]
- 17.Kaufman O W, Harmon L G, Pailthorp O C, Pflug I J. Effect of heat treatment on the growth of surviving cells. J Bacteriol. 1959;78:834–838. doi: 10.1128/jb.78.6.834-838.1959. [DOI] [PMC free article] [PubMed] [Google Scholar]
- 18.Kono T. Kinetics of microbial cell growth. Biotechnol Bioeng. 1968;10:105–131. [Google Scholar]
- 19.Lankford C E, Walker J R, Reeves J B, Nabbut N H, Byers B R, Jones R J. Inoculum-dependent division lag of Bacillus cultures and its relation to an endogenous factor(s) (“schizokinen”) J Bacteriol. 1966;91:1070–1079. doi: 10.1128/jb.91.3.1070-1079.1966. [DOI] [PMC free article] [PubMed] [Google Scholar]
- 20.Lobry J R, Rosso L, Flandrois J P. A FORTRAN subroutine for the determination of parameter confidence limits in non-linear models. Binary. 1991;3:86–93. [Google Scholar]
- 21.Mackey B M, Derrick C M. The effect of sublethal injury by heating, freezing, drying and gamma-radiation on the duration of the lag phase of Salmonella typhimurium. J Appl Bacteriol. 1982;53:243–251. doi: 10.1111/j.1365-2672.1982.tb04683.x. [DOI] [PubMed] [Google Scholar]
- 22.Mackey B M, Derrick C M. Conductance measurements of the lag phase of injured Salmonella typhimurium. J Appl Bacteriol. 1984;57:299–308. doi: 10.1111/j.1365-2672.1984.tb01394.x. [DOI] [PubMed] [Google Scholar]
- 23.McKellar R C, Butler G, Stanich K. Modelling the influence of temperature on the recovery of Listeria monocytogenes from heat injury. Food Microbiol. 1997;14:617–625. [Google Scholar]
- 24.Meyer D H, Donnelly C W. Effect of incubation temperature on repair of heat-injured Listeria in milk. J Food Prot. 1992;55:579–582. doi: 10.4315/0362-028X-55.8.579. [DOI] [PubMed] [Google Scholar]
- 25.Rosso L, Bajard S, Flandrois J P, Lahellec C, Fournaud J, Veit P. Differential growth of Listeria monocytogenes at 4 and 8°C: consequences for the shelf life of chilled products. J Food Prot. 1996;59:944–949. doi: 10.4315/0362-028X-59.9.944. [DOI] [PubMed] [Google Scholar]
- 26.Stephens P J, Joynson J A, Davies K W, Holbrook R, Lappin-Scott H M, Humphrey T J. The use of an automated growth analyser to measure recovery times of single heat-injured Salmonella cells. J Appl Microbiol. 1997;83:445–455. doi: 10.1046/j.1365-2672.1997.00255.x. [DOI] [PubMed] [Google Scholar]


