

Summary:
Biological heterogeneity in diffuse large B cell lymphoma (DLBCL) is partly driven by cell-of-origin subtypes and associated genomic lesions, but also by diverse cell types and cell states in the tumor microenvironment (TME). However, dissecting these cell states and their clinical relevance at scale remains challenging. Here, we implemented EcoTyper, a machine learning framework integrating transcriptome deconvolution and single-cell RNA sequencing, to characterize clinically relevant DLBCL cell states and ecosystems. Using this approach, we identified five cell states of malignant B cells that vary in prognostic associations and differentiation status. We also identified striking variation in cell states for 12 other lineages comprising the TME and forming cell-state interactions in stereotyped ecosystems. While cell-of-origin subtypes have distinct TME composition, DLBCL ecosystems capture clinical heterogeneity within existing subtypes and extend beyond cell-of-origin and genotypic classes. These results resolve the DLBCL microenvironment at systems-level resolution and identify opportunities for therapeutic targeting (https://ecotyper.stanford.edu/lymphoma).
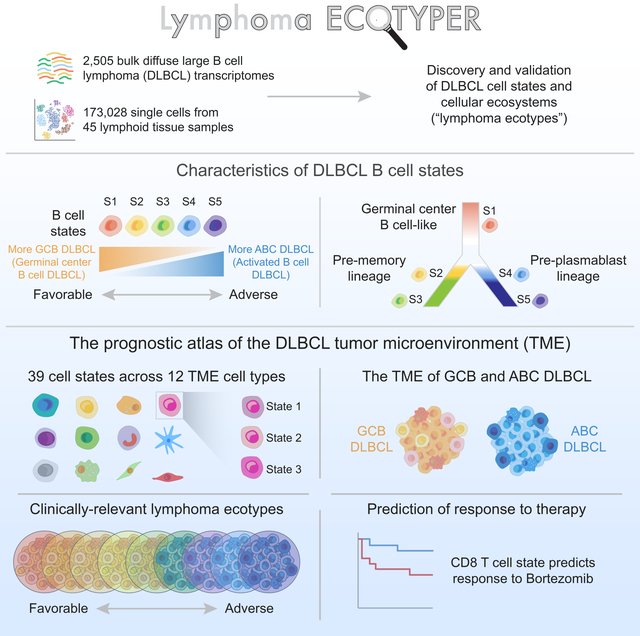
Graphical Abstract
Introduction
The most common hematological malignancy, diffuse large B cell lymphoma (DLBCL), is a neoplasm of mature B lymphocytes that exhibits striking clinical and biological heterogeneity (Menon et al., 2012). A prominent molecular and clinical distinction in DLBCL relates to the developmental cell of origin (COO) of these transformed B lymphocytes, where patients with germinal center B cell-like (GCB) DLBCL show longer survival compared to patients with activated B cell-like (ABC) DLBCL (Alizadeh et al., 2000; Rosenwald et al., 2002). These developmental subtypes are driven by distinct genotypes with associated B cell phenotypes that inform additional classification refinements (Chapuy et al., 2018; Reddy et al., 2017; Scherer et al., 2016; Schmitz et al., 2018). In addition to molecular features of malignant tumor B cells, molecular signatures reflecting diverse non-malignant cell types in the DLBCL tumor microenvironment (TME) are also known to impact the observed biological and clinical heterogeneity in the disease (Lenz et al., 2008; Monti et al., 2005). Indeed, several therapies relying on the activity of such cells in the TME, including monoclonal antibodies, checkpoint blockade, and chimeric antigen receptor T cells, have been approved or are currently under investigation for treatment of aggressive B-cell lymphomas (Advani et al., 2018; Ennishi et al., 2020; Schuster et al., 2019; Tilly et al., 2015). Nevertheless, DLBCL remains incurable for approximately 40% of patients, and a better understanding of the associated TME could help identify more effective therapeutic strategies (Marie de and Roch, 2018; Scott and Gascoyne, 2014; Tilly et al., 2015).
Previous efforts have shown the promise of exploring the TME for identification of novel treatment strategies in lymphoma. For example, blockade of programmed death-ligand 1 (PD-1) expressed on tumor-infiltrating T cells has yielded high response rates in Hodgkin lymphomas and primary mediastinal B cell lymphomas (Ansell et al., 2015; Armand et al., 2016; Chen et al., 2017; Melani et al., 2017; Younes et al., 2016). While PD-1 checkpoint manipulation might generally be less effective in DLBCL than in other lymphoma subtypes (Batlevi et al., 2016; Lesokhin et al., 2016), several other targets for immunotherapy have shown promising results in pre-clinical and early clinical studies of DLBCL (Advani et al., 2018; Chao et al., 2010; Ennishi et al., 2020).
Recently, the advent of single cell RNA-sequencing (scRNA-seq) has enabled detailed surveys of cell subsets in diverse tumor types (Suvà and Tirosh, 2019). For example, scRNA-seq studies identified checkpoint molecule expression on lymphoma-associated T cell subsets (Andor et al., 2019; Aoki et al., 2020), and have uncovered the impact of tumor subclonal heterogeneity on drug response (Roider et al., 2020). While such studies can provide critical insights into clinically-relevant cellular diversity, scRNA-seq studies of lymphomas have thus far been of moderate size and are potentially prone to dissociation distortions and patient-specific heterogeneity (Segerstolpe et al., 2016; van den Brink et al., 2017). These limitations have made it challenging to reliably identify cell states and ecosystems that are robustly linked to therapeutic response and that are generalizable across patients. Furthermore, clinically relevant transcriptional heterogeneity in the DLBCL TME remains poorly defined, particularly in relation to COO, and a large-scale systematic analysis of the DLBCL TME is currently lacking.
Here, we applied EcoTyper, an integrative machine learning framework, to derive a high-resolution atlas of 13 cell types from hundreds of DLBCL tumors. In doing so, we identified 44 cell states reflecting malignant B cells and other cell types in the DLBCL TME. We uncovered a rich landscape of cellular ecosystems that extend beyond previous DLBCL classifications and explored the potential utility of this approach for therapy selection informed by the TME. Together, our findings provide a systems-level portrait of the prognostic tumor microenvironment and ecosystems in DLBCL.
Results
High-Throughput Cell State Discovery and Ecosystem Profiling in DLBCL
We developed EcoTyper as a unified framework for large-scale identification and validation of cell states and multicellular ecosystems from complex tissues (Figure 1A, STAR Methods). By default, EcoTyper applies CIBERSORTx, a machine learning platform for digital cytometry, to impute cell type-specific gene expression profiles at single-sample resolution from bulk tissue transcriptomes (Newman et al., 2019). It then identifies transcriptionally-defined states within each cell type; recovers and validates cell states in external expression datasets, including scRNA-seq data; and determines robust cell-state cooccurrence patterns that define cellular communities. Collectively, these functions enable unbiased profiling of cell states and multicellular ecosystems without the need for antibodies, physical cell isolation, or viable material.
Figure 1. Framework for Large-Scale Determination of Cell States and Ecosystems in DLBCL.

(A) Overview of EcoTyper and its application to cell state discovery and ecosystem profiling in DLBCL. LE, lymphoma ecotype. (B) Summary of DLBCL patient cohorts and bulk tumor transcriptomes. (C) UMAP of seven lymphoid tumors and one tonsil specimen profiled in this work by scRNA-seq. (D) Heat map showing the number of cells (post-quality control) per lymphoid scRNA-seq dataset analyzed in this study. See also Figure S1.
To implement EcoTyper for DLBCL, we assembled bulk and single-cell gene expression data covering diverse malignant and healthy lymphoid tissue specimens (Table S1). First, we compiled bulk transcriptomic data of 1,577 DLBCL tumors, including formalin-fixed paraffin embedded (FFPE) surgical resections and cryopreserved samples, from four independent cohorts profiled by RNA-seq or microarrays (Chapuy et al., 2018; Ennishi et al., 2019; Reddy et al., 2017; Schmitz et al., 2018) (Figure 1B). Importantly, nearly all patients were treated in the modern chemoimmunotherapy era with curative intent, and most had clinical outcomes, COO subtyping, and somatic mutations available. From these data, we established a discovery cohort (Schmitz et al.) consisting of 522 fresh/frozen surgical biopsies of primary DLBCL tumors profiled by RNA-seq (Figure 1A,B). The remaining three DLBCL datasets were held out as validation cohorts.
To further validate EcoTyper and to resolve imputed cell states at the single-cell level, we applied scRNA-seq (10x Genomics Chromium, 5’ assay) and single-cell immunoglobulin VDJ sequencing (scVDJ-seq) to profile a range of malignant and normal nodal specimens. These primary human specimens included four de novo DLBCL tumors, three follicular lymphomas (FLs) including one experiencing transformation, and one pediatric tonsil (Figures 1C and S1A,B; Table S1). We augmented these data with five publicly available scRNA-seq datasets encompassing additional lymphoid tumors, healthy tonsils, and reactive lymph nodes (Andor et al., 2019; Aoki et al., 2020; King et al., 2021; Roider et al., 2020; Zhang et al., 2019), resulting in a pan-lymphoid tissue atlas consisting of 173,028 single cells from 45 tissue specimens (Figures 1D and S1C; Table S1).
Next, to determine cell type abundance and expression variation from bulk tumors (Figure 1A, left), we compiled reference profiles for 13 cell types that comprise the majority of cellular content found in DLBCL tumors: B cells, plasma cells, CD8 T cells, CD4 T cells, CD4 regulatory T cells, CD4 follicular helper T cells, NK cells, monocytes and macrophages, dendritic cells, neutrophils, mast cells, endothelial cells, and fibroblasts (Figure 1A). Importantly, all reference profiles were previously validated for deconvolution performance in diverse human tumor types (Newman et al., 2015; Newman et al., 2019). To extend these studies to lymphoid tissues, we applied CIBERSORTx to deconvolve specimens with known composition. Regardless of whether we analyzed real DLBCL transcriptomes with known tumor content or simulated tissues reconstituted from scRNA-seq data, estimated cell fractions were significantly correlated with ground truth expectations (P < 0.05; Figure S1D,E).
Given these data and the unique analytical system that we developed, we set out to chart the landscape of cell states and multicellular ecosystems in DLBCL (Figure S1F–I).
Atlas of DLBCL B Cell States Across 1.6k Tumors
We began by applying EcoTyper to decode cellular heterogeneity across 522 DLBCL tumors in the discovery cohort (Figures 1A and S1F). Cell type abundance estimation followed by digital transcriptome purification with CIBERSORTx (Newman et al., 2019) resulted in 6,786 gene expression profiles (GEPs), or 13 cell-type specific GEPs per tumor specimen. As each digitally-purified GEP may contain a mixture of cellular states, EcoTyper implements a specialized framework for non-negative matrix factorization (NMF), in which each GEP is automatically reconstructed as a weighted combination of discrete transcriptional programs (i.e., ‘states’) (Figure S1G,H; STAR Methods). The number of cell states per cell type is determined in a manner that maximizes the sensitivity and positive predictive value of cell state discovery, while also ensuring the stability of clustering results (STAR Methods). Application of this approach resulted in the identification of 44 distinct cellular states, ranging from 2 to 5 states per cell type (Figure S1F–H).
To characterize this atlas, we started with B cells, the malignant cell population in DLBCL and the current basis for its molecular classification. EcoTyper identified five B cell states in DLBCL tumors, including several with characteristics of GCB or ABC subtypes (Figure 2A) (Hans et al., 2004). For example, state S1 displayed high levels of canonical marker genes associated with GCB DLBCL (e.g., MME [CD10], LMO2, and MYBL1), whereas states S4 and S5 expressed marker genes of ABC DLBCL (e.g., PTPN1 in S4 and PIM1 in S5). Despite these enrichments, when tumor samples were classified according to their most abundant B cell state (Figure 2A; Table S2), COO subtypes were remarkably widespread, with several states (S2–S4) showing notable representation within and across COO subtypes (Figure 2A; Table S2). To corroborate these findings, we applied EcoTyper to quantitate each state in three validation datasets (Figure 1B). Our results from the discovery cohort were highly reproducible, both for state-specific marker genes and COO enrichment patterns (Figure 2B; Table S2). Importantly, these results were robust to dataset-specific variation in the distribution of COO subtypes (Figure S2A,B).
Figure 2. Molecular and Clinical Characteristics of B Cell States in DLBCL.

(A) Heat map depicting five B cell states identified from digitally purified DLBCL B cell transcriptomes (discovery cohort). Patient samples (columns) are organized by the most prevalent cell state and annotated with bulk tumor COO labels. Only genes used for cell state discovery are shown (n = 1,000). (B) Same as A but for three validation cohorts. (C) Expression of B cell state-specific marker genes (n = top 50 by log2 fold change) in the discovery cohort (left) and six lymphoid scRNA-seq datasets (right). (D) Overlap between LymphGen subtypes and DLBCL B cell states in the discovery cohort. (E) Overlap between C1-C5 subtypes and DLBCL B cell states in the Chapuy et al. cohort. Samples were assigned to the most abundant B cell state in D and E (Table S2). (F) Progression free survival (PFS) and overall survival (OS) for each B cell state in four DLBCL cohorts (Figure 1B). Significance was determined by a two-sided log-rank test. (G) Left: Association of each B cell state with OS. Right: Survival associations integrated across cohorts (STAR Methods). Survival associations are expressed as −log10 p-values oriented by survival direction (red, shorter OS; blue, longer OS). See also Figure S2.
Given these observations, we next sought to validate each state at the single-cell level. EcoTyper implements a supervised approach for mapping single-cell transcriptomes to predefined cell states and for evaluating the significance of cell state recovery (STAR Methods). Using this approach, we classified 117,869 B cells from DLBCL tumors and other lymphoid tissues. All B cell states were readily detectable with high statistical confidence (Table S2). Moreover, state-specific marker genes were reproducible across scRNA-seq datasets and tissue types (Figure 2C; Table S2). Most B cell states showed enriched representation in tumor specimens, with the notable exception of S3, which was detectable in tumors but enriched in normal lymphoid tissues (Figure S2C; Table S2).
Having identified five B cell states in DLBCL, we next investigated their relationships with mutational patterns and overall survival (OS) outcomes. Several genotypic classes have been described in DLBCL (Chapuy et al., 2018; Schmitz et al., 2018), including mutational signatures that reflect COO (Scherer et al., 2016). As such, we first tested whether B cell states co-associate with LymphGen subtypes, a collection of recently described mutational classes with distinct clinical outcomes (Wright et al., 2020). While some states were enriched in LymphGen subtypes (e.g., S1 in EZB DLBCL), most enrichments were modest in magnitude (Figure 2D and Table S2). Moreover, a sizeable fraction of tumors spanning all five B cell states were entirely unclassifiable by LymphGen (Figure 2D).
We next asked whether B cell states co-associate with the C1-C5 genetic subtypes described by Chapuy and colleagues (Chapuy et al., 2018). Given the absence of a publicly available classifier, we developed two naïve-Bayes classifiers to identify the C1-C5 subtypes in new data, one tailored for datasets with all genomic features evaluated in the original model (Chapuy et al., Reddy et al., Schmitz et al.) and one tailored for datasets lacking genotypic data for all class-defining genes (Esfahani et al., 2019) (Figure S2D,E; STAR Methods). Both models achieved reasonable classification performance via 10-fold cross-validation (80% and 74%, respectively, Figure S2D,F). Applied to the DLBCL datasets in this work, three B cell states were modestly but reproducibly enriched in distinct Chapuy et al. classes: S1 in C3, S4 in C1, and S5 in C5 (Figure S2H and Table S2).
Despite the lack of strong concordance between B cell states and mutational classes (Figures 2D,E and S2G,H), all five states stratified survival (Figure 2F). Moreover, consistent with expectations, states with the most robust COO enrichments (S1 and S5) predicted favorable (S1) and adverse (S5) outcomes in univariable survival models (Figure 2G). Importantly, several states also predicted OS after multivariable adjustment for COO, LymphGen, or C1-C5 classes, including state S5, an ABC-enriched state, and state S2, a phenotype with mixed COO representation (Figure S2I).
Clinically Distinct Developmental Trajectories of DLBCL B Cells
To characterize each B cell state, we next performed a comparative analysis against normal B cell phenotypes. We first asked whether all five states were recoverable in normal B cells isolated from human lymph nodes, using marker genes defined from DLBCL tumors. Indeed, in scRNA-seq profiles of healthy tonsils (n = 10) and reactive lymph nodes (n = 9), all five states were detectable (Figure 3A). Next, we expanded our marker gene list through integration of EcoTyper states with lymphoid scRNA-seq data (Figure 1D, Table S1). We then compared each state to previously defined tonsillar B cell phenotypes (Holmes et al., 2020). We observed specificity of S1 for germinal center (GC) B cells, S2 and S3 for pre-memory B cells, S4 and S5 for pre-plasmablasts, and S4 for light zone B cells (Figure 3B,C). Each state also showed characteristic lineage markers, with S1 showing specificity for B cell follicles in a normal human lymph node, supporting these annotations (Figures 3C, S2J, and S3A).
Figure 3. Developmental Ontogeny of DLBCL.

(A) Expression of DLBCL B cell state-specific marker genes (same as Figure 2A) in healthy lymphoid B cells profiled by scRNA-seq (tonsils, n = 10; reactive lymph nodes, n = 9). Expression values are averaged by sample. (B) Comparison of DLBCL B cell states defined by EcoTyper (rows) with normal tonsillar B cell phenotypes profiled by scRNA-seq (columns) (Holmes et al., 2020). Enrichment was determined by pre-ranked gene set enrichment analysis (STAR Methods). (C) Lineage marker expression in B cells from six lymphoid scRNA-seq datasets (Figure 1D) classified into DLBCL B cell states. The size and color of each bubble represent the relative expression of each state and the proportion of scRNA-seq datasets that show higher expression in the indicated state, respectively. GC, germinal center. (D) Differentiation status of DLBCL B cell states (CytoTRACE) in tonsillar B cells profiled by scRNA-seq. Data are presented as boxplots (center line, median; box limits, upper and lower quartiles; whiskers, largest and smallest values within 1.5×IQR of the box limits; IQR, interquartile range). Significance was assessed relative to S1 by a two-sided Wilcoxon rank sum test. diff., differentiation. (E) BCR clonotype status and B cell copy number profiles from DLBCL tumors profiled by scRNA-seq. Malignant B cells (rows) are organized by B cell state, with genes (columns) ordered by chromosomal location. (F) Low-dimensional embedding of normal tonsillar B cells, shown according to the expression of metagenes capturing two axes of normal development (STAR Methods). CytoTRACE scores (panel D) are shown for each cell. (G) Model of DLBCL development, as informed by EcoTyper. (H) Bottom: Projection of DLBCL B cells onto the same transcriptional embedding from F. Point size reflects the number of DLBCL cells (density). Top: Model from G showing the cell state distribution of each sample, with states colored as in C and with opacity proportional to each state’s relative abundance. See also Figure S3.
Healthy B cells exhibit stereotypical maturation states as they undergo affinity maturation in germinal centers that emerge within B cell follicles of secondary lymphoid tissue during an adaptive immune response. The antigen-activated GC B cells proliferate and undergo somatic hypermutation in the dark zone, undergo selection in the light zone, and after several rounds between light and dark zone, differentiate into memory B cells or plasmablasts. To determine whether DLBCL B cell states recapitulate this normal trajectory, we applied CytoTRACE to predict developmental orderings based on single-cell transcriptional diversity (Gulati et al., 2020). After confirming that CytoTRACE could correctly order seven tonsillar B cell phenotypes (Figure S3B), we applied it to tonsillar B cells classified into the five EcoTyper states. As expected, S1 (GC-like) was predicted to be least differentiated while the remaining states were predicted to be more differentiated (Figure 3D). Accordingly, we hypothesized that malignant B cells might display a similar hierarchy.
Several lines of evidence from bulk tumors indicate that GCB DLBCL originates in GC B cells (Alizadeh et al., 2000; Basso and Dalla-Favera, 2015). However, it remains unclear whether ABC DLBCL arises in plasmablast precursors (Basso and Dalla-Favera, 2015), memory B cell precursors (Holmes et al., 2020; Venturutti and Melnick, 2020), or in a less mature progenitor (Green et al., 2014). To investigate DLBCL development with single-cell precision, we integrated EcoTyper states with paired scRNA-seq and scVDJ-seq profiles of four de novo DLBCL tumors (three ABC and one GCB). We then imputed genome-wide copy number variants (CNVs) and cross-referenced cellular barcodes with immunoglobulin VDJ repertoires. The latter were concordant with those determined by targeted DNA sequencing (Figure S3C, left). Moreover, in all four DLBCL specimens, we detected a single dominant BCR clonotype by scVDJ-seq that was consistent with malignant cells identified by copy number analysis (Figure 3E). Additionally, in three tumors for which we performed clonoSEQ®, the dominant clone determined by scVDJ-seq aligned with 100% identity to the dominant CDR3 sequence detected by clonoSEQ® (Figure S3C, right).
In the GCB tumor, malignant cells were remarkably widespread, with representation across all states including state S1 (Figure 3E, top). However, in the three ABC specimens, malignant cells were distributed throughout S2–S5, but were largely absent from S1 (Figures 3E (bottom) and S3D). In three additional DLBCL tumors profiled by scRNA-seq, S1 was also detectable in GCB (n = 2) but not ABC (n = 1), while the remaining states were present in nearly every tumor (Figure S3D). We observed the same pattern in 1,133 bulk tumors revealing the conspicuous depletion of S1 from ABC-like tumors, but evidence of the remaining four states in nearly all DLBCL tumors (Figure S3E). Importantly, state-specific subclones were not apparent in any tumor, indicating that B cells may continue to differentiate after neoplastic transformation (Figures 3E and S3D).
Collectively these data are consistent with a “wishbone” model in which GCB DLBCL tumors arise in S1 while ABC DLBCL tumors largely arise downstream of S1 but upstream of cells committed to GC-derived memory B cell or plasmablast lineages (Figure 3F,G). Notably, this model represents a pseudotime ordering and does not imply that that pre-memory B cell and plasmablast lineages differentiate simultaneously from GC precursors. Moreover, some B cell phenotypes can exhibit developmental plasticity (Mesin et al., 2020), underscoring the possibility of alternative trajectories. Nevertheless, when visualized along two axes of normal B cell development, malignant B cell transcriptomes organized along a wishbone structure consistent with their predicted ontogeny, their state representation, and their COO status (Figure 3F–H). Together these findings further clarify the COO hierarchy underlying the GCB/ABC dichotomy and yield insights into the initiation and pathogenesis of DLBCL.
Composition and Prognostic Atlas of the DLBCL Tumor Microenvironment
Previous studies have explored inflammatory and stromal gene expression signatures in DLBCL (Lenz et al., 2008; Monti et al., 2005), however none has systematically charted the cellular diversity and clinical relevance of TME states in DLBCL. With EcoTyper, we identified 39 TME cell states from 12 major immune and stromal lineages in DLBCL (Figure 4A). To assess reproducibility, we interrogated each state in six lymphoid scRNA-seq datasets using reference-guided annotation and permutation testing (Figure 4B). Among cell types with >200 cells in at least one lymphoid scRNA-seq dataset, 21 of 24 TME states (88%) were reliably recoverable (Table S3). To extend this analysis to cell types with inherently sparse representation, we also considered scRNA-seq data generated from diverse other tumor types (Figure S1C). Leveraging these data, 14 additional TME states were significantly detectable, resulting in a total recovery rate of 91% (40 of 44 evaluable states, including B cells; Table S3).
Figure 4. Composition and Prognostic Atlas of the DLBCL Tumor Microenvironment.

(A) UMAP plots of TME cell states in the DLBCL discovery cohort. Every point represents a cell type-specific GEP classified by its most abundant cell state. The number of states per cell type is provided in parentheses. (B) Relative expression of state-specific marker genes for all evaluated T cell types in the discovery cohort (left) and in six lymphoid scRNA-seq datasets (right). Mean log2 expression is shown for each cell state and dataset. (C) Cell state-specific survival associations in four DLBCL cohorts (Figure 1B, Table S3). TME and B cell state labels are contrasted by black and gray text, respectively. See also Figure S4.
As further validation, we applied EcoTyper to perform de novo state discovery in two independent lymphoma datasets (Newman et al., 2019; Reddy et al., 2017). Remarkably, the majority of the TME states were successfully rediscovered in these experiments, despite significant differences in platforms, tissue preservation, and tumor histology. Specifically, cell state rediscovery rates were high in both datasets, including in FFPE DLBCL tumor specimens (82% of states reidentified) and microarray GEPs of fresh/frozen FL tumors (66% of states reidentified) (Figure S4A–C). Moreover, the atlas was generally more specific for the TME of lymphomas than for solid tumors or healthy tonsillar tissue, as demonstrated by the significance of cell state recovery in scRNA-seq data (Figure S4D).
Next, we examined state-specific survival associations (Figure 4C). As observed for B cells, the majority of TME states were significantly prognostic in univariable models (Figure 4C), with consistent trends observed across cohorts (Figures 4C and S4E). In addition, over 40% remained significant after multivariable adjustments for known molecular subtypes (Figure S4F; Table S3). All TME cell types harbored states with reciprocal survival associations, highlighting context-dependent heterogeneity in clinical outcomes. Importantly, while malignant B cells were most associated with higher risk of death (B cell state S5), eight TME cell states were found to dominate favorable outcomes (Figure 4C). Of these eight states, seven remained significant after multivariable adjustment for COO, LymphGen, or C1-C5 subtypes, including monocytes/macrophages S2 (M1-like) and CD4 T cells S3 (naive), which surpassed other states after controlling for COO status (Figure S4F,G; Table S3). Together these data demonstrate considerable diversity in the DLBCL TME and emphasize the capacity of non-malignant cells to shape DLBCL clinical trajectories.
Cellular Composition and Community Structure of ABC and GCB DLBCL
COO status is a key determinant of survival in DLBCL, yet its relationship to context-dependent phenotypic states within the broader DLBCL TME remains obscure. To systematically dissect the TME of ABC and GCB DLBCL, we next analyzed 1.6k bulk tumors and scRNA-seq profiles of seven de novo DLBCL tumors where COO labels were known. In bulk tumors analyzed by EcoTyper, we identified patterns of COO-specific variation in CD8 T cells, CD4 T cells, follicular helper T cells, Tregs, and macrophages (Figure 5A, left). For example, state S3 of monocytes/macrophages, which shows an M2-like expression program (Figure S5A), was most prevalent in ABC DLBCL, whereas state S2 of Tregs, which is metabolically-active (Figure S5B), was most frequent in GCB DLBCL (Figure 5A). Such enrichment patterns were conserved in scRNA-seq data after assigning cells to EcoTyper states (Figure 5A, right), yet were challenging to directly detect in scRNA-seq data by unsupervised analysis (Figure S5C,D), in line with a recent report (Roider et al., 2020). Finally, as expected, TME states enriched in ABC or GCB DLBCL were associated with adverse or favorable outcomes, respectively (Figure 5B).
Figure 5. The Tumor Microenvironment of ABC and GCB DLBCL.

(A) Average composition of cell states in ABC versus GCB DLBCL, shown for bulk tumors decoded by EcoTyper (‘Bulk GEPs’) and seven de novo DLBCL tumors profiled by scRNA-seq. scRNA-seq data were assigned to EcoTyper states without prior knowledge of COO (STAR Methods). Significance was assessed by a Fisher’s exact test. Only cell types detected in scRNA-seq profiles of DLBCL tumors were analyzed (Figure S1C). (B) OS curves for selected cell states enriched in ABC or GCB DLBCL. Patients were stratified by assigning each tumor to its most prevalent state per cell type (blue, ABC-enriched state; orange, GCB-enriched state). (C) Co-occurrence patterns of cell states with significant enrichment in ABC or GCB tumors profiled in the discovery cohort. Co-occurrence was calculated using the Jaccard index adjusted for statistical significance (STAR Methods). (D) Differences in OS for cellular communities defined in C. All four DLBCL cohorts were analyzed in B,D. Significance in B,D was determined by a two-sided log-rank test. See also Figure S5.
We next wondered if TME states exhibit common phenotypic programs linked to cell-of-origin of neoplastic B cells. Among T cell states enriched in ABC DLBCL, we observed widespread overexpression of co-stimulatory and co-inhibitory molecules in tumor-infiltrating T cells profiled by scRNA-seq (Figure S5E). Several of these genes were broadly expressed in distinct T cell lineages, including LAG3, a canonical marker of T cell exhaustion, and TNFSRF4 (OX40), a costimulatory receptor and emerging therapeutic target in lymphoma and solid neoplasms (Sagiv-Barfi et al., 2018) (Figure S5C). In contrast, T cells associated with GCB DLBCL were generally deficient in immunomodulatory molecules (Figure S5E). Thus, T cell states exhibit fundamental differences in ABC and GCB DLBCL with potential implications for immunotherapy targeting.
To further delineate the substructure of ABC and GCB DLBCL, we next explored co-association patterns among their constituent cell states (Figure 5C). Unsupervised clustering of cell-state abundance patterns in the discovery cohort revealed distinct subgroups within ABC DLBCL (n = 4) and GCB DLBCL (n = 3) (Table S3). Such groupings readily subdivided COO classes into cellular ecosystems with unique clinical outcomes (Figure 5D) and were conserved in held-out tumors (Figure S5F).
De Novo Reconstruction of Multicellular Ecosystems in DLBCL
Having demonstrated community structure in DLBCL subtypes, we next repeated our analysis agnostic to COO. For this purpose, we employed a clustering procedure in which cell states are assembled into communities that maximize co-association patterns (STAR Methods). Applying this approach to the discovery cohort, EcoTyper revealed nine multicellular ecosystems in DLBCL, which we termed lymphoma ecotypes (LEs) (Figure 6A,B; Table S4).
Figure 6. Landscape of Cellular Ecosystems in DLBCL.

(A) Cell state abundance patterns in the discovery cohort, with cell states organized into nine lymphoma ecotypes (LEs) and tumor samples (columns) ordered by the most abundant LE per sample. Only tumors assigned to LEs are shown (n = 473). (B) LE-specific cell states. Edge thickness denotes co-association strength as quantified by the Jaccard index. (C) Characteristics of LEs across four DLBCL cohorts. Top: Univariable associations with OS. Center: Estimated cell type composition of tumors classified into LE-specific subgroups on the basis of the most prevalent LE per sample. Relative abundance is shown averaged per LE subgroup and scaled from 0 to 1. Bottom: Enrichment of molecular subtypes in each LE subgroup (defined as above), calculated as described in STAR Methods. See also Figure S6.
LEs varied substantially in their number of constituent cell states (Figure 6B), harbored extensive heterotypic ligand-receptor interactions predicted by CellPhoneDB (Efremova et al., 2020) (STAR Methods), and were distinguishable by clinical, cellular, and genetic features (Figure 6C). In addition, LEs were detectable in >1,000 independent DLBCL tumors, underscoring their robustness (Figure S6A). Across datasets, 89% (8 of 9) of LEs were significantly prognostic (Figure 6C) and most remained prognostic after multivariable adjustment for previously defined subtypes, emphasizing their distinctiveness (Figure S6B; Table S4). Moreover, LEs outperformed direct NMF clustering of bulk tumor expression data for predicting OS and were preferentially selected in stepwise survival models incorporating existing molecular subtypes (Figure S6C,D,F). LEs were also largely independent of four recently described TME subtypes in DLBCL (Kotlov et al., 2021) and were likewise favored in stepwise survival models (Figure S6B,E,F).
To facilitate interpretation, we organized and labeled LEs by their associations with outcome. Among LEs with adverse prognosis, LEs 1, 2, and 3 were most significant and distinguished by cellular communities linked to ABC DLBCL (LE1 and LE2) and double-hit lymphoma (LE3). In contrast, LE4-high tumors were ABC-enriched, B cell-depleted, and characterized by immunoreactive T cell states (CD8 S4, CD4 S2, Treg S4) with widespread expression of co-inhibitory and stimulatory molecules (Figures 6C, S5E, and S6G). While LE5 was not prognostic, its underlying cell states were more prevalent in healthy lymphoid tissues, reflecting a normal-enriched cellular community (Figure S6H). In line with this, the component states of LE5 showed evidence of spatial co-localization in a normal human lymph node specimen profiled by spatial transcriptomics, with the same also being true for other LEs with evidence of normal enrichment (Figure S6I–K).
Among LEs with favorable prognosis (LE6–LE9), LE8-high tumors were uniquely enriched for GCB lymphoma and its related genotypic lesions (EZB, ST2, C3, and double-hit lymphomas). In contrast, LEs 6, 7, and 9 were generally independent of molecular subtypes but were elevated in tumors with high stromal content (Figures 6C and S6G). Previous studies have tied stromal cell signatures, such as Stromal-1 (Lenz et al., 2008), to superior outcome in DLBCL. However, the cellular composition of such signatures is incompletely understood. With EcoTyper, we resolved Stromal-1 into distinct phenotypic programs and LE classes (Table S4). For example, we found that LAMA4 marks tumor-associated endothelial cells in LE7 whereas POSTN and THBS2 mark cancer-associated fibroblasts in LE9 (Table S4). Intriguingly, LE9 was not only enriched in fibroblasts and other TME elements – it was also highly predictive of longer survival time (P < 10−6, Figure 6C). In fact, LE9 outperformed GC-like B cells and its associated ecotype (LE8) in prognostic significance (Tables S3 and S4).
Collectively, these data reveal extensive multicellular community structure in DLBCL and provide a rich resource for hypothesis generation and future investigation.
Prediction of Therapeutic Benefit with DLBCL EcoTyper
While a variety of risk indices in DLBCL patients have been described, including IPI, COO, genetic subtype, and others, such biomarkers do not currently guide DLBCL treatment selection at diagnosis. Given EcoTyper’s ability to quantitate predefined cell states and cellular ecosystems in external datasets, we next explored its utility for predictive biomarker discovery in the context of a randomized clinical trial.
The REMoDL-B phase III trial tested whether bortezomib added to standard therapy (RB-CHOP arm) could improve progression-free survival (PFS) in patients with treatment-naïve DLBCL over standard therapy alone (R-CHOP arm) (Davies et al., 2019). While pre-clinical and early clinical studies suggested that proteasome inhibition with bortezomib selectively targets NF-κB signaling in ABC DLBCL, RB-CHOP failed to improve survival regardless of COO subtype (Davies et al., 2019). To determine whether EcoTyper might inform clinical benefit from RB-CHOP, we enumerated all 44 DLBCL states in microarray profiles of 928 FFPE DLBCL tumors from this trial (Figure 7A). For each state, we then calculated univariable survival associations, represented as z-scores, between OS and cell-state abundance within each arm (Figure S7A). We then rank-ordered each state by an algorithm that considers both the magnitude and direction of OS associations in both arms (Figure S7A,B). The resulting metric, which we termed adjusted OS z-score, assigned higher values to states that predict a greater therapeutic benefit from RB-CHOP than R-CHOP (Figures 7B and S7A,B).
Figure 7. Prediction of Response to Bortezomib in DLBCL.

(A) Outline of the approach. (B) Association between cell states and therapeutic benefit from RB-CHOP relative to R-CHOP. Cell states were ranked by an adjusted OS z-score that penalizes associations with OS in R-CHOP (Figure S7A,B). LE-specific cell states were tested for their association with benefit from RB-CHOP via pre-ranked gene set enrichment analysis. (C) Expression of positive and negative marker genes of CXCR5+ CD8 T cells, shown for lymphoma-associated T cells profiled by scRNA-seq and mapped to EcoTyper states (Figure S1C, Table S1). Bubble size represents the mean log2 expression of each gene, normalized from 0 to 1, while color represents the fraction of tumors with higher expression in the indicated state. Only CD8 T S1 showed significant overlap with known CXCR5+ CD8 T cell markers (STAR Methods). (D) Localization of genes marking follicles in a normal human lymph node profiled by spatial transcriptomics (ST). (E) Relative distance of each CD8 T cell state from spots annotated as follicles in the ST array (panel D). Data are presented as boxplots (center line, median; box limits, upper and lower quartiles; whiskers, largest and smallest values within 1.5×IQR of the box limits; IQR, interquartile range). Significance was assessed using a two-sided Wilcoxon rank sum test. (F) Differences in OS for patients stratified by treatment arm and by groups with high or low levels of T cell CD8 S1 (median split). (G) Same as F but showing patients with high T cell CD8 S1 content stratified by COO and treatment arm. Significance in C,D was assessed by a two-sided log-rank test. For panels E, F and G: *P < 0.05; ****P < 0.0001. See also Figure S7.
Across 44 ranked states, CD8 T cell S1 was most significantly associated with therapeutic benefit from RB-CHOP (P = 0.004 and Q = 0.04; Figures 7B and S7A). Moreover, among lymphoma ecotypes, LE5 (the parent ecotype of CD8 T cell S1) was significantly enriched among top-ranking states (P = 0.009 and Q = 0.09, GSEA), implying a community-level response phenotype (Figure 7B). Importantly, this phenotype was not prognostic, as confirmed in ~1.3k independent DLBCL patients treated with R-CHOP alone (Figures 4C and 6C) but was instead predictive of a specific therapeutic benefit from bortezomib. Moreover, these results were robust to patient selection parameters (Figure S7C).
Across scRNA-seq profiles of lymphoid tumors (Figure S1C; Table S1), CD8 T cell S1 expressed higher levels of CXCR5 than other CD8 T cell states (top 1.2% of S1-enriched genes by log2 fold change). CXCR5 is known to mark stem-like CD8 T cells with tissue-resident characteristics and robust effector potential in solid tumors (Brummelman et al., 2018). Moreover, CXCR5+ CD8 T cells have been reported to reside within B cell follicles and possess antitumor activity in follicular lymphoma (Chu et al., 2019; Valentine and Hoyer, 2019). Consistent with these findings, known marker genes of CXCR5+ CD8 T cells (Brummelman et al., 2018) were significantly concordant with the CD8 T cell S1 expression profile, but not other CD8 T cell states (Figure 7C). Furthermore, when considering their spatial distribution in a normal human lymph node profiled by spatial transcriptomics, CD8 T cell S1 rich zones localized significantly closer to B cell follicles than did other CD8 T cell states (Figure 7D,E). Thus, by transcriptomic and spatial characterization, these data link CD8 T cell S1 to a previously described CXCR5+ CD8 T cell state.
To explore the utility of CD8 T cell S1 as a potential biomarker, we simulated a trial in silico, wherein patients harboring high levels of CD8 T cell S1 (above the median) would be selected for randomization. Remarkably, patients in the RB-CHOP arm showed significantly longer survival than R-CHOP, both for OS and PFS (Figures 7F and S7D). Furthermore, when patients were stratified by COO status, the predictive effect was limited to ABC DLBCL (Figure 7G).
Collectively, these results implicate CXCR5+ CD8 T cells in RB-CHOP efficacy and underscore the promise of EcoTyper for systematic identification of cell states and multicellular communities predictive of clinical outcomes.
Discussion
High-resolution characterization of the tumor microenvironment has the potential to revolutionize cancer diagnostics and treatment. However, unbiased methods to delineate context-specific cell states and ecosystems at scale are lacking. Here, we show that a genomic view of the TME in a common blood cancer can bring clarity to its biological and clinical heterogeneity. This insight was made feasible by an original approach for systematically resolving not only the contributions of diverse tumor cell states that have been previously unrecognized, but also by the tendency of these states to form stereotyped ecosystems.
The role of perturbations in the tumor microenvironment has been intensively studied over the last two decades, including in Hodgkin lymphoma, where infiltrating immune cells far outnumber malignant B cells (Aoki et al., 2020; Steidl et al., 2010), and in follicular lymphoma, where spatial partitioning, morphological features, and gene expression profiling have enabled their study (Alvaro et al., 2006; Canioni et al., 2008; Dave et al., 2004; Glas et al., 2007). While several studies have also tried to address the contribution of the TME to DLBCL (Lenz et al., 2008; Roider et al., 2020), as with most human cancers, efforts to characterize TME states have been limited in their scale, scope, and depth.
Digital cytometry techniques, including established and emerging strategies for deconvolution of nucleic acid admixtures (Cieślik and Chinnaiyan, 2018; Finotello et al., 2019), are complementary to scRNA-seq and other single-cell modalities. They offer a marker-agnostic window into cellular heterogeneity without tissue dissociation, which can disrupt cell representation and expression (Newman et al., 2019; Segerstolpe et al., 2016; van den Brink et al., 2017), and are readily scalable to massive datasets. While recent deconvolution techniques have relied on a static collection of single-cell reference profiles to dissect bulk tissue composition (Liu et al., 2019), here we demonstrate an inversion of this “bottom-up” paradigm, in which cell type-specific transcriptional states and their co-association patterns are learned and quantified directly from intact tissue specimens in a “top-down” approach. Advantages of this framework include its applicability to the discovery, characterization, and clinical assessment of cellular heterogeneity in large, well-powered patient cohorts, and its ability to interface between bulk and single-cell expression platforms, leveraging the strengths of both modalities while mitigating their weaknesses.
The results of this work have important implications for DLBCL beyond the identification of TME-informed subgroups that stratify survival after treatment with standard immunochemotherapy regimens. For example, more than a dozen randomized studies over the last two decades have been unsuccessful in further improving outcomes by the addition of novel agents to R-CHOP. In a recently completed randomized study of newly diagnosed DLBCL patients, the addition of the proteasome inhibitor bortezomib to R-CHOP failed to show clinical utility (Davies et al., 2019). Nevertheless, when reexamining patients from this study, we identified a specific DLBCL subgroup that appears to benefit from the addition of bortezomib. Intriguingly, this subset was best identified not by the signatures of malignant B cells, but by their unique TME (i.e., LE5), especially by the prevalence of a distinct CD8 T cell state. Thus, despite the proven utility of proteasome inhibition in the treatment of other lymphoid neoplasms when relying on COO status (Richardson et al., 2005; Robak et al., 2015), our results suggest a patient selection strategy for future bortezomib trials in DLBCL. Moreover, as demonstrated by the successful application of EcoTyper to deconvolve >1,500 GEPs of FFPE tumor specimens (Figures 1B and 7), we expect the same approach will generalize to diverse settings, including emerging therapies leveraging T cells, macrophages, NK cells, and other immune effector populations (Advani et al., 2018; Chao et al., 2010; Neelapu et al., 2017). Thus, EcoTyper has potential for broad application in clinical diagnostics, especially given the increasingly widespread availability and practical cost of bulk sequencing.
Although the results of this study reclassify DLBCL on the basis of cell states and ecosystems, future studies will be needed to further characterize the spatial topology and interactions within LEs and the molecular switches that mediate therapeutic responsiveness and resistance in DLBCL. For example, while a CXCR5+ CD8 cell state has been recently implicated as having anti-tumor activity in a related B cell neoplasm (Chu et al., 2019), and while bortezomib has known immunomodulatory anti-tumor effects on T cells (Sun et al., 2004), the precise mechanism for the activity of bortezomib remains unclear.
In summary, this systems-level portrait of tumor cellular states and ecosystems provides a unique perspective on DLBCL heterogeneity. We anticipate that this framework will prove useful for the development of cancer therapeutics by unmasking the cellular elements that contribute to therapeutic response and resistance from fresh, frozen, and fixed clinical biospecimens. Our study also identifies DLBCL subgroups that differentially express modules composed of hundreds of genes, many of which are expected to contribute to the malignant behavior of tumor cells and their surrounding ecosystems. Collectively, these results expand our understanding of cellular organization in DLBCL with implications for the development of biomarkers and individualized therapies.
STAR Methods
RESOURCE AVAILABILITY
Lead Contact
Further information and requests for resources should be directed to and will be fulfilled by the Lead Contact, Ash A. Alizadeh (arasha@stanford.edu).
Materials Availability
This study did not generate new unique reagents.
Data and Code Availability
Single-cell RNA-seq data have been deposited at GEO and are publicly available as of the date of publication. The accession number is listed in the key resources table. This paper also analyzes existing, publicly available data. These accession numbers for the datasets are listed in the key resources table.
The original code for EcoTyper is available as of the date of the publication for non-profit academic use. The DOI is listed in the key resources table. Updates to the code will be available at https://ecotyper.stanford.edu/lymphoma.
Any additional information required to reanalyze the data reported in this paper is available from the lead contact upon request.
KEY RESOURCES TABLE.
| REAGENT or RESOURCE | SOURCE | IDENTIFIER |
|---|---|---|
| Antibodies | ||
| Brilliant Violet 605™ Anti-Human CD19 Antibody | BioLegend | Cat# 363023, RRID:AB_2564252; Cat# 363035, RRID:AB_2632786 |
| APC-H7 Mouse Anti-Human CD20 | BD Biosciences | Cat# 641396, RRID:AB_1645724 |
| LIVE/DEAD™ Fixable Aqua Dead Cell Stain Kit | Thermofisher | Cat# L34965 |
| 7-AAD Viability Staining | BioLegend | Cat# 420404 |
| Biological samples | ||
| Fresh or frozen surgical biopsies of DLBCL, FL and tonsil samples | This paper | N/A |
| Critical commercial assays | ||
| clonoSEQ® | https://www.clonoseq.com/ | N/A |
| Chromium Single Cell 5’ Library & Gel Bead Kit, 16 rxns | 10x Genomics, Pleasanton, CA | Prod# 1000006 |
| Chromium Single Cell 5’ Library Construction Kit, 16 rxns | 10x Genomics, Pleasanton, CA | Prod# 1000020 |
| Chromium Single Cell V(D)J Enrichment Kit, Human B Cell, 96 rxns | 10x Genomics, Pleasanton, CA | Prod# 1000016 |
| Chromium Single Cell A Chip Kit, 48 rxn | 10x Genomics, Pleasanton, CA | Prod# 1000152 |
| Chromium i7 Multiplex Kit | 10x Genomics, Pleasanton, CA | Prod# 120262 |
| Chromium Next GEM Single Cell 5’ Library & Gel Bead Kit v1.1, 16 rxns | 10x Genomics, Pleasanton, CA | Prod# 1000165 |
| Chromium Next GEM Chip G Single Cell Kit, 48 rxns | 10x Genomics, Pleasanton, CA | Prod# 1000120 |
| Single Index Kit T Set A, 96 rxns | 10x Genomics, Pleasanton, CA | Prod# 1000213 |
| Deposited data | ||
| DLBCL, FL and tonsil scRNA-seq | This paper | GEO: GSE182436 |
| Lymphoma and reactive lymph node samples scRNA-seq | Roider et al. (2020) | https://heidata.uni-heidelberg.de/dataset.xhtml?persistentId=doi:10.11588/data/VRJUNV |
| FL scRNA-seq | Andor et al. (2019) | Correspondence with authors |
| FL scRNA-seq | Zhang et al. (2019) | https://zenodo.org/record/3594331#.X42xh5Mzbxg |
| Reactive lymph node samples scRNA-seq | Aoki et al. (2020) | EGA: EGAS00001004085 |
| Tonsil samples scRNA-seq | King et al. (2021) | ArrayExpress: E-MTAB-8999 |
| DLBCL bulk-tissue RNA-seq | Schmitz et al. (2018) | https://gdc.cancer.gov/about-data/publications/DLBCL-2018 |
| DLBCL bulk-tissue RNA-seq | Ennishi et al. (2019) | EGA: EGAD00001003783 |
| DLBCL bulk-tissue RNA-seq | Reddy et al. (2017) | EGA: EGAD00001003600 |
| DLBCL bulk-tissue microarray | Chapuy et al. (2018) | GEO: GSE98588 |
| Bulk FL microarray samples | Newman et al. (2019) | GEO: GSE127472 |
| DLBCL microarray samples from the REMoDLB trial | Sha et al. (2019) | GEO: GSE117556 |
| Human lymph node Visium dataset (Space Ranger 1.0.0) | 10x Genomics | https://support.10xgenomics.com/spatial-gene-expression/datasets/1.0.0/V1_Human_Lymph_Node |
| Human reference genome NCBI build 38, GRCh38 | Genome Reference Consortium | http://www.ncbi.nlm.nih.gov/projects/genome/assembly/grc/human/ |
| BrainArray (v23) | Dai et al. (2005) | http://brainarray.mbni.med.umich.edu/Brainarray/Database/CustomCDF/CDF_download.asp#v23 |
| LM22 signature matrix (CIBERSORTx) | Newman et al. (2015) | N/A |
| TR4 signature matrix (CIBERSORTx) | Newman et al. (2019) | N/A |
| Software and algorithms | ||
| EcoTyper (v1.0) | This work |
https://ecotyper.stanford.edu/
https://doi.org/10.25936/rssb-t744 |
| CIBERSORTx (v1.0) | Newman et al. (2019) | https://cibersortx.stanford.edu/ |
| 10x Genomics Cell Ranger (v2.1, v3.0 and v5.0) | Zheng et al. (2017) | https://support.10xgenomics.com/single-cell-gene-expression/software/downloads/latest |
| 10x Genomics Loupe V(D)J Browser (v3.0.0 and v4.0.0) | 10x Genomics website | https://support.10xgenomics.com/single-cell-gene-expression/software/downloads/latest |
| 10x Genomics Loupe Browser (v4.2.0.0) | 10x Genomics website | https://support.10xgenomics.com/single-cell-gene-expression/software/downloads/latest |
| CellPhoneDB (v2.1.1) | Efremova et al. (2020) | https://github.com/Teichlab/cellphonedb |
| Seurat R package (v2.3.4 and v3.1.3) | Butler et al. (2018); Stuart et al. (2019) | https://cran.r-project.org/web/packages/Seurat/index.html |
| CytoTRACE R package (v0.3.3) | Gulati et al. (2020) | https://cytotrace.stanford.edu/ |
| inferCNV R package (v1.5.0) | Tickle et al. (2019) | http://www.bioconductor.org/packages/release/bioc/html/infercnv.html |
| copynumber R package (v1.12.0) | Nilsen et al. (2012) | https://www.bioconductor.org/packages/release/bioc/html/copynumber.html |
| escape R package (v1.1.1) | Borcherding (2021) | https://bioconductor.org/packages/release/bioc/html/escape.html |
| FNN R package (v1.1.3) | Beygelzimer et al. (2021) | https://CRAN.R-project.org/package=FNN |
| MASS R package (v7.3–53.1) | Venables and Ripley (2002) | https://cran.r-project.org/web/packages/MASS/index.html |
| survival R package (v2.42.3) | Therneau and Grambsch (2000) | https://cran.r-project.org/web/packages/survival/index.html |
| fgsea R package (v1.8.0) | Korotkevich et al. (2021) | https://bioconductor.org/packages/release/bioc/html/fgsea.html |
| metap R package (v1.4) | Dewey (2020) | https://CRAN.R-project.org/package=metap |
| igraph R package (v1.2.2) | Csardi and Nepusz (2006) | https://CRAN.R-project.org/package=igraph |
| umap R package (v.0.2.0.0) | McInnes et al. (2018) | https://cran.r-project.org/web/packages/umap/index.html |
| Other | ||
| ToppFun website | Chen et al. (2009) | https://toppgene.cchmc.org/ |
EXPERIMENTAL MODEL AND SUBJECT DETAILS
Human Participants
All patient samples in this study were collected with informed consent for research use and were approved by the Stanford Institutional Review Board in accordance with the Declaration of Helsinki.
Fresh or frozen surgical biopsies of diffuse-large B cell lymphoma (DLBCL) and follicular lymphoma (FL) tumors were obtained from patients at Stanford University. The tonsil sample was obtained from a patient undergoing tonsillectomy at Agroklinikken (Asker, Norway). Lymphoma samples and tonsils were processed to single-cell suspensions and stored in liquid nitrogen, as previously described (Green et al., 2015).
METHOD DETAILS
Bulk Tumor Expression Datasets
The DLBCL discovery cohort (Schmitz et al., 2018) was downloaded from NCI Genomic Data Commons (https://gdc.cancer.gov/about-data/publications/DLBCL-2018) and normalized to transcripts per million (TPM). Samples from The Cancer Genome Atlas (TCGA) were excluded (n = 40) owing to technical batch effects. The Chapuy et al. validation dataset was obtained from GEO (GSE98588) and raw Affymetrix CEL files were processed using a custom chip definition file from BrainArray (v23) (Dai et al., 2005), as previously described (Newman et al., 2015). The Ennishi et al. validation dataset was obtained directly from the authors as an RNA-seq count matrix and subsequently converted to TPM. The Reddy et al. validation dataset was obtained from the authors as an FPKM-normalized expression matrix and analyzed without further processing (Reddy et al., 2017). COO labels and clinical data were obtained from the corresponding publications. LymphGen annotations from the study by Wright and colleagues (Wright et al., 2020) were used for the discovery cohort and two validation cohorts (Chapuy et al. and Ennishi et al.). C1-C5 subtypes identified by Chapuy et al. were analyzed in the Chapuy et al. dataset using the original class labels. For the discovery cohort (Schmitz et al.) and remaining validation cohorts (Reddy et al., Ennishi et al.), we developed and applied a naïve Bayes classifier, as described in Naïve Bayes Classifier for C1-C5 Subtypes. For the analysis in Figure S4C, bulk follicular lymphoma microarray samples profiled by Affymetrix Human Genome U133 Plus 2.0 were downloaded from GEO (GSE127472) and normalized as previously described (Newman et al., 2019). To identify cellular determinants of response to bortezomib (Figures 7 and S7), we downloaded Illumina DASL array expression data from the REMoDL-B trial (GEO GSE117556) and clinical data from the supplement of (Sha et al., 2019). Individual genes mapping to multiple probes were averaged in log2-space to eliminate redundancy.
scRNA-Seq Datasets
scRNA-Seq Data Generated in This Study
Cell suspensions from de novo DLBCL tumors (n = 4; three ABC-DLBCL and one GCB-DLBCL), FL tumors (n = 3), and a patient with tonsilitis (n = 1) were thawed and analyzed by fluorescence activated cell sorting (FACS). Using two antibody markers specific for B cells, CD19 (BioLegend Cat# 363023, RRID:AB_2564252; BioLegend Cat# 363035, RRID:AB_2632786) and CD20 (BD Biosciences Cat# 641396, RRID:AB_1645724), in addition to a live-dead marker (Aqua live-dead, Thermofisher, Cat# L34965; 7-AAD, Biolegend, Cat# 420404), two mutually exclusive populations (100,000 viable singlets each) were sorted per sample: a CD19+/CD20+ B cell population and a CD19−/CD20− non-B cell population. The sorted populations were resuspended in FACS buffer (phosphate buffered saline with 5 % fetal calf serum blocking buffer) and immediately processed for scRNA-seq library preparation at the Stanford Functional Genomics Facility with the 10x Chromium 5′ kit (10x Genomics, Pleasanton, CA) and the 10x Chromium Single Cell Human BCR Amplification kit, following the manufacturer’s protocol. Sequencing was performed on Illumina HiSeq 4000 and NovaSeq instruments. Samples that were sorted together were multiplexed on the same sequencing lane to avoid technical batch effects, including scRNA-seq and scVDJ-seq of B cells. The resulting scRNA-seq data were processed with CellRanger (version 2.1, 3.0, and 5.0, 10x Genomics) (Zheng et al., 2017) and mapped to the hg38 reference genome. The scVDJ-seq data were mapped to reference “refdata-cellranger-vdj-GRCh38-alts-ensembl-4.0.0”. The final clonotypes were downloaded from the Loupe VDJ browser versions 3.0.0 and 4.0.0 (10x Genomics).
Seurat (versions 3.0 and 4.0) (Butler et al., 2018; Stuart et al., 2019) was used to process and annotate cell types. The Cell Ranger output files for the DLBCL samples were first analyzed to remove low-quality cells. The parameters selected are shown in Table S1. After pre-processing, cell types were annotated in all four samples together (B cells and non-B cell samples for DLBCL007 and DLBCL111), with a clustering resolution parameter of 1.2 and 20 PCA dimensions. This step was repeated for two additional DLBCL samples that were analyzed in a separate batch (DLBCL002 and DLBCL008). Canonical marker genes were used to annotate B cells (MS4A1 and CD79B) and T cells (CD3D and CD3E), with T cells further divided into CD8 T cells (CD8A, CD8B) and CD4 T cells (CD4). Among the latter, follicular helper T cells were defined as the cluster showing highest expression of CXCL13 and regulatory T cells by the highest expression of FOXP3. Myeloid cells were defined by high expression of CD14, FCER1A, and/or FCGR3A and NKs by high expression of GLNY and NKG7 but not CD3D/E. FL and tonsil specimens were analyzed for each sample individually and annotated using the same set of genes listed above. To ensure that samples were processed identically, we loaded the raw CellRanger output files into Seurat along with the cell type annotations obtained in the steps above, removed low quality cells, and saved the count matrix to disk. For visualization (Figures 1C and S5C), individual batches/datasets were merged and integrated with Seurat using IntegrateData. Low quality cells were defined as described above with the exception of a hybrid cluster containing both B cells and CD8 T cells, which we identified following integration and also omitted.
External scRNA-Seq Datasets
To complement the scRNA-seq data generated in this work, we included scRNA-seq data from previous studies spanning diverse lymphoid tissue specimens, including lymphomas, tonsils, and reactive lymph nodes. For each study, we obtained the processed scRNA-seq dataset and author-supplied annotations. The latter were harmonized to match the 13 cell types analyzed with EcoTyper.
The scRNA-seq dataset of Roider and colleagues (Roider et al., 2020) was obtained from heiDATA (accession code VRJUNV). This dataset includes DLBCL, transformed FL (tFL), FL, and reactive lymph node tissue specimens. Myeloid cells were labeled as “Monocytes and Macrophages”, TH as “T cells CD4”, TTOX as “T cells CD8”, TREG as “Tregs”, and TFH as “T cells follicular helper”. B cells annotated as “Healthy B” in tumor samples or B cells profiled from reactive lymph nodes were assigned as “normal”, while the remaining tumor B cells were assigned as “tumor”.
The follicular lymphoma dataset of Andor and colleagues (Andor et al., 2019) was kindly shared by the authors along with cell annotation labels. Cells assigned to “CD14 monocytes” were labeled as “Monocytes and Macrophages”, CD4 populations were labeled as “T cells CD4” with the exception of cells labeled as “CD4 Regulatory T” which were assigned to “Tregs”; CD8 T cell populations and “CD56 NK” populations were labeled as “T cells CD8” and “NK cells” respectively. Both normal and tumor B cells were included, annotated as “B cells”.
The scRNA-seq dataset from Zhang and colleagues (Zhang et al., 2019), which consists of two samples from two FL cases – one with primary FL and progressed FL and one with primary FL and transformed FL – was downloaded from Zenodo (https://zenodo.org/record/3594331#.X42xh5Mzbxg).
The scRNA-seq dataset from Aoki and colleagues (Aoki et al., 2020) was kindly shared by the authors along with corresponding cell annotations. Major lineages from reactive lymph node samples were analyzed in this work (B cells, Tregs, CD4 and CD8 T cells).
The tonsil dataset generated by King and colleagues (King et al., 2021) was obtained from ArrayExpress (accession number MTAB-8999) and cell subsets were labeled as shown in Table S1.
To interrogate cell types profiled by EcoTyper but lacking in lymphoid scRNA-seq datasets, such as fibroblasts and endothelial cells, we included six scRNA-seq datasets from solid tumors (Figure S1C) (Azizi et al., 2018; Lambrechts et al., 2018; Laughney et al., 2020; Lee et al., 2020; Puram et al., 2017; Zilionis et al., 2019), processed and annotated as described in Luca et al. (2021).
A detailed overview of all bulk and scRNA-seq lymphoid tissue datasets, including accession number (if available), number of samples analyzed, data type, and platform, is available in Table S1.
Cell Type-Specific Expression Purification
To determine cell type-specific gene expression profiles of immune and stromal subsets in DLBCL, we used CIBERSORTx, a computational platform for digital cytometry and cell type-specific expression purification (Newman et al., 2019).
Estimation of Cell Type Abundance
The first step of gene expression purification with CIBERSORTx is imputation of cell type proportions in bulk tissue transcriptomes. To interrogate the major cell populations in DLBCL tumors, we applied two previously validated signature matrices encompassing optimized reference profiles for deconvolving human immune and stromal subsets: LM22, a signature matrix consisting of 22 human immune subsets (Newman et al., 2015); and TR4, a signature matrix consisting of epithelial, endothelial, immune and fibroblast populations (Newman et al., 2019). Both matrices have been previously validated for human tumor deconvolution (Newman et al., 2015; Newman et al., 2019) and were additionally validated in this work on lymphoid tissues (below). As LM22 is derived from Affymetrix microarray data and the discovery cohort was profiled by bulk RNA-seq, we applied B-mode batch correction to overcome cross-platform variation when running CIBERSORTx (Newman et al., 2019). No batch correction step was applied when using the TR4 signature to deconvolve tumor samples, as both input files were profiled by RNA-seq. We pooled the 22 LM22 subsets into 11 major lineages: B cells, plasma cells, CD4 T cells, CD8 T cells, regulatory T cells, follicular helper T cells, NK cells, monocytes and macrophages, dendritic cells, neutrophils and mast cells (Table S1). Eosinophils and epithelial cells were excluded from further analysis. The 11 immune populations were normalized to the immune fraction inferred by TR4 and the total fraction of all 13 cell types was normalized to 100% per sample.
To assess cell type enumeration with CIBERSORTx, we created pseudo-bulk gene expression profiles using single-cell transcriptomes obtained from five scRNA-seq atlases covering either lymphoid tissues (n = 4 atlases; Figure S1C) or non-small cell lung cancer tumors (Zilionis et al., 2019). The latter was included to interrogate cell types that were either depleted or not recovered in lymphoid scRNA-seq datasets (e.g., NK cells), and was processed and annotated as described in Luca et al. (2021). For each scRNA-seq dataset, we simulated defined fractions for cell types with representation in at least two lymphoid datasets (Table S1). Using the procedure described in Luca et al. (2021), we sampled cell type fractions from a Gaussian distribution based on their corresponding fractions imputed by CIBERSORTx in the discovery cohort. Negative fractions were set to 0 and the final fractions were renormalized to sum to 1 across all evaluated cell types. Using these cell fractions, we sampled 1,000 cells per dataset with replacement, summed their transcriptomes in non-log linear space into a pseudo-bulk mixture, and normalized the resulting pseudo-bulk mixture to TPM. In total, 100 pseudo-bulk mixtures were created per dataset. Finally, CIBERSORTx was applied to the mixtures with no batch correction. The Pearson correlations of imputed versus ground truth cell proportions are shown in Figure S1D.
High-Resolution Expression Imputation
Once fractional abundance estimates for the 13 cell types were obtained in the discovery cohort, we employed CIBERSORTx to purify cell type-specific gene expression profiles with default parameters. Specifically, we provided the cell fractions as input to the high-resolution gene expression purification module, along with the TPM-normalized expression matrix of the discovery cohort filtered on protein-coding genes (GENCODE v24).
Implementation of EcoTyper for DLBCL
Discovery of DLBCL Cell States
We applied EcoTyper to identify clusters for each cell type-specific expression matrix generated in the Cell Type-Specific Expression Purification step as described in Luca et al. (2021). EcoTyper uses non-negative matrix factorization (NMF) combined with specialized heuristics to simultaneously identify and quantitate transcriptionally-defined cell states in purified gene expression profiles. As part of this process, EcoTyper calculates the cophenetic coefficient for a range of cluster numbers (2 to 20 in this work) to determine the most stable number of cell states per cell type. Following this step, we selected the cluster number closest to a cophenetic coefficient of 0.99, a threshold that was well aligned with the elbow of the curve across all cell types (e.g., Figure S1G). In total, 72 cell states were defined across 13 cell types. EcoTyper applies two filters to remove low-quality cell states. The first filter removes cell states with <10 marker genes (by default). The second filter calculates an adaptive false-positive index (AFI), which removes cell states that are likely to be false positives, thereby improving the positive predictive value of cell state discovery (Luca et al., 2021). As a result, 28 cell states were automatically omitted, resulting in 44 states for downstream analysis, with 2 to 5 states per cell type.
Cell State Quantification
Cell states defined by EcoTyper were quantitated in two ways: (1) as continuous variables, in which each sample was represented as a mixture of cell states, and (2) as discrete variables, in which each sample was assigned to the most abundant cell state per cell type. The former consists of cell type-specific coefficient matrices learned by the NMF framework, normalized to sum to 1 for every sample (Luca et al., 2021).
Cell State Recovery in External Datasets
EcoTyper implements a supervised ‘reference-guided’ annotation framework for recovering, quantitating, and statistically evaluating predefined cell states in external datasets (Luca et al., 2021). In brief, EcoTyper leverages the properties of NMF to apply the learnt model in the discovery cohort to external datasets (Luca et al., 2021). Starting from a gene expression matrix, the cell state recovery framework results in a coefficient matrix for each cell type where each state is represented as a weight. The recovery of individual cell states in external datasets can be statistically evaluated via permutation testing, producing a z-score for each cell state as a measure of statistical confidence (Luca et al., 2021). This framework can be applied to samples profiled by bulk RNA-seq, microarrays, or scRNA-seq.
Using this approach to map single-cell transcriptomes to EcoTyper states, we compared the significance of cell state recovery across various tissue types profiled by scRNA-seq, including tonsils, follicular lymphoma, DLBCL, and solid tumor tissues (Figure S4D). We evaluated cell types for which all states were detected in lymphoid and solid tumor datasets (Figure S1C). For each evaluated cell type, we aggregated the resulting z-scores from each tissue type into meta z-scores across scRNA-seq datasets using Stouffer’s method (Stouffer et al., 1949) (Tables S2 and S3).
Lymphoma Ecotype Identification
EcoTyper implements a community detection algorithm that identifies robust cell state co-association networks, termed ecosystem subtypes or ‘ecotypes’, across tissue samples (Luca et al., 2021). In brief, let A denote a binary matrix with cell states as rows and samples as columns. Entries in Ai,j are set to 1 if cell state i is assigned to sample j by discrete assignment (Cell State Quantitation) and 0 otherwise. A Jaccard index matrix is then calculated for all pairwise combination of cell states within A. Upon generating the Jaccard matrix, a hypergeometric test is run for each pair of cell states, testing the null hypothesis of no overlap. Cell-state pairs for which the null hypothesis cannot be rejected are flagged (P > 0.01) and their Jaccard indices are set to 0. Next, unsupervised hierarchical clustering is applied to the Jaccard index matrix (hclust in the R stats package with complete linkage and Euclidean distance). The optimal number of clusters is determined by silhouette width maximization across a range of values (2 to 25 by default), yielding a discrete set of cellular community networks. To estimate community-level abundance, cell state abundances within each community are averaged. The resulting values are normalized to sum to 1 across all communities in a given sample. To interrogate multicellular communities in external datasets, component cell states are enumerated individually (Cell State Recovery in External Datasets), then averaged by community membership.
Using this approach, we defined multicellular communities specific to ABC and GCB DLBCL in Figure 5. The community detection framework was applied to ABC and GCB cases in the DLBCL discovery cohort, using the ABC and GCB-enriched cell states, resulting in four ABC communities and three GCB communities (Table S3). ABC and GCB samples were assigned to the community with the highest abundance within their respective COO subtype. These seven communities were also interrogated in DLBCL cohorts by first recovering individual cell states (Cell State Recovery in External Datasets), then calculating relative community abundance as described above (Figures 5D and S5F).
We also defined multicellular communities in the DLBCL discovery cohort agnostic to COO status. Silhouette analysis yielded eight clusters as the optimal cluster number. However, as several states within the largest community C showed clear overlap with another cluster, we reanalyzed C by hierarchical clustering. Specifically, we calculated the Pearson correlation between Jaccard indices for each state in C versus all other states in C. We then applied hierarchical clustering (complete linkage and Euclidean distance) and silhouette width maximization to the correlation matrix (range of 2 to 5 clusters), yielding two optimal clusters. Notably, the cell states that comprise these two clusters exhibit nearly opposite associations with OS (LE4 versus LE7 in Figure 6C), supporting their separation. We termed the resulting nine clusters ‘lymphoma ecotypes’ (LEs) (Figure 6).
State-Specific Marker Genes in scRNA-Seq Data
While CIBERSORTx imputes sample-level gene expression profiles for each cell type, the number of detectable genes per cell type is adaptively determined (Newman et al., 2019). To extend the number of marker genes per cell state and to further evaluate the robustness of EcoTyper, we assigned single-cell transcriptomes to EcoTyper-derived cell states using the framework described in Cell State Recovery in External Datasets. For each scRNA-seq dataset, we calculated a score that maximizes the statistical significance, fold change, and consistency of expression across scRNA-seq datasets, as described in Luca et al. (2021). To ensure expression in lymphoid tissues, for cell types with representation in lymphoid datasets (B cells, plasma cells, CD8 T cells, CD4 T cells, Tfh, Tregs, NK cells, monocytes and macrophages), we calculated the score using the lymphoid datasets only. For the remaining cell types (fibroblast, endothelial cells, mast cells, neutrophils), we calculated the score based on solid tumors profiled by scRNA-seq (Table S1). Since dendritic cells were represented in just one lymphoid dataset, both solid tumors and the tonsil scRNA-seq dataset by King and colleagues were used to calculate the top marker genes for dendritic cells. Cell state-specific marker genes were then ranked by the resulting scores (Table S3).
Molecular Subtype Enrichment
For each bulk DLBCL cohort analyzed in this work (Figure 1B, Table S1), we calculated the enrichment of COO, LymphGen, and C1–C5 subtypes in B cell states and LEs (Figures 6C and S2G,H; Table S2). Specifically, for each cohort, we determined the number Ns of samples from a given COO, LymphGen, or C1-C5 subtype assigned to each state (or LE) s. Then, for each at iteration i (of 1,000 iterations), we randomly permuted the cell state/LE assignment labels and recalculated the number of samples from the same subtype assigned to s. Based on this null distribution, we derived a state/LE-specific z-score for each cohort:
Z-scores were converted to p-values and states/LEs with P < 0.05 were considered significantly enriched in a given COO, LymphGen, or C1–C5 subtype. Z-scores were combined into meta z-scores across the four cohorts using Liptak’s method (Lipták, 1958), weighted by the inverse of the square root of number of samples in each cohort. Finally, p-values were adjusted for multiple hypothesis testing using the Benjamini-Hochberg method.
Naïve Bayes Classifier for C1-C5 Subtypes
To classify bulk DLBCL tumors into the C1, C2, …, C5 subtypes reported by Chapuy et al., we implemented a naïve Bayes model using the features that were available for each dataset. We selected naïve Bayes to allow for missing values, particularly for translocations. For each classifier, we first estimated the class-conditional probability (CCP) of each binary-valued feature, , by maximum likelihood, i.e., , where Xk denotes the k-th feature, Y denotes the class label, denotes the number of samples in the training set with label j and mutation in the k-th feature and nj denotes the total number of samples in the training set with label j. With the class-conditional independence assumption, we can then write
This means that for any future sample, we can estimate the sample class-conditional log-likelihood as:
This will then serve as our score for each class j. To avoid introducing spurious bias in labeling, we do not use any class prior probabilities, and therefore the final label is assigned as:
Feature Selection
CCPs were estimated using sample-level genotyping information from Chapuy et al. Two classifiers were trained, ψ1 and ψ2. The first classifier was intended to be the optimal classifier given the feature matrix from Chapuy et al., after removing features with prevalence of less than 2.5% in the non-C0 cases (n = 286 samples). For feature selection, a ‘backward elimination’ was implemented where the impact of each feature on classification performance was assessed using 10-fold cross-validation. To define a metric to eliminate features, we first defined the rank proportion (RP) which is defined as where ri is the rank of the true label in the predicted probabilities from the classifier for sample i and n denotes the number of samples (Reid et al., 2018). We then measured the overall performance by RPavg = 0.9 ∗ RP(1) + 0.1 ∗ RP(2). This led to the selection of 77 features achieving RPavg = 0.86. These features were then used to build the first classifier ψ1, which was applied to the Schmitz et al. and Reddy et al., datasets (Figure S2D).
For the Ennishi et al. dataset, which includes only a subset of features from the original Chapuy et al. model, we omitted the abovementioned feature selection step and used all 63 available features to train the model (55 somatic point mutations, 3 translocations, and 5 copy number aberrations; Figure S2E,F).
Single-Cell Differentiation States
To identify the least and most differentiated cells in DLBCL samples by scRNA-seq, we applied CytoTRACE, a computational method that predicts the relative differentiation status of single cells from scRNA-seq data (Gulati et al., 2020). For the analyses shown in Figures 3D,F and S3B, we applied the CytoTRACE R package (v0.3.3) with default parameters to the scRNA-seq datasets without any prior processing other than that described in scRNA-Seq Datasets. When analyzing tonsils profiled by King and colleagues, we applied CytoTRACE to all 43,650 B cells, including plasmablasts. For display, we selected phenotypes that span the developmental spectrum of phenotypes imputed for B cell states S1 through S5 (Figure S3B), ranging from germinal center B cells to plasmablasts and memory B cells. For Figure 3D,F, we applied CytoTRACE to single-cell transcriptomes of tonsillar B cells from King et al. after assigning individual cells to EcoTyper-derived cell states (Cell State Recovery in External Datasets).
Copy Number Analysis and B Cell Clonotypes
We applied inferCNV (v1.5.0), an R package to identify large-scale chromosomal copy number variation in scRNA-seq data (Tickle T, 2019), to detect B cells and cell states that show evidence of copy number changes in lymphoid tumors profiled by scRNA-seq. As InferCNV requires a normal reference, for 3 of 4 DLBCL samples profiled by scVDJ-seq in this work, we leveraged BCR clonotypic data to distinguish tumor and normal B cells, selecting cells with the non-dominant clonotype as a normal reference. For the fourth scRNA-seq sample profiled by scVDJ-seq (DLBCL008), for which only one cell with non-dominant clone was identified, and for the DLBCL samples profiled by Roider et al. (Roider et al., 2020), for which BCR clonotype data were not available, we used tonsil and reactive lymph node samples as a normal reference, respectively (Figure S3D).
Genome-Wide Copy Number Profiling
To identify copy number variants (CNVs) shown in Figure S3C, we utilized both the on- and off-target reads from CAPP-Seq performed on genomic tumor DNA as previously described (Chabon et al., 2020). Briefly, sequencing libraries are made from tumor DNA and captured and sequenced on an Illumina HiSeq4000 with 2×150bp reads. Reads were then mapped to the human genome (build hg19), with ~60–80% of reads falling in the targeted genomic coordinates (“on-target reads”). The remaining 20–40% of reads consist predominantly of reads that map to the remainder of the human genome (“off-target reads”). Both on- and off-target reads are considered separately, with on-target read-depth quantified as position-level depth and off-target depth quantified as read-count in 100kb bins. Raw depths are then normalized by (1) normalization to the median, (2) GC correction by LOESS, and (3) normalization to a set of 12 healthy-control DNA samples. The log2 value of these normalized read-depths are then calculated, resulting in a log2 copy number ratio. We next segmented the log2 copy number ratios using piecewise constant fitting by applying the pcf function from the R package copynumber (v1.12.0) (Nilsen et al., 2012), and calculated the median log2 copy number ratio within these segments. To compare the copy number profiles from scRNA-seq against tumor DNA, we first collapsed the inferCNV output per row using mean before taking the log2 of the resulting values. We next calculated the median log2 ratio for genes that fall within the segments inferred in the previous step, so that the same regions could be compared across scRNA-seq and tumor DNA. Finally, we plotted the resulting median log2 copy number ratio from inferCNV against the median copy number log2 ratio from tumor DNA and calculated the Spearman correlation, as shown in Figure S3C.
Targeted Immunoglobulin Sequencing
Clonotypic immunoglobulin sequences were identified with clonoSEQ® as previously described (Faham et al., 2012; Kurtz et al., 2015), and were obtained for three DLBCL tumors profiled in this work (DLBCL007, DLBCL008, and DLBCL111). Briefly, genomic tumor DNA was amplified using locus-specific primers to allow for the amplification of all known alleles of the germline IGH and IGK sequences. The PCR products were sequenced, yielding the identities and frequencies of the different clonotypes. Clonotype frequencies within a sample were determined as the read-count of each clonotype divided by the total number of sequencing reads in each sample. Clonotypic molecules were considered to have a frequency threshold exceeding 5% in tumor biopsies. To compare the clonotype obtained from tumor DNA against the dominant clonotype in scRNA-seq, we retrieved the consensus sequence from the most abundant clonotype for each sample. We next aligned the resulting consensus sequence to the clonotype sequence from tumor DNA using nucleotide BLAST (Altschul et al., 1990). The V(D)J segments were obtained from VQUEST (Brochet et al., 2008).
Distribution of B Cell States Across Platforms
To compare the B cell state distribution between ABC and GCB DLBCL (Figure S3E), we first averaged the discrete assignments of B cell states within each DLBCL cohort (Cell State Quantification) and aggregated the resulting values by mean across the four DLBCL cohorts (Figure 1B). For scRNA-seq samples, we assigned single-cell transcriptomes to EcoTyper states (Cell State Recovery in External Datasets) and determined the B cell state distribution for DLBCL samples classified as ABC (n = 4) or GCB (n = 3) DLBCL.
Visualization of DLBCL B Cell Ontogeny
To create the plot in Figure 3F, we applied the R package escape v1.1.1 (Borcherding et al., 2021) to calculate single-cell gene set enrichment (scGSEA) scores for each of the following gene sets in scRNA-seq profiles of normal tonsillar B cells (King et al., 2021): GSE12366_GC_VS_MEMORY_BCELL_UP, GSE12366_GC_VS_MEMORY_BCELL_DN, GSE42724_MEMORY_BCELL_VS_PLASMABLAST_UP, and GSE42724_MEMORY_BCELL_VS_PLASMABLAST_DN. After scaling the scGSEA scores for each gene set to zero mean and unit variance, we grouped the ‘UP’ and ‘DOWN’ pair for each developmental axis (e.g., GC_MEMORY_BCELL_UP and DN) and calculated single-cell scores based on the following rule: If UP > DOWN, score = UP; otherwise score = –DOWN. This resulted in two scores per cell, which we visualized as x and y coordinates (Figure 3F). To project DLBCL B cells onto the low-dimension embedding in Figure 3F, we applied the above workflow to calculate two scores per B cell for each DLBCL sample in Figure 3H. For scRNA-seq data generated in this work, scGSEA was applied to DLBCL and normal tonsil samples as a group, whereas for scRNA-seq data generated by Roider et al., scGSEA was applied to DLBCL and reactive lymph node samples as a group. Finally, by applying a k-nearest neighbor classifier (R package FNN v1.1.3) (Beygelzimer et al., 2021) to the x and y scores, we mapped each DLBCL B cell onto the closest tonsillar B cell. Density-normalization was applied to the point size and color of DLBCL B cells using the kde2d function from MASS v7.3–53.1 in R (Venables and Ripley, 2002).
Survival Analyses
Overall survival analysis was performed with Cox proportional hazards regression using coxph from the R package survival (v2.42.3) (Therneau and Grambsch, 2000). To calculate continuous survival associations for EcoTyper-derived states and LEs as shown in Figures 2G, S2I, 4C, S4E, S4F, 6C, S6B, 7B and S7A, relative abundance estimates were used as the explanatory variable. The resulting z-scores were combined across DLBCL datasets using Liptak’s method (Lipták, 1958) with the inverse of the square root of number of samples provided as weights. For multivariable analyses, COO, LymphGen, C1–C5, or LME classes (Kotlov et al., 2021) were additionally included as covariates. Kaplan-Meier plots were used to estimate overall survival and progression free survival of discrete variables, such as cell state assignments (Cell State Quantification). Significance was assessed by a two-sided log-rank test. As the Chapuy et al. validation cohort had shorter follow-up time than the other DLBCL patient cohorts, all four cohorts were censored at 10 years follow-up.
Bulk Tumor Subtyping
For the results shown in Figure S6C,D, we applied the EcoTyper framework directly to the Schmitz et al. discovery cohort without performing cell type-specific gene expression purification or AFI filtering. The survival associations of bulk NMF subtypes were calculated and combined across cohorts as described above.
Stepwise Regression Models
For the results shown in Figure S6F, we applied Cox regression with backwards selection to create composite survival models using LEs paired with either COO, LymphGen, C1–C5, or LME subtypes (Kotlov et al., 2021) as potential covariates. LE abundances were analyzed as continuous variables whereas molecular subtypes were analyzed as categorical variables. Only samples with all covariates available were assessed (n = 553). For the stepwise regression of LE and LME classes, as a subset of samples did not have LME class labels, only 404 samples were included in the analysis. To avoid collinearity issues, for each class of covariates above (i.e., LEs, COO subtypes, etc.), we excluded the variable with the least significant association with overall survival, calculated as described above. Backwards stepwise regression was performed with the function stepAIC from the MASS R package (version 7.3–53.1) with default settings (Venables and Ripley, 2002).
Overlap of States Discovered in Different Datasets
For the analysis in Figure S4A–C, we used EcoTyper for state discovery and state recovery, as described in Cell Type-Specific Expression Purification, Discovery of DLBCL Cell States, and Cell State Recovery in External Datasets. To quantify the overlap of cell states discovered in different datasets, d1 and d2, we first applied EcoTyper to recover the states from d1 in d2 (Cell State Recovery in External Datasets). Using discrete cell state assignments (Cell State Quantification), we then calculated pairwise Jaccard indices between (1) the state labels discovered de novo in d2 and (2) the state labels obtained by recovering d1 states in d2. Jaccard indices were set to 0 for pairs of states lacking significant overlap (P > 0.05, hypergeometric test). For a given cell type c, we considered a pair of states to be matching if their Jaccard index was both positive and mutually highest among all states from c identified in d1 and d2.
Annotation of EcoTyper States
For the enrichment analyses shown in Figures 3B, S4G, and S5A, we applied pre-ranked Gene Set Enrichment Analysis (GSEA) using the fgsea package v1.8.0 (Korotkevich et al., 2019) with 10,000 permutations. For the results in Figure 3B, we first obtained the average log2 TPM of the B cell subsets defined by Holmes and colleagues (Holmes et al., 2020). We averaged the log2 TPM of the minor subsets to obtain expression profiles of the cell subsets shown in Figure 3B (for example, DZa and DZb were averaged to obtain a DZ profile). We then computed the log2 fold change between each cell subset and the remaining ones. For each evaluated cell subset, a gene list rank-ordered by log2 fold change was provided as input to fgsea along with the top 100 marker genes per B cell state, selected as described in State-Specific Marker Genes in scRNA-Seq Data. For Figures S4G and S5A, we defined pre-ranked gene lists for purified cell populations of interest (Newman et al., 2015) by calculating the log2 fold change of each cell population versus the remaining ones analyzed. We then applied pre-ranked GSEA to the top 50 marker genes of each evaluated monocyte/macrophage cell state (as described in State-Specific Marker Genes in scRNA-Seq Data). To highlight biological processes significantly enriched in Tregs state S2 as shown in Figure S5B, we selected the top 100 genes assigned to Tregs S2 as described in State-Specific Marker Genes in scRNA-Seq Data and provided it as input to ToppFun (Chen et al., 2009).
Tumor/Normal Enrichment of EcoTyper States
For the analyses in Figures S2C and S6H, we analyzed scRNA-seq datasets that included cells from both tumor and normal tissues. For example, the scRNA-seq dataset generated in this work included a healthy tonsil in addition to lymphoma samples. Two lymphoma scRNA-seq datasets harboring both malignant and normal cells were also included (Andor et al., Roider et al; Table S1). For each EcoTyper-derived cell state and distinct scRNA-seq dataset, we determined whether normal cells were significantly enriched in a given cell state using Fisher’s exact test. We then combined the resulting p-values from the three datasets into an unweighted meta p-value using the sumz function from the R package metap v1.4 (Dewey, 2020) (Tables S2 and S3). We repeated the same exercise for tumor-associated cells. As the scRNA-seq dataset from Andor and colleagues did not include follicular helper T cells, this dataset was excluded when combining p-values for follicular helper T cells.
Cell Type Composition of Lymphoma Ecotypes
To determine cell type compositional differences among LEs (Figure 6C, center), CIBERSORTx was applied to enumerate 13 cell types in all three validation DLBCL patient cohorts (Figure 1B). The same parameters as in Estimation of Cell Type Abundance were applied, except for the dataset of Chapuy et al., which was profiled on Affymetrix microarrays, and was therefore run with B-mode batch correction for TR4 and without batch correction for LM22. Fractions for each of the 13 cell types were averaged across the samples assigned to each lymphoma ecotype within each patient cohort. Finally, we calculated the mean of the average fractions across all four cohorts.
Ligand Receptor Analysis
To identify significant ligand-receptor pairs between and within lymphoma ecotypes, we merged all digitally-purified expression profiles (Cell Type-Specific Expression Purification) into one matrix and ran CellPhoneDB v2.1.1 (Efremova et al., 2020) with method = statistical_analysis and with samples labeled by the most abundant cell state. Ligand-receptor pairs filtered for CellPhoneDB significance (P < 0.05) are provided online at http://ecotyper.stanford.edu/lymphoma.
Analysis of REMoDL-B
Adjusted Overall Survival Score
To identify cell states and lymphoma ecotypes associated with a greater therapeutic benefit from RB-CHOP than R-CHOP (Figure 7, Figure S7), we devised an index that penalizes variables associated with response to R-CHOP as compared to RB-CHOP. Specifically, we first calculated the univariable continuous association between cell state abundance and overall survival in each arm using Cox regression. The resulting z-scores from each arm were subsequently aggregated into an adjusted OS z-score, schematically depicted in Figure S7B. In brief, the adjusted OS z-score was calculated by first comparing the sign of the univariable survival z-scores between arms. If the signs were different, the adjusted z-score was set to ZRB-CHOP. Otherwise, if |ZRB-CHOP| was greater than |ZR-CHOP|, the adjusted OS z-score was set to ZRB-CHOP – ZR-CHOP; otherwise it was set to 0. In this way, states and LEs that were positively or negatively associated with a greater therapeutic benefit from RB-CHOP than R-CHOP were skewed to the extremes of the ranked list, whereas other states and LEs were localized to the middle (Figure S7A).
Bootstrapping Analysis
To assess the robustness of the adjusted OS z-score to different sample sizes, we randomly selected 50% of samples without replacement from the REMoDL-B dataset and recalculated the adjusted OS z-scores. We repeated this procedure 50 times with different seeds (Figure S7C).
Leave-One-Out Cross-Validation
We employed a leave-one-out cross-validation procedure to assign samples in the RB-CHOP arm to T cell CD8 S1 high and low groups (Figure 7F,G and Figure S7D). Specifically, we held out each sample in the RB-CHOP arm and assigned it to the T cell CD8 S1 high group if the abundance of T cell CD8 S1 in that sample was above the median of the training samples and to the T cell CD8 S1 low group otherwise. For classifying samples in the R-CHOP arm, we used the median value calculated across all RB-CHOP samples.
Analysis of CXCR5+ CD8 T Cell Markers
To calculate statistical significance in Figure 7C, we binarized the expression data in the bubble plot according to two features: (1) the average log2 expression of each gene in each state (normalized from 0 to 1 for each gene/row in the bubble plot) and (2) the fraction of scRNA-seq datasets with higher expression in the indicated state. First, we binarized the latter such that for a given gene in a given cell state, expression was set to 1 if it was concordantly differentially expressed in at least two datasets; otherwise it was set to 0. The resulting quantity was multiplied by normalized relative expression (feature 1 above) and dichotomized into binary values using a threshold of 0.5. Next, positive and negative markers of CXCR5+ CD8 T cells (Figure 7C) (Brummelman et al., 2018) were set to 1 and 0, respectively. Concordance of each cell state with known positive/negative markers was assessed using Fisher’s exact test.
Spatial Transcriptomics
For Figures 7D,E, S2J and S6I–K, we analyzed a normal human lymph node section profiled by 10x Visium (https://support.10xgenomics.com/spatial-gene-expression/datasets). Cell state abundance estimation was performed as described in Luca et al. (2021). Briefly, we applied EcoTyper to impute the fractional abundance of each DLBCL state in the Visium array. Then, for each spatially-barcoded spot, we set the most abundant cell state per cell type to 1 and the rest to 0. Finally, we normalized each cell state by multiplying it by its parent cell type fraction imputed by CIBERSORTx. To analyze cell state co-localization in Figure S6J, we calculated all pairwise Spearman correlation coefficients between cell state abundance profiles in the Visium array. Next, we performed a permutation test to determine whether states within a given LE were more co-localized than expected by random chance (Luca et al., 2021). To define B cell follicles (Figure 7D), we performed graph-based clustering in Loupe Browser 4.2.0.0 (10x Genomics). Clusters 1 and 7 were well-aligned with (1) follicle-enriched marker genes (e.g., BCL6 in Figure S2J, right) and (2) structures with clear follicular morphology in the histopathological image. Finally, to create the plot in Figure 7E, for each CD8 T cell state, we calculated the average Euclidean distance from each spot where the state was detectable (fraction > 0) to the closest three spots overlapping predicted follicles in Figure 7D.
Visualization
UMAP Projection of scRNA-Seq Data
To generate the low-dimensional embedding shown in Figures 1C and S5C,D, we applied Seurat (v4) to the scRNA-seq expression matrices generated in this work (Figures 1C and S5C) and by Roider et al. (Figure S5D), where each patient sample was considered as a separate batch and combined with IntegrateData using default parameters. We applied the umap R package (v0.2.0.0) (McInnes et al., 2018) with default parameters to the resulting expression matrices.
UMAP Projection of Cell States
To generate the UMAP plot shown in Figure 4A, the umap package v0.2.0.0 in R with default parameters was applied to the gene expression profiles imputed by CIBERSORTx in the discovery cohort. For cell types with more than 1,000 genes imputed by CIBERSORTx, the 1,000 genes with highest dispersion (Luca et al., 2021) were selected; otherwise, all genes were used. Samples not assigned to a cell state were excluded. The UMAP coordinates were then calculated for each cell type using the top 20 principal components on the log2-adjusted cell type-specific expression matrix.
Lymphoma Ecotype Networks
The network diagrams depicted in Figures 6B and S6H were generated using the igraph package (v1.2.2) (Csardi and Nepusz, 2006). Edge thickness represents the Jaccard index between cell states assigned to each sample (using discrete assignments as described in Cell State Quantification). The layout of each network was created using the layout_with_fr function, which applies the forced directed layout algorithm by Fruchterman and Reingold (Fruchterman and Reingold, 1991).
ADDITIONAL RESOURCES
The processed data and results generated in this study are available as a resource at http://ecotyper.stanford.edu/lymphoma. The software is implemented in a R/Shiny web application, and allows users to (1) interact with, visualize, and explore Lymphoma EcoTyper results; (2) download data associated with this publication; and (3) run Lymphoma EcoTyper to assign cell states and lymphoma ecotypes on user-provided bulk and single-cell expression data.
Supplementary Material
Table S1. Overview of Bulk and Single-Cell Expression Datasets, Related to Figure 1.
Table S4. Characteristics of Lymphoma Ecotypes, Related to Figure 6.
Acknowledgments
We are grateful to J. Kastenschmidt and L. Wagar for assistance with this study. We thank R. Morin, D. Scott, C. Steidl, A. Reddy, and S. Dave for sharing expression data, and to our patients and their families for their generosity in participating as research subjects. This work was supported by the National Cancer Institute (R01CA233975 to A.A.A. and M.D., R00CA187192 and R01CA255450 to A.M.N., 1-K08-CA241076-01 to D.M.K., U24CA224309 and U54CA209971 to A.J.G.), the Fund for Cancer Informatics (A.J.G., M.D.), the Virginia and D.K. Ludwig Fund for Cancer Research (A.A.A., A.M.N.), the American Association for Cancer Research (19-40-12-STEE to C.B.S.), Stinehart-Reed foundation (A.M.N., A.A.A.), the Bakewell Foundation (M.D., A.A.A.), the SDW/DT and Shanahan Family Foundations (A.A.A.), the Stanford Bio-X Interdisciplinary Initiatives Seed Grants Program (IIP) (A.M.N.), the Donald E. and Delia B. Baxter Foundation (A.M.N.), and the Virginia and D.K. Ludwig Fund for Cancer Research (A.M.N., A.A.A.). A.A.A. is a Scholar of The Leukemia & Lymphoma Society.
Declaration of Interests
D.M.K. reports paid consultancy from Roche Molecular Diagnostics. M.D. reports research funding from Varian Medical Systems and Illumina, ownership interest in CiberMed, Foresight Diagnostics, patent filings related to cancer biomarkers, and paid consultancy from Roche, AstraZeneca, RefleXion and BioNTech. A.M.N. reports ownership interest in CiberMed and patent filings related to cancer biomarkers. A.A.A. reports research support from Bristol Meyers Squibb, ownership interest in CiberMed, FortySeven Inc., Foresight Diagnostics, patent filings related to cancer biomarkers, and paid consultancy from Genentech, Roche, Chugai, Gilead, and Celgene. C.B.S., B.A.L., A.J.G., A.M.N., and A.A.A. have filed patent application PCT/US2020/059196. The remaining authors declare no potential conflicts of interest.
Footnotes
Publisher's Disclaimer: This is a PDF file of an unedited manuscript that has been accepted for publication. As a service to our customers we are providing this early version of the manuscript. The manuscript will undergo copyediting, typesetting, and review of the resulting proof before it is published in its final form. Please note that during the production process errors may be discovered which could affect the content, and all legal disclaimers that apply to the journal pertain.
References
- Advani R, Flinn I, Popplewell L, Forero A, Bartlett NL, Ghosh N, Kline J, Roschewski M, LaCasce A, Collins GP, et al. (2018). CD47 Blockade by Hu5F9-G4 and Rituximab in Non-Hodgkin’s Lymphoma. N Engl J Med 379, 1711–1721. [DOI] [PMC free article] [PubMed] [Google Scholar]
- Alizadeh AA, Eisen MB, Davis RE, Ma C, Lossos IS, Rosenwald A, Boldrick JC, Sabet H, Tran T, Yu X, et al. (2000). Distinct types of diffuse large B-cell lymphoma identified by gene expression profiling. Nature 403, 503–511. [DOI] [PubMed] [Google Scholar]
- Altschul SF, Gish W, Miller W, Myers EW, and Lipman DJ (1990). Basic local alignment search tool. J Mol Biol 215, 403–410. [DOI] [PubMed] [Google Scholar]
- Alvaro T, Lejeune M, Salvado MT, Lopez C, Jaen J, Bosch R, and Pons LE (2006). Immunohistochemical patterns of reactive microenvironment are associated with clinicobiologic behavior in follicular lymphoma patients. J Clin Oncol 24, 5350–5357. [DOI] [PubMed] [Google Scholar]
- Andor N, Simonds EF, Czerwinski DK, Chen J, Grimes SM, Wood-Bouwens C, Zheng GXY, Kubit MA, Greer S, Weiss WA, et al. (2019). Single-cell RNA-Seq of follicular lymphoma reveals malignant B-cell types and coexpression of T-cell immune checkpoints. Blood 133, 1119–1129. [DOI] [PMC free article] [PubMed] [Google Scholar]
- Ansell SM, Lesokhin AM, Borrello I, Halwani A, Scott EC, Gutierrez M, Schuster SJ, Millenson MM, Cattry D, Freeman GJ, et al. (2015). PD-1 blockade with nivolumab in relapsed or refractory Hodgkin’s lymphoma. N Engl J Med 372, 311–319. [DOI] [PMC free article] [PubMed] [Google Scholar]
- Aoki T, Chong LC, Takata K, Milne K, Hav M, Colombo A, Chavez EA, Nissen M, Wang X, Miyata-Takata T, et al. (2020). Single-Cell Transcriptome Analysis Reveals Disease-Defining T-cell Subsets in the Tumor Microenvironment of Classic Hodgkin Lymphoma. Cancer Discov 10, 406–421. [DOI] [PubMed] [Google Scholar]
- Armand P, Shipp MA, Ribrag V, Michot JM, Zinzani PL, Kuruvilla J, Snyder ES, Ricart AD, Balakumaran A, Rose S, et al. (2016). Programmed Death-1 Blockade With Pembrolizumab in Patients With Classical Hodgkin Lymphoma After Brentuximab Vedotin Failure. J Clin Oncol 34, 3733–3739. [DOI] [PMC free article] [PubMed] [Google Scholar]
- Azizi E, Carr AJ, Plitas G, Cornish AE, Konopacki C, Prabhakaran S, Nainys J, Wu K, Kiseliovas V, Setty M, et al. (2018). Single-Cell Map of Diverse Immune Phenotypes in the Breast Tumor Microenvironment. Cell 174, 1293–1308 e1236. [DOI] [PMC free article] [PubMed] [Google Scholar]
- Basso K, and Dalla-Favera R (2015). Germinal centres and B cell lymphomagenesis. Nature Reviews Immunology 15, 172–184. [DOI] [PubMed] [Google Scholar]
- Batlevi CL, Matsuki E, Brentjens RJ, and Younes A (2016). Novel immunotherapies in lymphoid malignancies. Nature Reviews Clinical Oncology 13, 25–40. [DOI] [PMC free article] [PubMed] [Google Scholar]
- Beygelzimer A, Kakadet S, Langford J, Arya S, Mount D, Li S, and Li MS (2021). Fast Nearest Neighbor Search Algorithms and Applications. R package version 1.1.3. [Google Scholar]
- Borcherding N, Vishwakarma A, Voigt AP, Bellizzi A, Kaplan J, Nepple K, Salem AK, Jenkins RW, Zakharia Y, and Zhang W (2021). Mapping the immune environment in clear cell renal carcinoma by single-cell genomics. Commun Biol 4, 122. [DOI] [PMC free article] [PubMed] [Google Scholar]
- Brochet X, Lefranc MP, and Giudicelli V (2008). IMGT/V-QUEST: the highly customized and integrated system for IG and TR standardized V-J and V-D-J sequence analysis. Nucleic Acids Res 36, W503–508. [DOI] [PMC free article] [PubMed] [Google Scholar]
- Brummelman J, Mazza EMC, Alvisi G, Colombo FS, Grilli A, Mikulak J, Mavilio D, Alloisio M, Ferrari F, Lopci E, et al. (2018). High-dimensional single cell analysis identifies stem-like cytotoxic CD8+ T cells infiltrating human tumors. Journal of Experimental Medicine 215, 2520–2535. [DOI] [PMC free article] [PubMed] [Google Scholar]
- Butler A, Hoffman P, Smibert P, Papalexi E, and Satija R (2018). Integrating single-cell transcriptomic data across different conditions, technologies, and species. Nature biotechnology 36, 411–420. [DOI] [PMC free article] [PubMed] [Google Scholar]
- Canioni D, Salles G, Mounier N, Brousse N, Keuppens M, Morchhauser F, Lamy T, Sonet A, Rousselet MC, Foussard C, et al. (2008). High numbers of tumor-associated macrophages have an adverse prognostic value that can be circumvented by rituximab in patients with follicular lymphoma enrolled onto the GELAGOELAMS FL-2000 trial. J Clin Oncol 26, 440–446. [DOI] [PubMed] [Google Scholar]
- Chabon JJ, Hamilton EG, Kurtz DM, Esfahani MS, Moding EJ, Stehr H, Schroers-Martin J, Nabet BY, Chen B, Chaudhuri AA, et al. (2020). Integrating genomic features for non-invasive early lung cancer detection. Nature 580, 245–251. [DOI] [PMC free article] [PubMed] [Google Scholar]
- Chao MP, Alizadeh AA, Tang C, Myklebust JH, Varghese B, Gill S, Jan M, Cha AC, Chan CK, Tan BT, et al. (2010). Anti-CD47 antibody synergizes with rituximab to promote phagocytosis and eradicate non-Hodgkin lymphoma. Cell 142, 699–713. [DOI] [PMC free article] [PubMed] [Google Scholar]
- Chapuy B, Stewart C, Dunford AJ, Kim J, Kamburov A, Redd RA, Lawrence MS, Roemer MGM, Li AJ, Ziepert M, et al. (2018). Molecular subtypes of diffuse large B cell lymphoma are associated with distinct pathogenic mechanisms and outcomes. Nat Med 24, 679–690. [DOI] [PMC free article] [PubMed] [Google Scholar]
- Chen J, Bardes EE, Aronow BJ, and Jegga AG (2009). ToppGene Suite for gene list enrichment analysis and candidate gene prioritization. Nucleic Acids Res 37, W305–311. [DOI] [PMC free article] [PubMed] [Google Scholar]
- Chen R, Zinzani PL, Fanale MA, Armand P, Johnson NA, Brice P, Radford J, Ribrag V, Molin D, Vassilakopoulos TP, et al. (2017). Phase II Study of the Efficacy and Safety of Pembrolizumab for Relapsed/Refractory Classic Hodgkin Lymphoma. J Clin Oncol 35, 2125–2132. [DOI] [PMC free article] [PubMed] [Google Scholar]
- Chu F, Li HS, Liu X, Cao J, Ma W, Ma Y, Weng J, Zhu Z, Cheng X, Wang Z, et al. (2019). CXCR5+CD8+ T cells are a distinct functional subset with an antitumor activity. Leukemia 33, 2640–2653. [DOI] [PMC free article] [PubMed] [Google Scholar]
- Cieślik M, and Chinnaiyan AM (2018). Cancer transcriptome profiling at the juncture of clinical translation. Nature Reviews Genetics 19, 93–109. [DOI] [PubMed] [Google Scholar]
- Csardi G, and Nepusz T (2006). The igraph software package for complex network research. InterJournal, complex systems 1695, 1–9. [Google Scholar]
- Dai M, Wang P, Boyd AD, Kostov G, Athey B, Jones EG, Bunney WE, Myers RM, Speed TP, and Akil H (2005). Evolving gene/transcript definitions significantly alter the interpretation of GeneChip data. Nucleic acids research 33, e175–e175. [DOI] [PMC free article] [PubMed] [Google Scholar]
- Dave SS, Wright G, Tan B, Rosenwald A, Gascoyne RD, Chan WC, Fisher RI, Braziel RM, Rimsza LM, Grogan TM, et al. (2004). Prediction of survival in follicular lymphoma based on molecular features of tumor-infiltrating immune cells. N Engl J Med 351, 2159–2169. [DOI] [PubMed] [Google Scholar]
- Davies A, Cummin TE, Barrans S, Maishman T, Mamot C, Novak U, Caddy J, Stanton L, Kazmi-Stokes S, McMillan A, et al. (2019). Gene-expression profiling of bortezomib added to standard chemoimmunotherapy for diffuse large B-cell lymphoma (REMoDL-B): an open-label, randomised, phase 3 trial. Lancet Oncol 20, 649–662. [DOI] [PMC free article] [PubMed] [Google Scholar]
- Dewey M (2020). metap: Meta-analysis of significance values. R package version 1.4. [Google Scholar]
- Efremova M, Vento-Tormo M, Teichmann SA, and Vento-Tormo R (2020). CellPhoneDB: inferring cell–cell communication from combined expression of multi-subunit ligand–receptor complexes. Nature Protocols 15, 1484–1506. [DOI] [PubMed] [Google Scholar]
- Ennishi D, Healy S, Bashashati A, Saberi S, Hother C, Mottok A, Chan FC, Chong L, Abraham L, Kridel R, et al. (2020). TMEM30A loss-of-function mutations drive lymphomagenesis and confer therapeutically exploitable vulnerability in B-cell lymphoma. Nat Med 26, 577–588. [DOI] [PMC free article] [PubMed] [Google Scholar]
- Ennishi D, Jiang A, Boyle M, Collinge B, Grande BM, Ben-Neriah S, Rushton C, Tang J, Thomas N, Slack GW, et al. (2019). Double-Hit Gene Expression Signature Defines a Distinct Subgroup of Germinal Center B-Cell-Like Diffuse Large B-Cell Lymphoma. J Clin Oncol 37, 190–201. [DOI] [PMC free article] [PubMed] [Google Scholar]
- Esfahani MS, Alig S, Kurtz DM, Soo J, Jin MC, Macaulay C, Craig AFM, Garofalo A, Steen CB, Scherer F, et al. (2019). Towards Non-Invasive Classification of DLBCL Genetic Subtypes By Ctdna Profiling. Blood 134, 551. [Google Scholar]
- Faham M, Zheng J, Moorhead M, Carlton VE, Stow P, Coustan-Smith E, Pui CH, and Campana D (2012). Deep-sequencing approach for minimal residual disease detection in acute lymphoblastic leukemia. Blood 120, 5173–5180. [DOI] [PMC free article] [PubMed] [Google Scholar]
- Finotello F, Rieder D, Hackl H, and Trajanoski Z (2019). Next-generation computational tools for interrogating cancer immunity. Nature Reviews Genetics 20, 724–746. [DOI] [PubMed] [Google Scholar]
- Fruchterman TMJ, and Reingold EM (1991). Graph drawing by force-directed placement. Software: Practice and Experience 21, 1129–1164. [Google Scholar]
- Glas AM, Knoops L, Delahaye L, Kersten MJ, Kibbelaar RE, Wessels LA, van Laar R, van Krieken JH, Baars JW, Raemaekers J, et al. (2007). Gene-expression and immunohistochemical study of specific T-cell subsets and accessory cell types in the transformation and prognosis of follicular lymphoma. J Clin Oncol 25, 390–398. [DOI] [PubMed] [Google Scholar]
- Green MR, Kihira S, Liu CL, Nair RV, Salari R, Gentles AJ, Irish J, Stehr H, Vicente-Duenas C, Romero-Camarero I, et al. (2015). Mutations in early follicular lymphoma progenitors are associated with suppressed antigen presentation. Proc Natl Acad Sci U S A 112, E1116–1125. [DOI] [PMC free article] [PubMed] [Google Scholar]
- Green MR, Vicente-Duenas C, Romero-Camarero I, Long Liu C, Dai B, Gonzalez-Herrero I, Garcia-Ramirez I, Alonso-Escudero E, Iqbal J, Chan WC, et al. (2014). Transient expression of Bcl6 is sufficient for oncogenic function and induction of mature B-cell lymphoma. Nat Commun 5, 3904. [DOI] [PMC free article] [PubMed] [Google Scholar]
- Gulati GS, Sikandar SS, Wesche DJ, Manjunath A, Bharadwaj A, Berger MJ, Ilagan F, Kuo AH, Hsieh RW, Cai S, et al. (2020). Single-cell transcriptional diversity is a hallmark of developmental potential. Science 367, 405–411. [DOI] [PMC free article] [PubMed] [Google Scholar]
- Hans CP, Weisenburger DD, Greiner TC, Gascoyne RD, Delabie J, Ott G, Muller-Hermelink HK, Campo E, Braziel RM, Jaffe ES, et al. (2004). Confirmation of the molecular classification of diffuse large B-cell lymphoma by immunohistochemistry using a tissue microarray. Blood 103, 275–282. [DOI] [PubMed] [Google Scholar]
- Holmes AB, Corinaldesi C, Shen Q, Kumar R, Compagno N, Wang Z, Nitzan M, Grunstein E, Pasqualucci L, Dalla-Favera R, et al. (2020). Single-cell analysis of germinal-center B cells informs on lymphoma cell of origin and outcome. J Exp Med 217, e20200483. [DOI] [PMC free article] [PubMed] [Google Scholar]
- King HW, Orban N, Riches JC, Clear AJ, Warnes G, Teichmann SA, and James LK (2021). Single-cell analysis of human B cell maturation predicts how antibody class switching shapes selection dynamics. Sci Immunol 6, eabe6291. [DOI] [PubMed] [Google Scholar]
- Korotkevich G, Sukhov V, and Sergushichev A (2019). Fast gene set enrichment analysis. bioRxiv, 060012. [Google Scholar]
- Kotlov N, Bagaev A, Revuelta MV, Phillip JM, Cacciapuoti MT, Antysheva Z, Svekolkin V, Tikhonova E, Miheecheva N, Kuzkina N, et al. (2021). Clinical and Biological Subtypes of B-cell Lymphoma Revealed by Microenvironmental Signatures. Cancer Discovery 11, 1468–1489. [DOI] [PMC free article] [PubMed] [Google Scholar]
- Kurtz DM, Green MR, Bratman SV, Scherer F, Liu CL, Kunder CA, Takahashi K, Glover C, Keane C, Kihira S, et al. (2015). Noninvasive monitoring of diffuse large B-cell lymphoma by immunoglobulin high-throughput sequencing. Blood 125, 3679–3687. [DOI] [PMC free article] [PubMed] [Google Scholar]
- Lambrechts D, Wauters E, Boeckx B, Aibar S, Nittner D, Burton O, Bassez A, Decaluwe H, Pircher A, Van den Eynde K, et al. (2018). Phenotype molding of stromal cells in the lung tumor microenvironment. Nat Med 24, 1277–1289. [DOI] [PubMed] [Google Scholar]
- Laughney AM, Hu J, Campbell NR, Bakhoum SF, Setty M, Lavallee VP, Xie Y, Masilionis I, Carr AJ, Kottapalli S, et al. (2020). Regenerative lineages and immune-mediated pruning in lung cancer metastasis. Nat Med 26, 259–269. [DOI] [PMC free article] [PubMed] [Google Scholar]
- Lee H-O, Hong Y, Etlioglu HE, Cho YB, Pomella V, Van den Bosch B, Vanhecke J, Verbandt S, Hong H, Min J-W, et al. (2020). Lineage-dependent gene expression programs influence the immune landscape of colorectal cancer. Nature Genetics 52, 594–603. [DOI] [PubMed] [Google Scholar]
- Lenz G, Wright G, Dave SS, Xiao W, Powell J, Zhao H, Xu W, Tan B, Goldschmidt N, Iqbal J, et al. (2008). Stromal gene signatures in large-B-cell lymphomas. N Engl J Med 359, 2313–2323. [DOI] [PMC free article] [PubMed] [Google Scholar]
- Lesokhin AM, Ansell SM, Armand P, Scott EC, Halwani A, Gutierrez M, Millenson MM, Cohen AD, Schuster SJ, Lebovic D, et al. (2016). Nivolumab in Patients With Relapsed or Refractory Hematologic Malignancy: Preliminary Results of a Phase Ib Study. Journal of Clinical Oncology 34, 2698–2704. [DOI] [PMC free article] [PubMed] [Google Scholar]
- Lipták T (1958). On the combination of independent tests. Magyar Tud Akad Mat Kutato Int Kozl 3, 171–197. [Google Scholar]
- Liu CC, Steen CB, and Newman AM (2019). Computational approaches for characterizing the tumor immune microenvironment. Immunology 158, 70–84. [DOI] [PMC free article] [PubMed] [Google Scholar]
- Luca BA, Steen CB, Matusiak M, Azizi A, Varma S, Zhu C, Przybyl J, Espín-Pérez A, Diehn M, Alizadeh AA, et al. (2021). Atlas of clinically distinct cell states and ecosystems across human solid tumors. Cell Accepted In Principle. [DOI] [PMC free article] [PubMed] [Google Scholar]
- Marie de C, and Roch H (2018). Hide or defend, the two strategies of lymphoma immune evasion: potential implications for immunotherapy. Haematologica 103, 1256–1268. [DOI] [PMC free article] [PubMed] [Google Scholar]
- McInnes L, Healy J, and Melville J (2018). Umap: Uniform manifold approximation and projection for dimension reduction. arXiv preprint arXiv:180203426. [Google Scholar]
- Melani C, Major A, Schowinsky J, Roschewski M, Pittaluga S, Jaffe ES, Pack SD, Abdullaev Z, Ahlman MA, Kwak JJ, et al. (2017). PD-1 Blockade in Mediastinal Gray-Zone Lymphoma. New England Journal of Medicine 377, 89–91. [DOI] [PMC free article] [PubMed] [Google Scholar]
- Menon MP, Pittaluga S, and Jaffe ES (2012). The Histological and Biological Spectrum of Diffuse Large B-Cell Lymphoma in the World Health Organization Classification. The Cancer Journal 18, 411–420. [DOI] [PMC free article] [PubMed] [Google Scholar]
- Mesin L, Schiepers A, Ersching J, Barbulescu A, Cavazzoni CB, Angelini A, Okada T, Kurosaki T, and Victora GD (2020). Restricted Clonality and Limited Germinal Center Reentry Characterize Memory B Cell Reactivation by Boosting. Cell 180, 92–106.e111. [DOI] [PMC free article] [PubMed] [Google Scholar]
- Monti S, Savage KJ, Kutok JL, Feuerhake F, Kurtin P, Mihm M, Wu B, Pasqualucci L, Neuberg D, Aguiar RC, et al. (2005). Molecular profiling of diffuse large B-cell lymphoma identifies robust subtypes including one characterized by host inflammatory response. Blood 105, 1851–1861. [DOI] [PubMed] [Google Scholar]
- Neelapu SS, Locke FL, Bartlett NL, Lekakis LJ, Miklos DB, Jacobson CA, Braunschweig I, Oluwole OO, Siddiqi T, Lin Y, et al. (2017). Axicabtagene Ciloleucel CAR T-Cell Therapy in Refractory Large B-Cell Lymphoma. N Engl J Med 377, 2531–2544. [DOI] [PMC free article] [PubMed] [Google Scholar]
- Newman AM, Liu CL, Green MR, Gentles AJ, Feng W, Xu Y, Hoang CD, Diehn M, and Alizadeh AA (2015). Robust enumeration of cell subsets from tissue expression profiles. Nat Methods 12, 453–457. [DOI] [PMC free article] [PubMed] [Google Scholar]
- Newman AM, Steen CB, Liu CL, Gentles AJ, Chaudhuri AA, Scherer F, Khodadoust MS, Esfahani MS, Luca BA, Steiner D, et al. (2019). Determining cell type abundance and expression from bulk tissues with digital cytometry. Nat Biotechnol 37, 773–782. [DOI] [PMC free article] [PubMed] [Google Scholar]
- Nilsen G, Liestøl K, Van Loo P, Vollan HKM, Eide MB, Rueda OM, Chin S-F, Russell R, Baumbusch LO, and Caldas C (2012). Copynumber: efficient algorithms for single-and multi-track copy number segmentation. BMC genomics 13, 591. [DOI] [PMC free article] [PubMed] [Google Scholar]
- Puram SV, Tirosh I, Parikh AS, Patel AP, Yizhak K, Gillespie S, Rodman C, Luo CL, Mroz EA, Emerick KS, et al. (2017). Single-Cell Transcriptomic Analysis of Primary and Metastatic Tumor Ecosystems in Head and Neck Cancer. Cell 171, 1611–1624 e1624. [DOI] [PMC free article] [PubMed] [Google Scholar]
- Reddy A, Zhang J, Davis NS, Moffitt AB, Love CL, Waldrop A, Leppa S, Pasanen A, Meriranta L, Karjalainen-Lindsberg ML, et al. (2017). Genetic and Functional Drivers of Diffuse Large B Cell Lymphoma. Cell 171, 481–494 e415. [DOI] [PMC free article] [PubMed] [Google Scholar]
- Reid S, Newman AM, Diehn M, Alizadeh AA, and Tibshirani R (2018). Genomic feature selection by coverage design optimization. Journal of Applied Statistics 45, 2658–2676. [DOI] [PMC free article] [PubMed] [Google Scholar]
- Richardson PG, Sonneveld P, Schuster MW, Irwin D, Stadtmauer EA, Facon T, Harousseau J-L, Ben-Yehuda D, Lonial S, Goldschmidt H, et al. (2005). Bortezomib or High-Dose Dexamethasone for Relapsed Multiple Myeloma. New England Journal of Medicine 352, 2487–2498. [DOI] [PubMed] [Google Scholar]
- Robak T, Huang H, Jin J, Zhu J, Liu T, Samoilova O, Pylypenko H, Verhoef G, Siritanaratkul N, Osmanov E, et al. (2015). Bortezomib-Based Therapy for Newly Diagnosed Mantle-Cell Lymphoma. New England Journal of Medicine 372, 944–953. [DOI] [PubMed] [Google Scholar]
- Roider T, Seufert J, Uvarovskii A, Frauhammer F, Bordas M, Abedpour N, Stolarczyk M, Mallm JP, Herbst SA, Bruch PM, et al. (2020). Dissecting intratumour heterogeneity of nodal B-cell lymphomas at the transcriptional, genetic and drug-response levels. Nat Cell Biol 22, 896–906. [DOI] [PubMed] [Google Scholar]
- Rosenwald A, Wright G, Chan WC, Connors JM, Campo E, Fisher RI, Gascoyne RD, Muller-Hermelink HK, Smeland EB, Giltnane JM, et al. (2002). The use of molecular profiling to predict survival after chemotherapy for diffuse large-B-cell lymphoma. N Engl J Med 346, 1937–1947. [DOI] [PubMed] [Google Scholar]
- Sagiv-Barfi I, Czerwinski DK, Levy S, Alam IS, Mayer AT, Gambhir SS, and Levy R (2018). Eradication of spontaneous malignancy by local immunotherapy. Science Translational Medicine 10, eaan4488. [DOI] [PMC free article] [PubMed] [Google Scholar]
- Scherer F, Kurtz DM, Newman AM, Stehr H, Craig AF, Esfahani MS, Lovejoy AF, Chabon JJ, Klass DM, Liu CL, et al. (2016). Distinct biological subtypes and patterns of genome evolution in lymphoma revealed by circulating tumor DNA. Sci Transl Med 8, 364ra155. [DOI] [PMC free article] [PubMed] [Google Scholar]
- Schmitz R, Wright GW, Huang DW, Johnson CA, Phelan JD, Wang JQ, Roulland S, Kasbekar M, Young RM, Shaffer AL, et al. (2018). Genetics and Pathogenesis of Diffuse Large B-Cell Lymphoma. N Engl J Med 378, 1396–1407. [DOI] [PMC free article] [PubMed] [Google Scholar]
- Schuster SJ, Bishop MR, Tam CS, Waller EK, Borchmann P, McGuirk JP, Jager U, Jaglowski S, Andreadis C, Westin JR, et al. (2019). Tisagenlecleucel in Adult Relapsed or Refractory Diffuse Large B-Cell Lymphoma. N Engl J Med 380, 45–56. [DOI] [PubMed] [Google Scholar]
- Scott DW, and Gascoyne RD (2014). The tumour microenvironment in B cell lymphomas. Nature Reviews Cancer 14, 517–534. [DOI] [PubMed] [Google Scholar]
- Segerstolpe A, Palasantza A, Eliasson P, Andersson EM, Andreasson AC, Sun X, Picelli S, Sabirsh A, Clausen M, Bjursell MK, et al. (2016). Single-Cell Transcriptome Profiling of Human Pancreatic Islets in Health and Type 2 Diabetes. Cell Metab 24, 593–607. [DOI] [PMC free article] [PubMed] [Google Scholar]
- Sha C, Barrans S, Cucco F, Bentley MA, Care MA, Cummin T, Kennedy H, Thompson JS, Uddin R, Worrillow L, et al. (2019). Molecular High-Grade B-Cell Lymphoma: Defining a Poor-Risk Group That Requires Different Approaches to Therapy. J Clin Oncol 37, 202–212. [DOI] [PMC free article] [PubMed] [Google Scholar]
- Steidl C, Lee T, Shah SP, Farinha P, Han G, Nayar T, Delaney A, Jones SJ, Iqbal J, Weisenburger DD, et al. (2010). Tumor-Associated Macrophages and Survival in Classic Hodgkin’s Lymphoma. New England Journal of Medicine 362, 875–885. [DOI] [PMC free article] [PubMed] [Google Scholar]
- Stouffer SA, Suchman EA, DeVinney LC, Star SA, and Williams RM Jr (1949). The american soldier: Adjustment during army life.(studies in social psychology in world war ii), vol. 1. [Google Scholar]
- Stuart T, Butler A, Hoffman P, Hafemeister C, Papalexi E, Mauck III WM, Hao Y, Stoeckius M, Smibert P, and Satija R (2019). Comprehensive integration of single-cell data. Cell 177, 1888–1902. e1821. [DOI] [PMC free article] [PubMed] [Google Scholar]
- Sun K, Welniak LA, Panoskaltsis-Mortari A, O’Shaughnessy MJ, Liu H, Barao I, Riordan W, Sitcheran R, Wysocki C, Serody JS, et al. (2004). Inhibition of acute graft-versus-host disease with retention of graft-versus-tumor effects by the proteasome inhibitor bortezomib. Proceedings of the National Academy of Sciences of the United States of America 101, 8120–8125. [DOI] [PMC free article] [PubMed] [Google Scholar]
- Suvà ML, and Tirosh I (2019). Single-Cell RNA Sequencing in Cancer: Lessons Learned and Emerging Challenges. Molecular Cell 75, 7–12. [DOI] [PubMed] [Google Scholar]
- Therneau TM, and Grambsch PM (2000). In Modeling survival data: extending the Cox model (Springer, New York: ), pp. 39–77. [Google Scholar]
- Tickle T, T.I., Georgescu C, Brown M, Haas B (2019). inferCNV of the Trinity CTAT Project. (Klarman Cell Observatory, Broad Institute of MIT and Harvard, Cambridge, MA, USA.), pp. https://github.com/broadinstitute/inferCNV. [Google Scholar]
- Tilly H, Gomes da Silva M, Vitolo U, Jack A, Meignan M, Lopez-Guillermo A, Walewski J, Andre M, Johnson PW, Pfreundschuh M, et al. (2015). Diffuse large B-cell lymphoma (DLBCL): ESMO Clinical Practice Guidelines for diagnosis, treatment and follow-up. Ann Oncol 26 Suppl 5, v116–125. [DOI] [PubMed] [Google Scholar]
- Valentine KM, and Hoyer KK (2019). CXCR5+ CD8 T Cells: Protective or Pathogenic? Frontiers in Immunology 10, 1322. [DOI] [PMC free article] [PubMed] [Google Scholar]
- van den Brink SC, Sage F, Vértesy Á, Spanjaard B, Peterson-Maduro J, Baron CS, Robin C, and van Oudenaarden A (2017). Single-cell sequencing reveals dissociation-induced gene expression in tissue subpopulations. Nature Methods 14, 935. [DOI] [PubMed] [Google Scholar]
- Venables W, and Ripley B (2002). Modern applied statistics (Fourth S, editor) New York: (Springer; ). [Google Scholar]
- Venturutti L, and Melnick A (2020). The dangers of déjà vu: Memory B-cells as the cell-of-origin of ABC-DLBCLs. Blood 136, 2263–2274. [DOI] [PMC free article] [PubMed] [Google Scholar]
- Wright GW, Huang DW, Phelan JD, Coulibaly ZA, Roulland S, Young RM, Wang JQ, Schmitz R, Morin RD, Tang J, et al. (2020). A Probabilistic Classification Tool for Genetic Subtypes of Diffuse Large B Cell Lymphoma with Therapeutic Implications. Cancer Cell 37, 551–568 e514. [DOI] [PMC free article] [PubMed] [Google Scholar]
- Younes A, Santoro A, Shipp M, Zinzani PL, Timmerman JM, Ansell S, Armand P, Fanale M, Ratanatharathorn V, Kuruvilla J, et al. (2016). Nivolumab for classical Hodgkin’s lymphoma after failure of both autologous stem-cell transplantation and brentuximab vedotin: a multicentre, multicohort, single-arm phase 2 trial. Lancet Oncol 17, 1283–1294. [DOI] [PMC free article] [PubMed] [Google Scholar]
- Zhang AW, O’Flanagan C, Chavez EA, Lim JLP, Ceglia N, McPherson A, Wiens M, Walters P, Chan T, Hewitson B, et al. (2019). Probabilistic cell-type assignment of single-cell RNA-seq for tumor microenvironment profiling. Nat Methods 16, 1007–1015. [DOI] [PMC free article] [PubMed] [Google Scholar]
- Zheng GX, Terry JM, Belgrader P, Ryvkin P, Bent ZW, Wilson R, Ziraldo SB, Wheeler TD, McDermott GP, and Zhu J (2017). Massively parallel digital transcriptional profiling of single cells. Nature communications 8, 1–12. [DOI] [PMC free article] [PubMed] [Google Scholar]
- Zilionis R, Engblom C, Pfirschke C, Savova V, Zemmour D, Saatcioglu HD, Krishnan I, Maroni G, Meyerovitz CV, Kerwin CM, et al. (2019). Single-Cell Transcriptomics of Human and Mouse Lung Cancers Reveals Conserved Myeloid Populations across Individuals and Species. Immunity 50, 1317–1334 e1310. [DOI] [PMC free article] [PubMed] [Google Scholar]
Associated Data
This section collects any data citations, data availability statements, or supplementary materials included in this article.
Supplementary Materials
Table S1. Overview of Bulk and Single-Cell Expression Datasets, Related to Figure 1.
Table S4. Characteristics of Lymphoma Ecotypes, Related to Figure 6.
Data Availability Statement
Single-cell RNA-seq data have been deposited at GEO and are publicly available as of the date of publication. The accession number is listed in the key resources table. This paper also analyzes existing, publicly available data. These accession numbers for the datasets are listed in the key resources table.
The original code for EcoTyper is available as of the date of the publication for non-profit academic use. The DOI is listed in the key resources table. Updates to the code will be available at https://ecotyper.stanford.edu/lymphoma.
Any additional information required to reanalyze the data reported in this paper is available from the lead contact upon request.
KEY RESOURCES TABLE.
| REAGENT or RESOURCE | SOURCE | IDENTIFIER |
|---|---|---|
| Antibodies | ||
| Brilliant Violet 605™ Anti-Human CD19 Antibody | BioLegend | Cat# 363023, RRID:AB_2564252; Cat# 363035, RRID:AB_2632786 |
| APC-H7 Mouse Anti-Human CD20 | BD Biosciences | Cat# 641396, RRID:AB_1645724 |
| LIVE/DEAD™ Fixable Aqua Dead Cell Stain Kit | Thermofisher | Cat# L34965 |
| 7-AAD Viability Staining | BioLegend | Cat# 420404 |
| Biological samples | ||
| Fresh or frozen surgical biopsies of DLBCL, FL and tonsil samples | This paper | N/A |
| Critical commercial assays | ||
| clonoSEQ® | https://www.clonoseq.com/ | N/A |
| Chromium Single Cell 5’ Library & Gel Bead Kit, 16 rxns | 10x Genomics, Pleasanton, CA | Prod# 1000006 |
| Chromium Single Cell 5’ Library Construction Kit, 16 rxns | 10x Genomics, Pleasanton, CA | Prod# 1000020 |
| Chromium Single Cell V(D)J Enrichment Kit, Human B Cell, 96 rxns | 10x Genomics, Pleasanton, CA | Prod# 1000016 |
| Chromium Single Cell A Chip Kit, 48 rxn | 10x Genomics, Pleasanton, CA | Prod# 1000152 |
| Chromium i7 Multiplex Kit | 10x Genomics, Pleasanton, CA | Prod# 120262 |
| Chromium Next GEM Single Cell 5’ Library & Gel Bead Kit v1.1, 16 rxns | 10x Genomics, Pleasanton, CA | Prod# 1000165 |
| Chromium Next GEM Chip G Single Cell Kit, 48 rxns | 10x Genomics, Pleasanton, CA | Prod# 1000120 |
| Single Index Kit T Set A, 96 rxns | 10x Genomics, Pleasanton, CA | Prod# 1000213 |
| Deposited data | ||
| DLBCL, FL and tonsil scRNA-seq | This paper | GEO: GSE182436 |
| Lymphoma and reactive lymph node samples scRNA-seq | Roider et al. (2020) | https://heidata.uni-heidelberg.de/dataset.xhtml?persistentId=doi:10.11588/data/VRJUNV |
| FL scRNA-seq | Andor et al. (2019) | Correspondence with authors |
| FL scRNA-seq | Zhang et al. (2019) | https://zenodo.org/record/3594331#.X42xh5Mzbxg |
| Reactive lymph node samples scRNA-seq | Aoki et al. (2020) | EGA: EGAS00001004085 |
| Tonsil samples scRNA-seq | King et al. (2021) | ArrayExpress: E-MTAB-8999 |
| DLBCL bulk-tissue RNA-seq | Schmitz et al. (2018) | https://gdc.cancer.gov/about-data/publications/DLBCL-2018 |
| DLBCL bulk-tissue RNA-seq | Ennishi et al. (2019) | EGA: EGAD00001003783 |
| DLBCL bulk-tissue RNA-seq | Reddy et al. (2017) | EGA: EGAD00001003600 |
| DLBCL bulk-tissue microarray | Chapuy et al. (2018) | GEO: GSE98588 |
| Bulk FL microarray samples | Newman et al. (2019) | GEO: GSE127472 |
| DLBCL microarray samples from the REMoDLB trial | Sha et al. (2019) | GEO: GSE117556 |
| Human lymph node Visium dataset (Space Ranger 1.0.0) | 10x Genomics | https://support.10xgenomics.com/spatial-gene-expression/datasets/1.0.0/V1_Human_Lymph_Node |
| Human reference genome NCBI build 38, GRCh38 | Genome Reference Consortium | http://www.ncbi.nlm.nih.gov/projects/genome/assembly/grc/human/ |
| BrainArray (v23) | Dai et al. (2005) | http://brainarray.mbni.med.umich.edu/Brainarray/Database/CustomCDF/CDF_download.asp#v23 |
| LM22 signature matrix (CIBERSORTx) | Newman et al. (2015) | N/A |
| TR4 signature matrix (CIBERSORTx) | Newman et al. (2019) | N/A |
| Software and algorithms | ||
| EcoTyper (v1.0) | This work |
https://ecotyper.stanford.edu/
https://doi.org/10.25936/rssb-t744 |
| CIBERSORTx (v1.0) | Newman et al. (2019) | https://cibersortx.stanford.edu/ |
| 10x Genomics Cell Ranger (v2.1, v3.0 and v5.0) | Zheng et al. (2017) | https://support.10xgenomics.com/single-cell-gene-expression/software/downloads/latest |
| 10x Genomics Loupe V(D)J Browser (v3.0.0 and v4.0.0) | 10x Genomics website | https://support.10xgenomics.com/single-cell-gene-expression/software/downloads/latest |
| 10x Genomics Loupe Browser (v4.2.0.0) | 10x Genomics website | https://support.10xgenomics.com/single-cell-gene-expression/software/downloads/latest |
| CellPhoneDB (v2.1.1) | Efremova et al. (2020) | https://github.com/Teichlab/cellphonedb |
| Seurat R package (v2.3.4 and v3.1.3) | Butler et al. (2018); Stuart et al. (2019) | https://cran.r-project.org/web/packages/Seurat/index.html |
| CytoTRACE R package (v0.3.3) | Gulati et al. (2020) | https://cytotrace.stanford.edu/ |
| inferCNV R package (v1.5.0) | Tickle et al. (2019) | http://www.bioconductor.org/packages/release/bioc/html/infercnv.html |
| copynumber R package (v1.12.0) | Nilsen et al. (2012) | https://www.bioconductor.org/packages/release/bioc/html/copynumber.html |
| escape R package (v1.1.1) | Borcherding (2021) | https://bioconductor.org/packages/release/bioc/html/escape.html |
| FNN R package (v1.1.3) | Beygelzimer et al. (2021) | https://CRAN.R-project.org/package=FNN |
| MASS R package (v7.3–53.1) | Venables and Ripley (2002) | https://cran.r-project.org/web/packages/MASS/index.html |
| survival R package (v2.42.3) | Therneau and Grambsch (2000) | https://cran.r-project.org/web/packages/survival/index.html |
| fgsea R package (v1.8.0) | Korotkevich et al. (2021) | https://bioconductor.org/packages/release/bioc/html/fgsea.html |
| metap R package (v1.4) | Dewey (2020) | https://CRAN.R-project.org/package=metap |
| igraph R package (v1.2.2) | Csardi and Nepusz (2006) | https://CRAN.R-project.org/package=igraph |
| umap R package (v.0.2.0.0) | McInnes et al. (2018) | https://cran.r-project.org/web/packages/umap/index.html |
| Other | ||
| ToppFun website | Chen et al. (2009) | https://toppgene.cchmc.org/ |