Abstract
Purpose:
To use T2 and diffusion MR to determine the change in the mechanical function of human disks with increased degenerative state.
Materials and Methods:
Spatial changes in T2 and diffusion were quantified in five cadaveric human lumbar disks under compressive loads. Regression models were used to investigate the relationship between the change in MR parameters and the disk’s dynamic and viscoelastic properties.
Results:
Compressive loading caused a significant reduction in the disk’s mean diffusivity ([11.3 versus 9.7].10−4.mm2/s, P < 0.001) but little change in T2 (P < 0.05). Diffusivity and T2 were correlated with the disk’s dynamic (P < 0.01 and P < 0.05) and long-term viscoelastic (P < 0.05 and P < 0.05) stiffness. Diffusivity but not T2, was correlated with its viscoelastic dampening (r2 = 0.45, P < 0.01) and instantaneous stiffness (r2 = 0.44, P < 0.05). Nucleus diffusivity was significantly higher than the annulus’s (−21% to −4%, P < 0.01). MR-estimated hydration was correlated with the instantaneous viscoelastic stiffness of the nucleus (r2 = 0.35, P < 0.05) and the dynamic (r2 = 0.44, P < 0.05) and long-term viscoelastic (r2 = 0.42, P < 0.05) stiffness in the annulus. T2 correlated with diffusivity at low load (r2 = 0.66, P < 0.05), but not at high load.
Conclusion:
The strong correlations between diffusivity and the rheological assessments of disk mechanics suggest that MR might permit quantitative assessment of disk functional status and structural integrity.
Keywords: intervertebral disc, MR diffusivity, T2 relaxation, mechanical competence, degeneration
INTRODUCTION
Disorders of the intervertebral disk are the most causes of low back pain, one of the most prevalent and costly illnesses in the United States (1). Image-based clinical classification of the severity of disk degeneration is based primarily on a subjective evaluation of magnetic resonance (MR) images for the loss in the anatomical definition of the nucleus versus annulus (2), signal intensity on T2 weighted images (3) and signal changes within the bone marrow adjacent to the end plates (4). However, these findings are often observed in asymptomatic patients, (5) while evidence of gross morphological changes in the tissue can only be detected at advanced stages of disk degeneration (6). This leads to ambiguity about the significance of these observations (4). Although the disk’s water content exhibits an inverse relationship with T1 and T2 relaxation rates (7), the relationships between relaxation parameters and the biochemical composition of the disk (8), its hydration state (3), and its mechanical behavior (9) remain unclear. Therefore, interpretation of MR findings is inherently limited to a nonspecific assessment of the condition of the disk (10).
Quantitative MR aims to interrogate the changes in the relative composition of the constituent macromolecules, i.e., collagen and proteoglycans, of the annulus and nucleus as surrogates for measurement of the degenerative state of the disc. In the healthy disc, the nucleus has for a longer than does the annulus (8,11,12). With increased degeneration, both the nucleus and annulus demonstrate increased variability within the tissues as well as loss of distinction between the tissues (13,14). Ke et al (15) found very good correlation between 1/T2 and water concentration, though Weidenbaum et al (16) found only minor correlation and Chiu et al (17) found none. Both Antoniou et al (18) and Majors et al (19) reported positive correlations between T2 and glycosaminoglycan (GAG) concentration, whereas Weidenbaum et al (16) found no correlation between 1/T2 and GAG concentration. Correlations between T2 and collagen concentration were reported as negative by Antoniou et al (18) and Majors et al (19) and Weidenbaum et al (16) found this correlation to be positive. Thus the relationships between T2 relaxation parameters and the changes in disc structure and composition associated with the degenerative state of the disc remain uncertain.
MR diffusion measurements allow probing of the microstructure of biological tissue by determining the translational mobility of water molecules (20). In vivo, disk degeneration is correlated with a decrease in the apparent diffusion coefficient (ADC) (21,22) and with significant orientation-dependent (anisotropy) reduction in diffusion values (17) independent of the reduction in hydration estimated by T2 measurements (23). ADC measures correlate, in a direction-dependent manner, with disk water, proteoglycan content, and disk matrix integrity (23). In view of the relationship between degeneration of the disk’s tissues and the loss of its mechanical function, the use of diffusion measurements in vivo should be a sensitive and possibly, an early indicator, of disk disease. This preliminary in vitro study investigated the hypothesis that compared with T2 relaxation, diffusion might demonstrate greater sensitivity in detecting the mechanical status of the disk, including the effects of compressive loading. The association between the change in the MR parameters and the disk’s time- dependent mechanical response were determined.
MATERIALS AND METHODS
Specimens
Five human L2–L3 spinal units were obtained from female donors age 39, 65, 69, 72, and 81 years, the spines were radiographed and evaluated by a clinical radiologist (D.B.H.) to exclude bone pathology. The adjacent vertebral bodies were transversely sectioned at mid-height to isolate the disk functional units. The posterior elements were removed and muscle and ligament tissues, excluding the anterior and posterior ligaments, dissected clean. Each disk unit, including adjacent endplates and vertebral bone, was wrapped in saline soaked gauze, sealed in a double nylon bag and stored at −20 C.
Mechanical Characterization
Each disk unit was thawed overnight at 40 C, immersed in 370 C saline for 4 h (24) under a constant force computed to produce 1 MPa (25) applied stress and, using a test device mounted on a hydraulic test system (Interlaken, Eden Prairie, MN), conditioned with 10 compressive (100–300 N, 0.5 Hz) load cycles.
Dynamic Test
The disk underwent 50 cycles of compressive strain (0–9.1%, 1 Hz), simulating endplate deformation under daily loads (26), with the applied displacement and resulting force recorded at a rate of 25 Hz (LabView V.8.0, National Instruments Corporation, Dallas, TX). Dynamic stiffness was computed from the linear portion of the load-displacement curve at the 10th load cycle. For the MR experiment, deformation values at compressive loads of 200 N and 800 N, simulating recumbent and fully upright positions (25), were measured from the 50th load cycle.
Stress–Relaxation
A constant displacement, computed to impose 9.1% strain, was applied and held for a period of 4500 s, with the change in axial force response recorded at 1 Hz. A three-element Kelvin model (Eq. (1)), fitted to the stress–relaxation curve using a nonlinear algorithm (JMP 8.0, SAS, NC), yielded the following rheo-logical parameters: the elastic (E1) and viscous (E2) stiffness and the viscosity (h1).
| [1] |
MR Experiment
An imaging chamber (Fig. 1), fabricated to fi within a 72-mm birdcage coil (Bruker Inc., Billerica, MA), was used for disk imaging within a 4.7 Tesla (T) horizontal bore magnet (BioSpec, Bruker BioSpin Inc., Billerica, MA). A brass screw threaded to the chamber’s top endcap allowed the application of compressive displacements to the disk within the magnet that were pre-calibrated from the mechanical test (Table 1).
Figure 1.
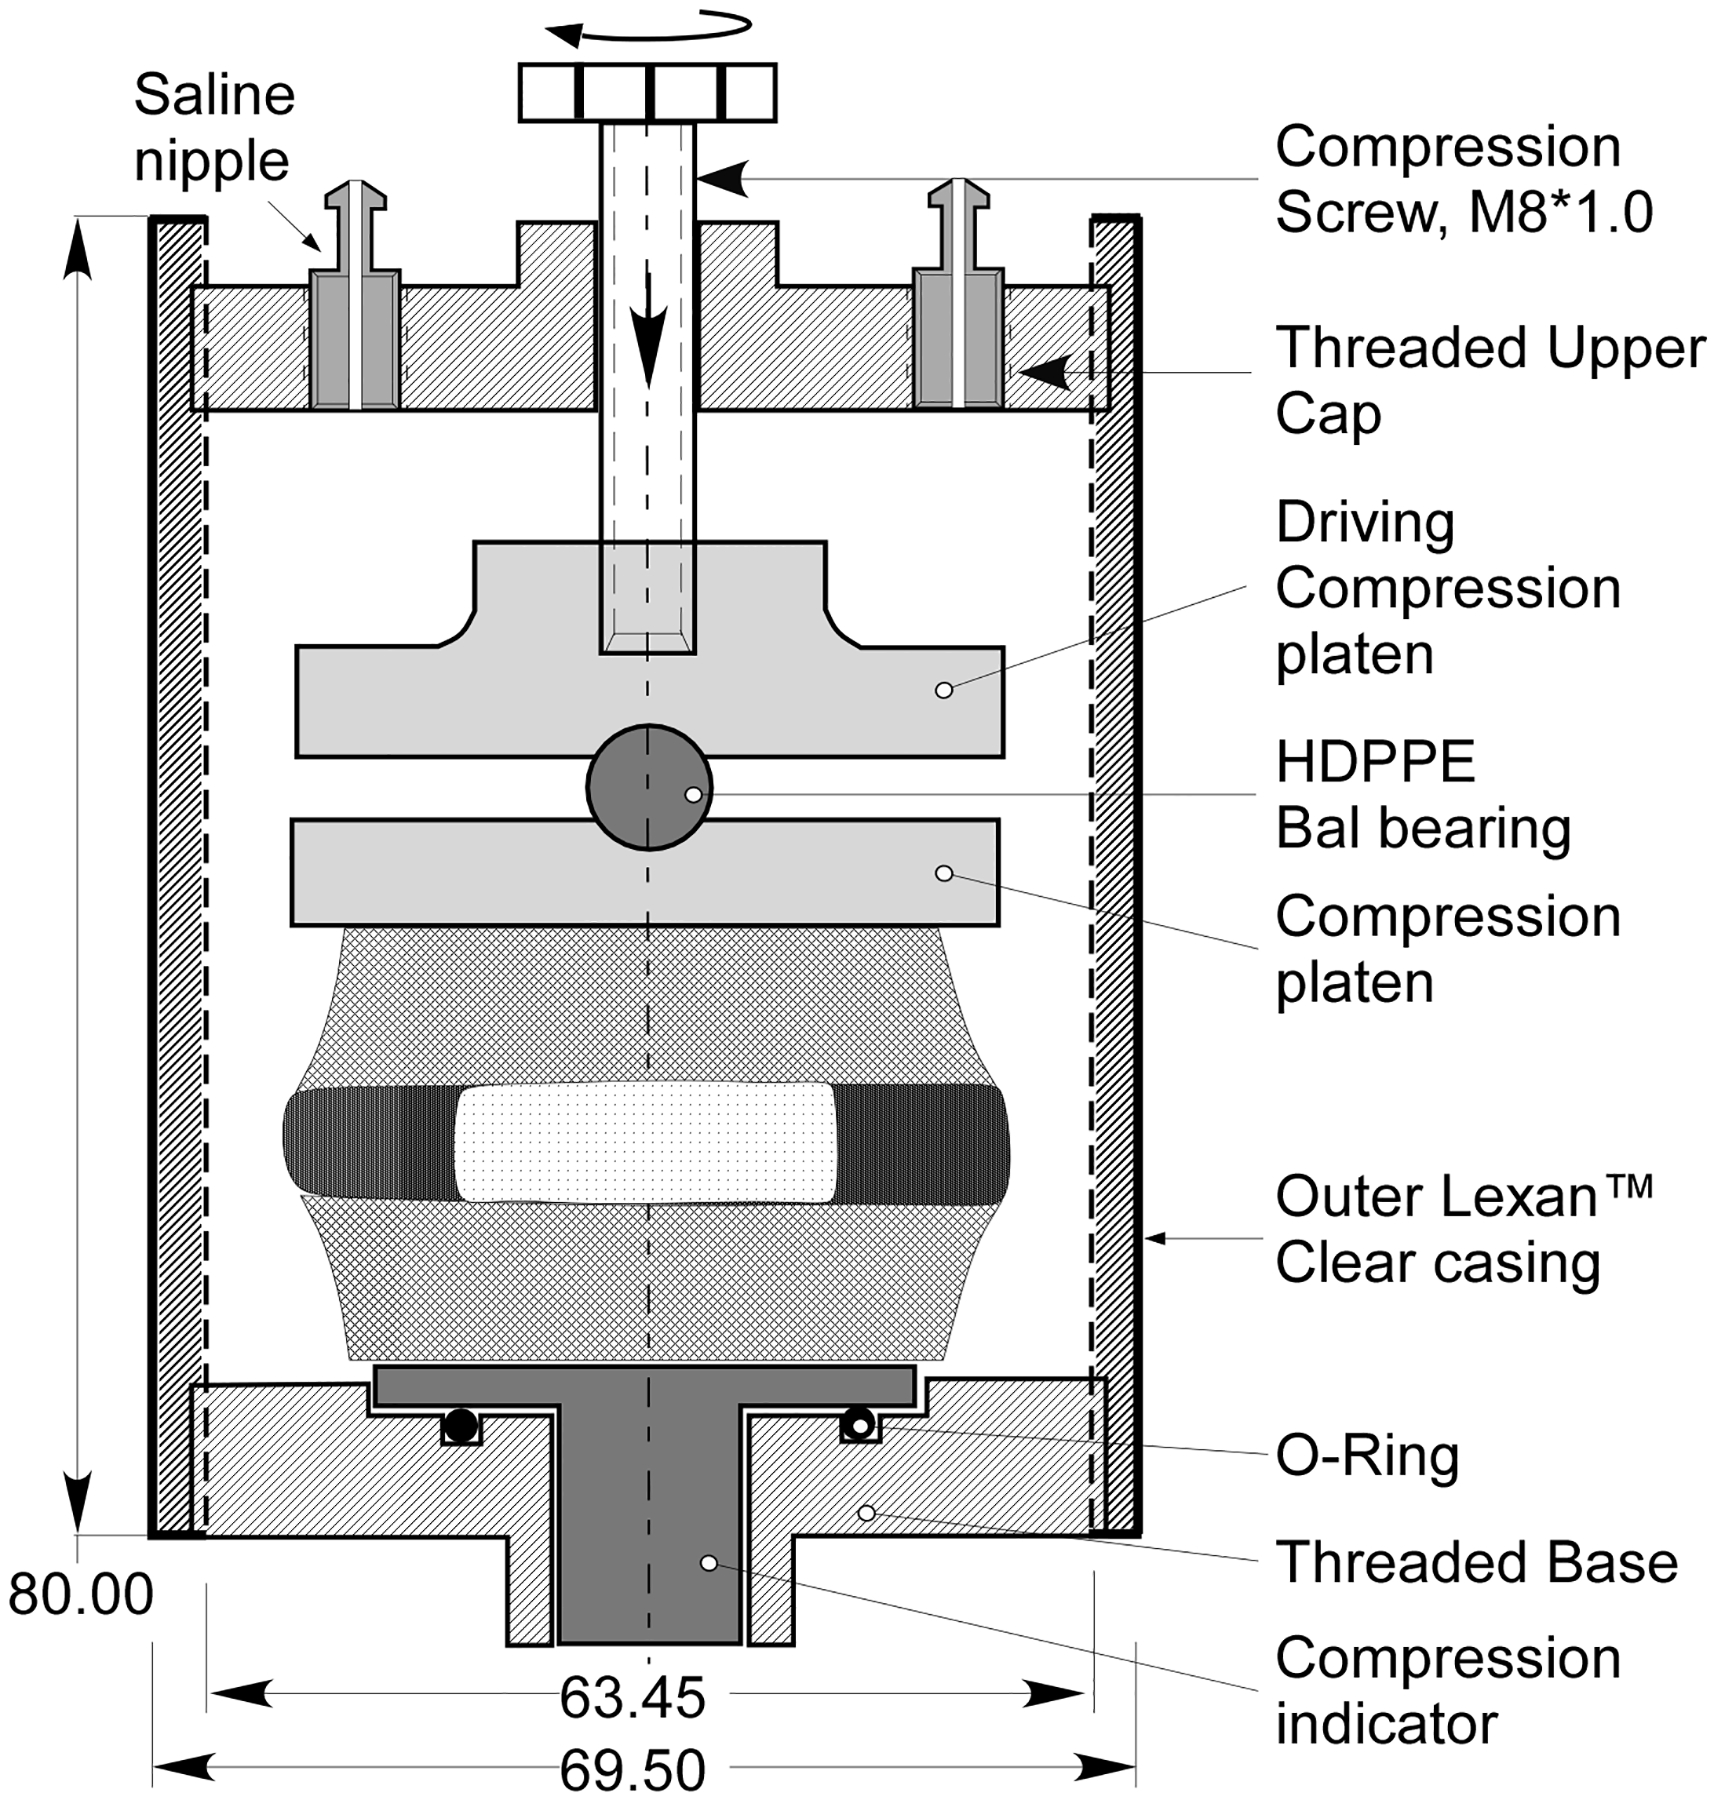
A diagrammatic illustration of the MR mechanical imaging chamber. The brass screw (diameter of 10 mm, 1 mm pitch) is used to apply a displacement calibrated to pro- duce a loading of 200 and 800 N to the disk.
Table 1.
Displacement, hydration state and mechanical properties of the disc by age, grade of degeneration and compressive load.
| Age | Grade | Displacement (mm) | Hydration State (TE0: tissue / saline) | Mechanical characterization | |||||||
|---|---|---|---|---|---|---|---|---|---|---|---|
| Nucleus | Annulus | ||||||||||
| 200N | 800N | 200N | 800N | 200N | 800N | SD | E1 | E2 | η1 | ||
| 39 | II | 0.38 | 0.62 | 1.13 | 1.20 | 0.88 | 0.84 | 4430 | 5.84 | 16.5 | 2.31 |
| 65 | III | 0.51 | 0.84 | 1.04 | 1.10 | 1.01 | 1.04 | 2050 | 5.05 | 6.5 | 1.11 |
| 69 | III | 0.48 | 0.78 | 1.07 | 1.03 | 0.77 | 0.89 | 2300 | 5.27 | 8.43 | 1.35 |
| 72 | III | 0.71 | 1.09 | 1.03 | 1.00 | 0.99 | 0.93 | 1630 | 3.68 | 6.29 | 1.08 |
| 81 | IV | 0.90 | 1.35 | 0.74 | 0.72 | 0.91 | 1.07 | 1050 | 2.16 | 4.6 | 0.95 |
Grade: Degenerative state classified in accordance to the T2 relaxation scheme proposed by Watanabe et al, 42. Displacement: Displacement applied to the disc for the MR experiment. SD (N/mm): Dynamic stiffness computed from the linear region of the loading phase at the tenth load of the compression cyclic test. E1 (Mpa): Instantaneous stiffness. E2 (Mpa): Long term stiffness. η1 (N/sec2): Damping coefficient.
Imaging
The chamber was filled with saline, the disk allowed to equilibrate for 30 minutes and the tare load resulting from the rehydration removed. A displacement, calibrated from the mechanical load-displacement curve test to yield a 200 N compressive load (Table 1) was applied via the screw and the chamber positioned with the disk’s cranial–caudal and sagittal axes aligned with the magnet’s Z and X axes. Once a period of 40 minutes from the application of displacement elapsed (yielding a near equilibrium in the stress– relaxation response of the disk, (Fig. 2), an axial image was obtained at the geometric center of the disk (field of view, 60 mm; matrix, 1282; slice thickness, 2 mm; 47 mm per pixel) for the following protocols: T2, CPMG sequence with 32 echoes with repetition time (TR) = 5000 and echo time (TE) of 7ms to 224 ms with 7 ms echo spacing.
Figure 2.
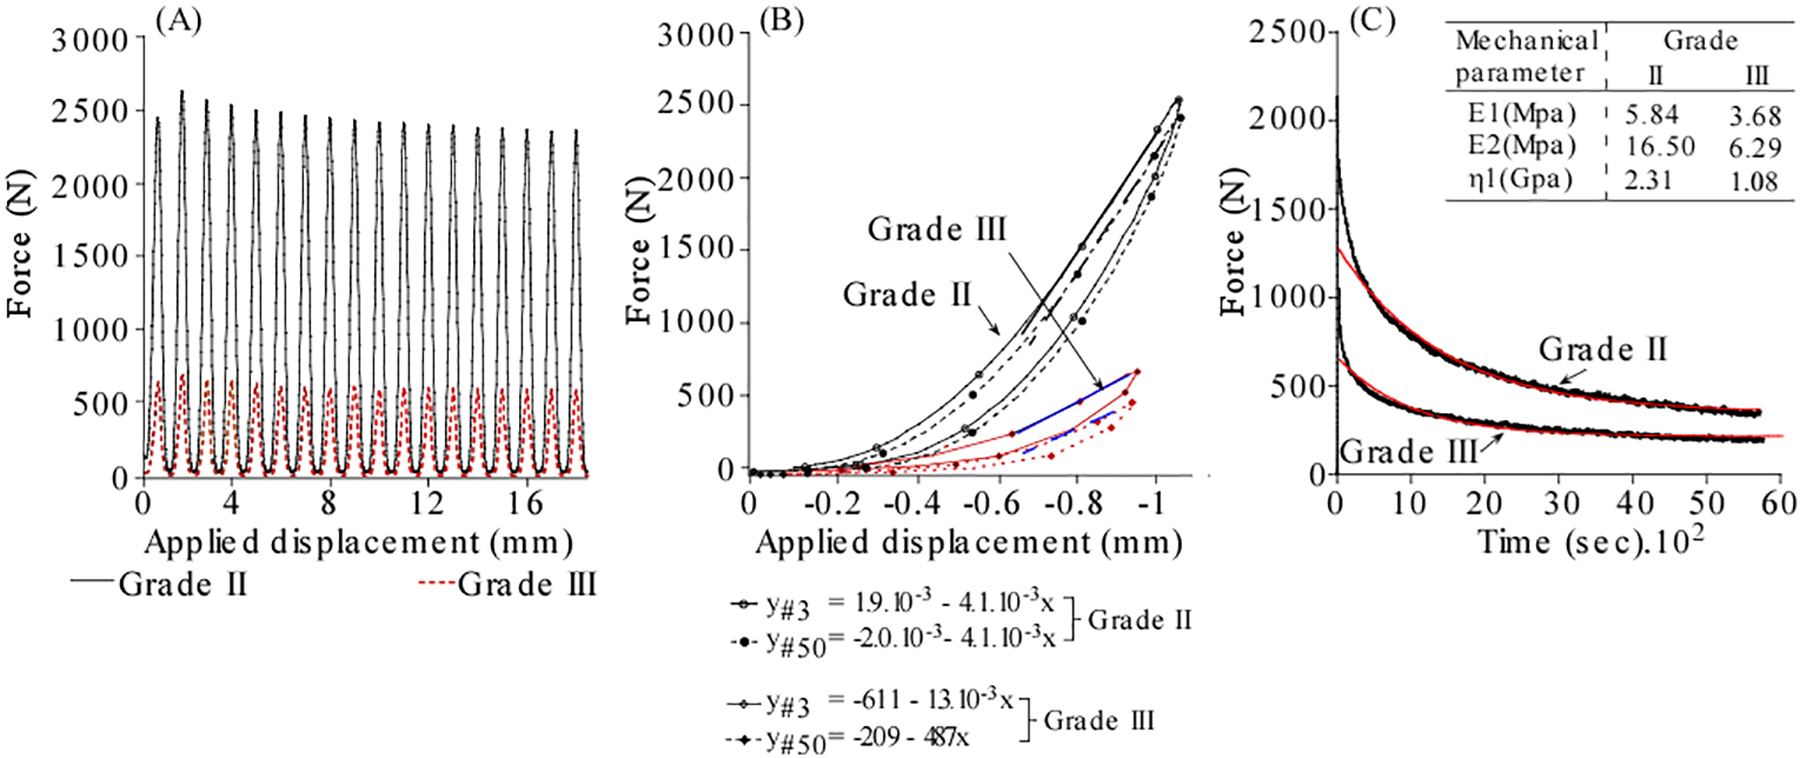
Comparison of the cyclic and time-dependent response and corresponding analysis for a grade II and 72 year old grade III disks.
Diffusion-Weighted Imaging
Diffusion-weighted spin echo experiment with TR/ TE = 2000/26ms, d (diffusion gradient duration) = 7 ms and D (diffusion gradient separation) = 14 ms was applied with the diffusion sensitization gradients applied in the direction of the main axes of the magnet ([1,0,0], [0,1,0], [0,0,1]). The b-value was calculated as [b = 3 (γδγ)2-(Δ−δ/3)] (27)], with: γ: gyromagnetic ratio, G: gradient strength, δ: gradient length, Δ: diffusion time) yielding b-values of (100, 400, 700, 1000) mm2/s. On completion of this imaging, a second pre-calibrated displacement (800 N, Table 1) was applied and the MR experiment repeated after a period of 40 min. To account for disk deformation, the image plane was moved superiorly by half the difference between the final (800 N) and initial (200 N) applied displacements.
MR Relaxometry-Based Assessment of Disk Hydration
The water content of each disk (Htisssu) was estimated by normalizing proton density (PD) values, computed for regions of interest (ROIs) selected in the nucleus and the annulus, with mean values obtained for ROIs within the surrounding saline (Fig. 3). For each ROI selected, a mono exponential function [abs(M0*exp(− TE/T2)] was fitted on a pixel by pixel basis (Matlab 2009b, Mathworks, MA) to the vector of 32 echoes and the fit extrapolated to TE = 0ms. Htisssu was computed from the mean intensity values of ([tissue ROI (TE = 0 ms] / saline ROI [TE = 0 ms]). To compute the change in hydration under load, the deformed disk was co-registered to its initial load condition, the ROIs superimposed on the registered image and the procedure to estimate relative hydration repeated.
Figure 3.
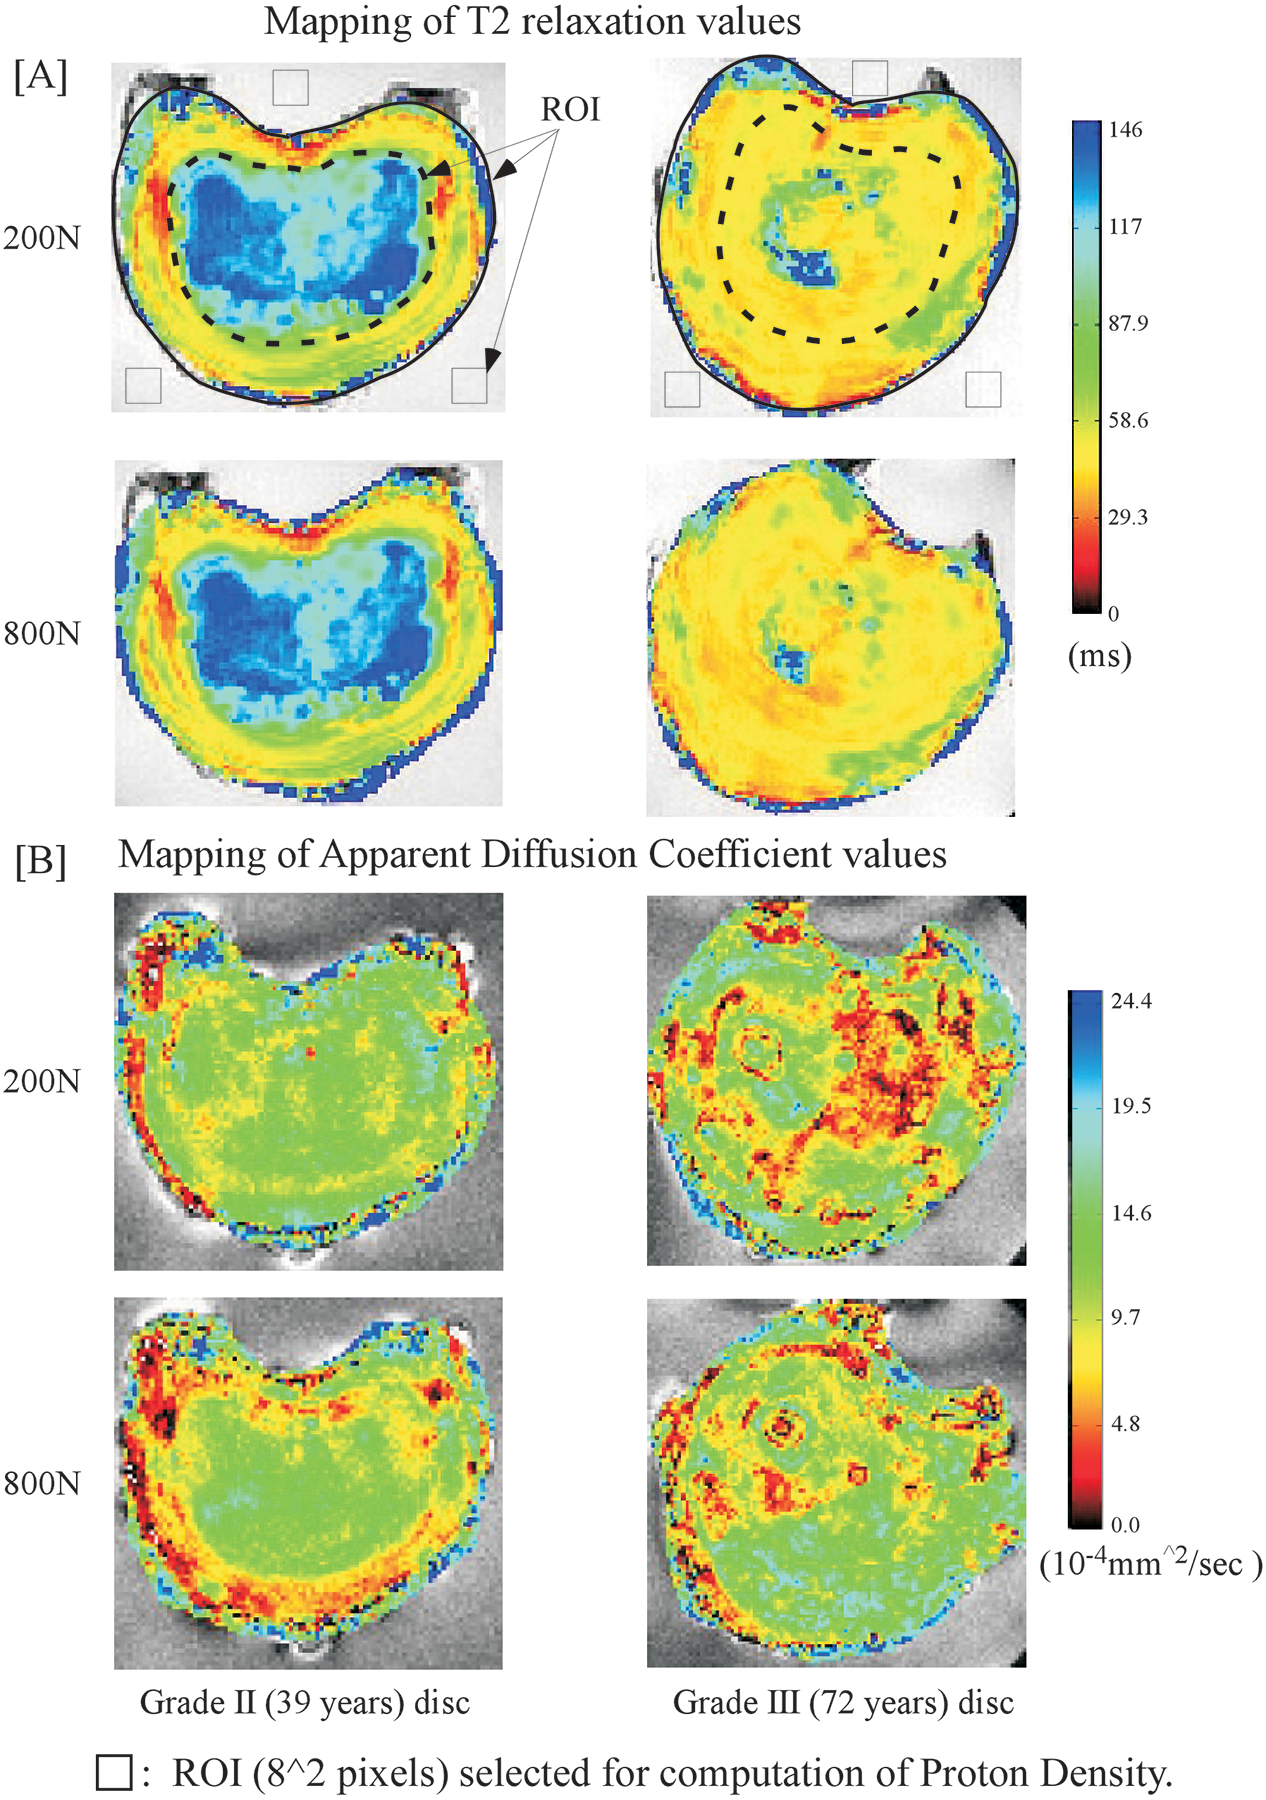
Comparisons of the spatial maps obtained for T2 (A) and diffusion (B) values for the Grade II and the Grade III (72 year old) disks at 200N and in response to 800 N loading states. Segmentation templates used to obtain (8*8) pixel Region of Interests for computation of estimated hydration state within the nucleus, annulus and saline regions are illustrated.
Data Analysis
The annulus and nucleus were segmented (MRmapper, v.7.0, Center for Basic MR Research, Beth Israel Deaconess Medical Center, Boston, MA) in the T2 images with each tissue ROI further bisected along the sagittal and coronal planes, yielding eight ROIs per image. In accordance to the criterion by Watanabe et al (28), the degenerative state of the disc was classified from the T2 maps (DHB). For each load state, spatial maps were produced for T2 and ADC values (MRmapper) and the mean and Coefficient of Variation, ([standard deviation/mean]*100) computed per ROI.
Statistical Analysis
For each MR metric, repeated measure multivariate analysis of variance (JMP 8.0, SAS, Cary, NC) was used to test for the effects of loading, tissue (nucleus versus annulus) and anatomical location on the change in either the mean or coefficient of variation (COV) as main effects. The model further tested whether specific tissue (nucleus versus annulus), anatomical location and, for ADC parameters, axis of measurements (anisotropy), affected the change in MR parameters under applied load. Tukey’s Honestly Significant Difference was used to test for significance between individual parameters with the significance set at a 5% level. Analysis of covariance was used to test whether the disk hydration state significantly affected the change in each MR metric. Linear models were used to assess the association between the change in MR parameters, the disk’s mechanical properties and its MR derived tissue hydration. All reported percent changes are computed as the relative change in either mean or COV value as specified in the results section.
RESULTS
The lumbar disks in this study were classified as degenerative grade II to IV, Table 1, (28). Increased disk degeneration was associated with a reduction in mean T2 (grade III: _44.3% and grade IV: _31.5%) and ADC (−18.2% and −27.7%) while COV values increased for T2 (81% and 245%) and ADC (54.3% and 89.0%) respectively, Figure 4. Independent of the degenerative grade, clear tissue-based differences were observed for both MR parameters (Fig. 5) as well as estimated hydration (Table 1). Compared with the nucleus, the annulus exhibited significantly lower mean ADC values (−21% to _4%, P < 0.01) and higher COV values for both T2 (108–440%, P < 0.05, Fig. 4) and ADC (3 to 103%, P < 0.05). Though T2 values in the annulus significantly differed from those of the nucleus (P < 0.01, Fig. 5), the differences varied greatly with degenerative grade (−51% in grade II disk to þ94% in Grade IV disk), and may have been affected by the inhomogeneity of the degenerated disks. Within the annulus, the posterior region showed significantly lower mean (9.2%) and higher COV (7.2%) of ADC compared with its anterior region (P < 0.05 respectively, Fig. 5). No such regional differences were observed for the nucleus. In the nucleus, MR-based estimation of tissue hydration decreased with a higher degenerative grade (7% [grade III] and 34.5% [grade IV], Table 1). No consistent trend was observed for the annulus.
Figure 4.
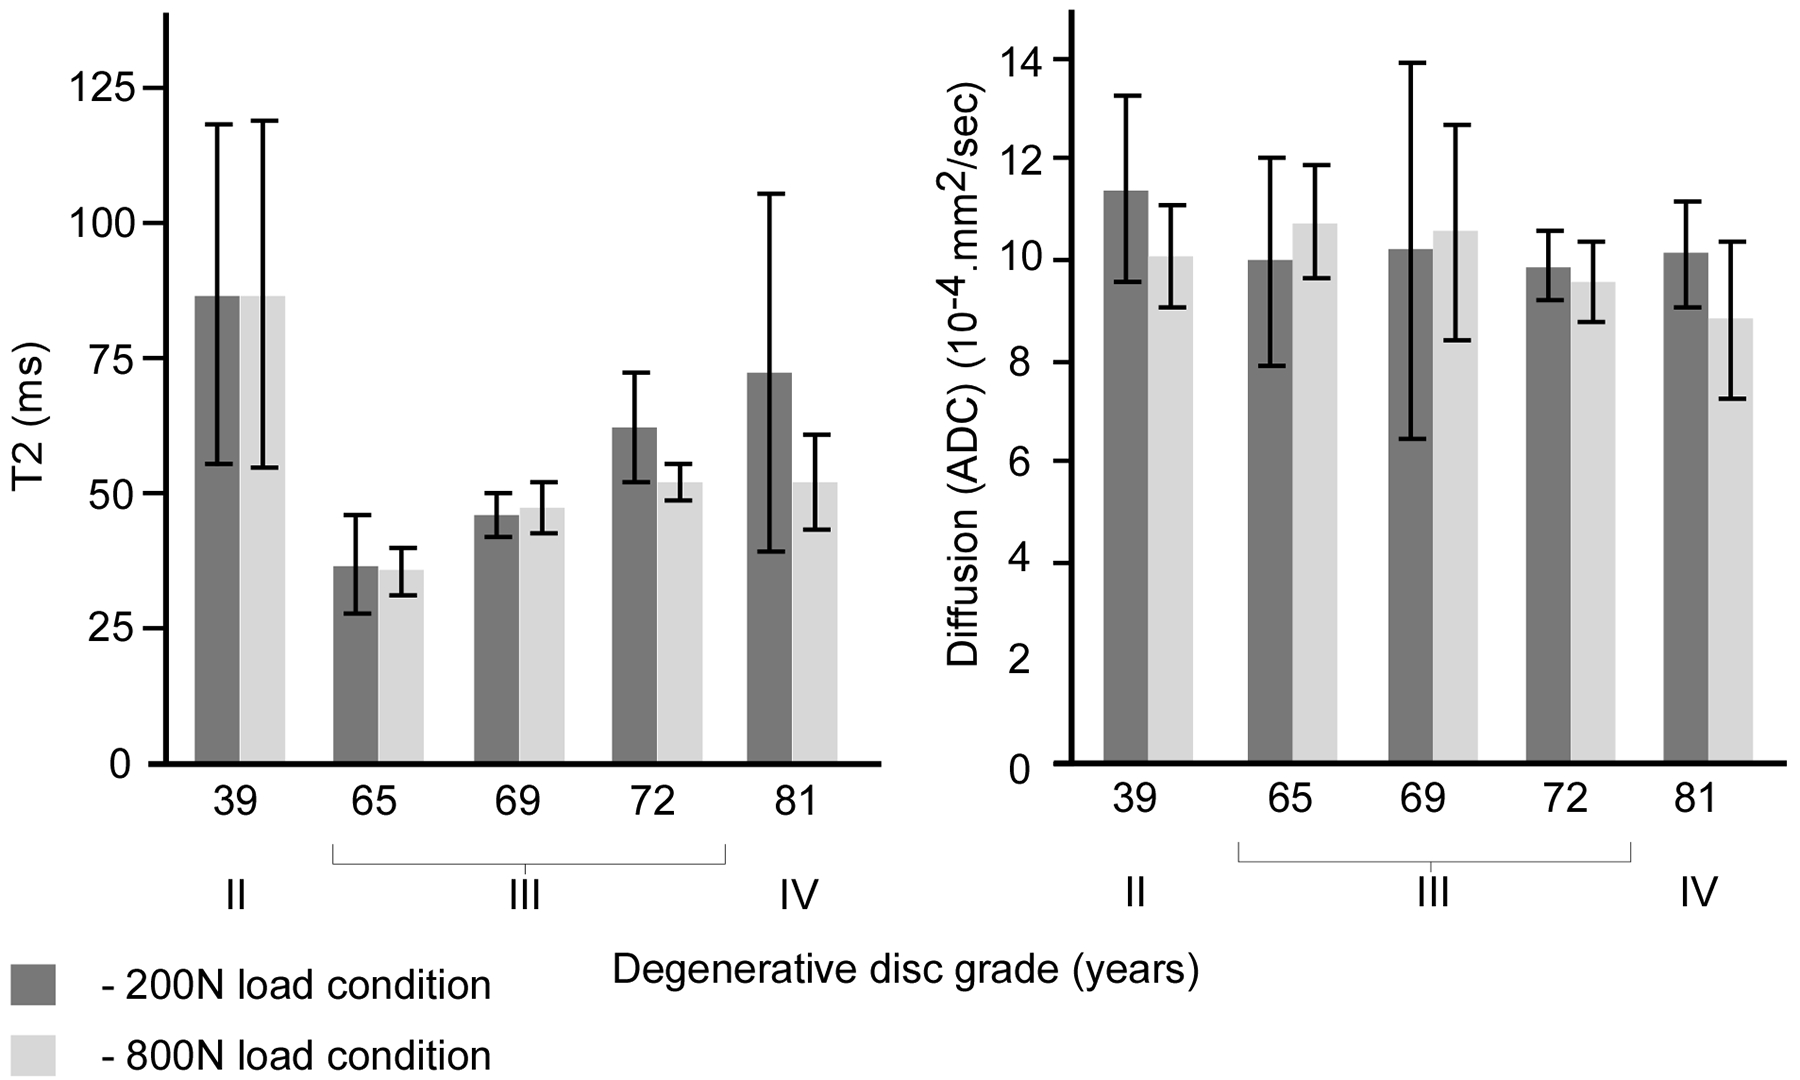
The effect of loading on the change in mean and variance of T2 and ADC measurements for the disks as classified by their degenerative grade.
Figure 5.
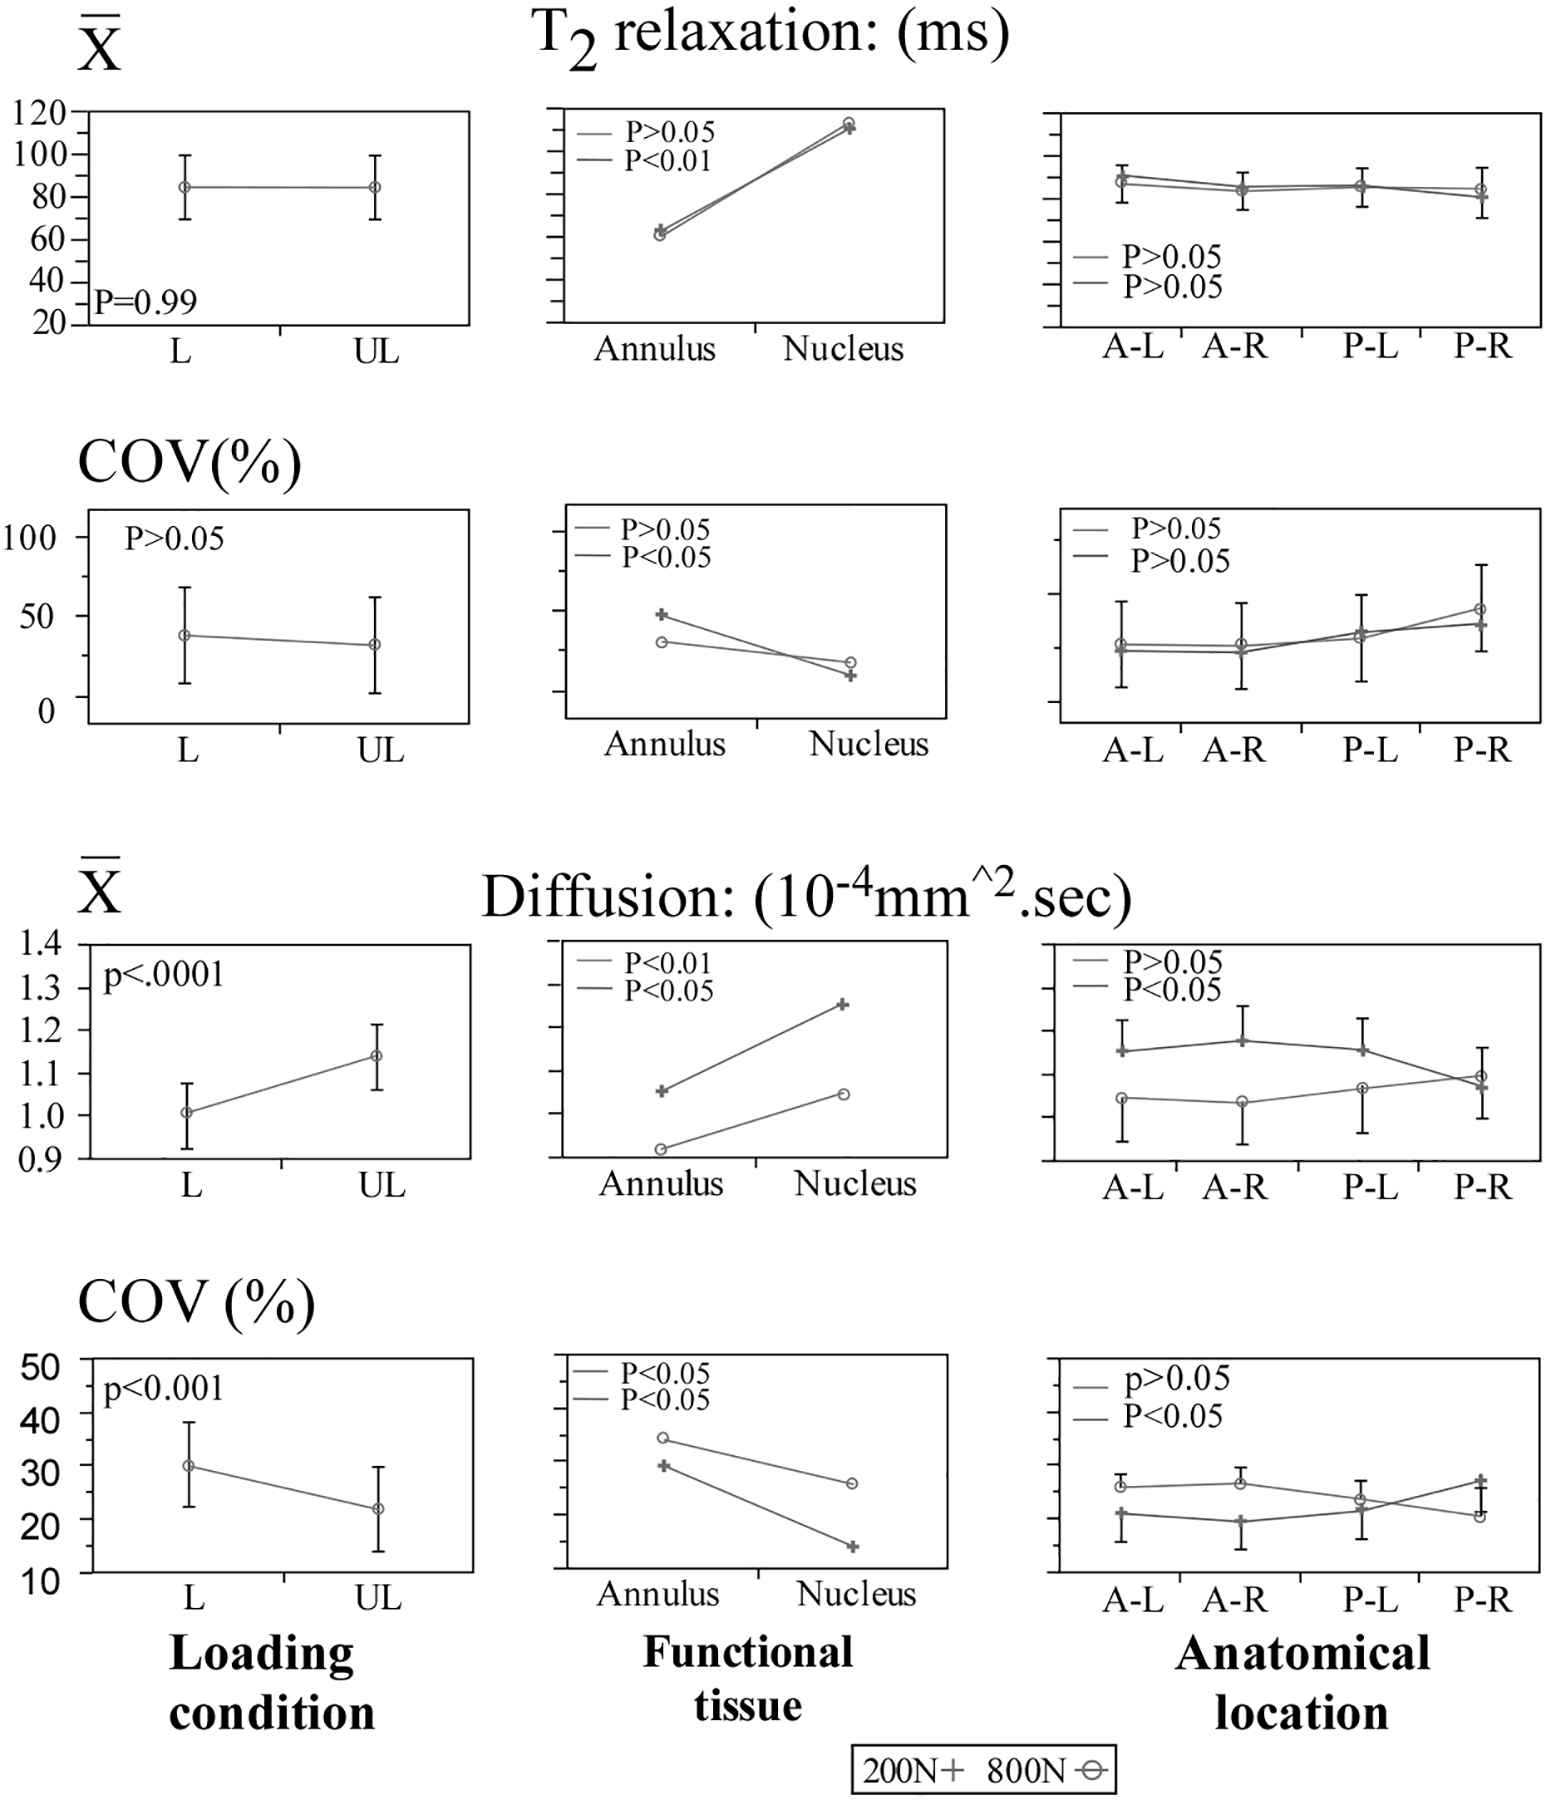
Statistical comparisons for the effects of Loading state, Age, Functional tissue (nucleus versus annulus) and location of measurement (main effect) on the mean the coefficient of variance parameters computed for the T2 relaxation and Apparent Diffusion Coefficient values.
Effect of Loading on T2 and ADC
Considering the entire disk, loading caused a statistically significant lower mean ((11.3 versus 9.7).10.4.mm2/s, P < 0.001) and higher COV ((30.1 versus 22.0) %, P < 0.001) of diffusivity (ADC), Figure 5. No statistically significant change was observed in T2 values for either the mean or COV (P > 0.05, Fig. 5). T2 values were significantly correlated with MR diffusivity at the initial load condition (r2 = 0.66, F < 0.01). No such correlation was observed with increased loading (r2 = 0.04, F > 0.05).
Annulus Versus Nucleus
Figure 6 illustrates the effect of the degenerative grade and loading on the mean T2 and ADC values within the nucleus and annulus. In the nucleus, loading caused significantly lower ADC (25.3% P < 0.01) and higher COV values (42.5%, P < 0.01), Figure 5. These changes were approximately twice those of the annulus, 12.7% and −18.9%, (P < 0.05, respectively). Loading had no significant effect on T2 values (mean or COV) in either tissue.
Figure 6.
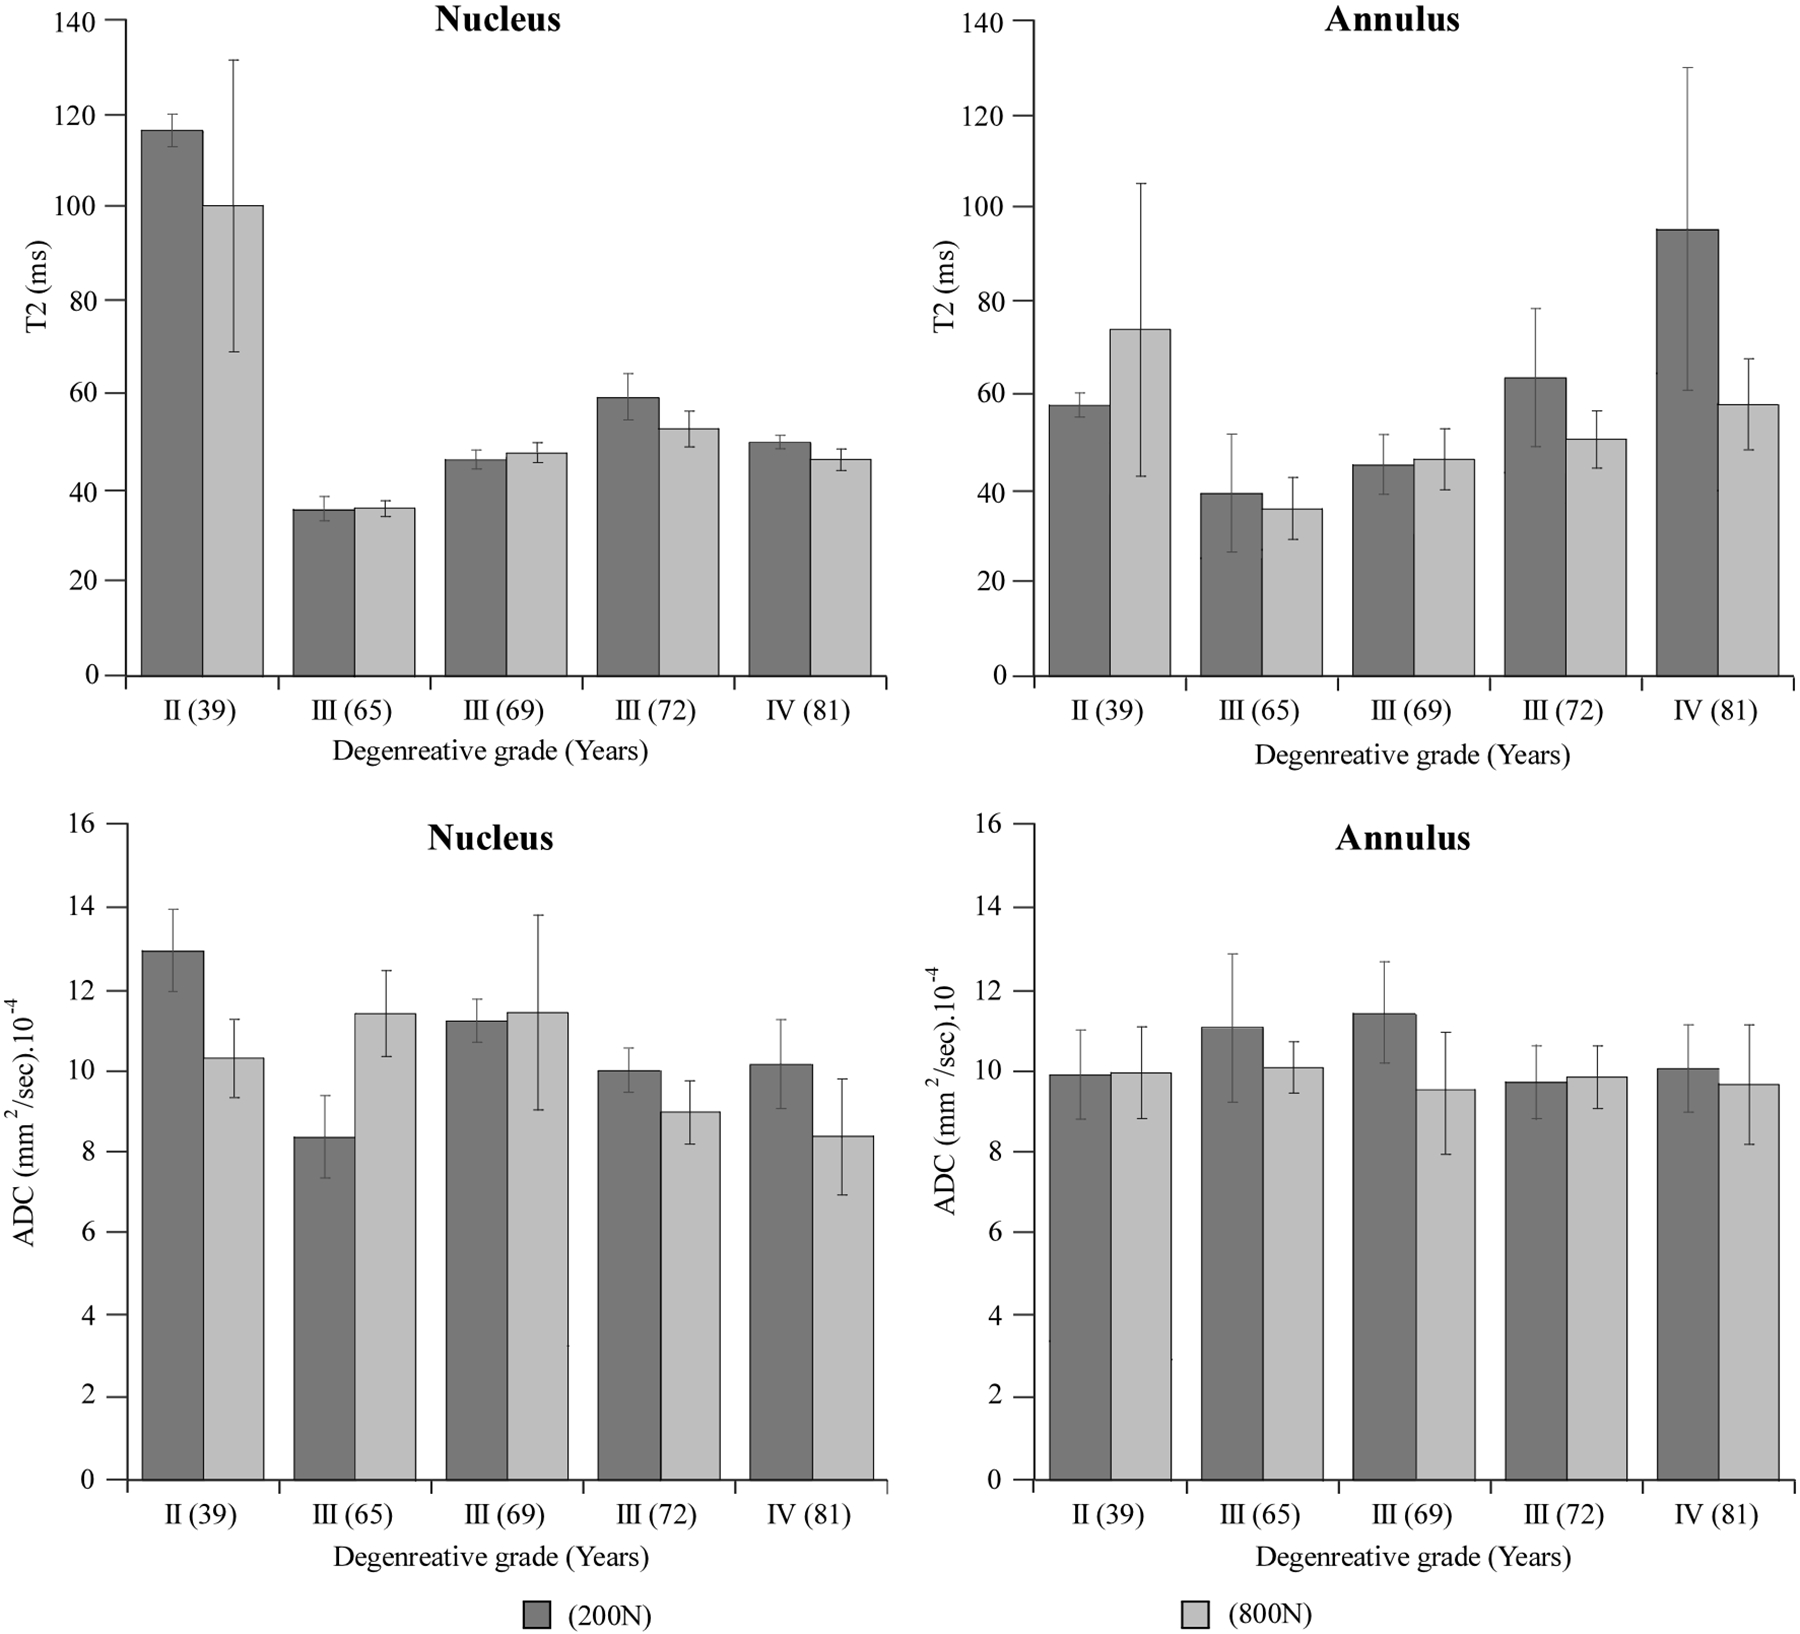
The effect of degenerative grade and loading on the mean T2 within the nucleus and annulus tissues.
Regional Effects
In comparison to its anterior region, the disk’s posterior region showed 14.5% lower mean and 21% higher COV of ADC under loading (P = 0.08, Fig. 5). No such differences were observed for the T2 (Fig. 7).
Figure 7.
Statistical comparisons for the effect of anatomical axes of measurement for the complete disk joint (main effects) and the interaction of MR axes with Loading state and tissue type (nucleus versus annulus) on the change in mean and variance measures computed for Apparent Diffusion Coefficient values.
Axis of Measurement (ADC)
In the complete disk, mean diffusivity in the Z axis(cranial–caudal) was significantly higher compared with its transverse plane (X and Y axes), ((Z:11.0 > X:10.7 < Y:10.5).10−4.mm2/s, P < 0.05). No such differences were found for the variance (COV). Neither loading nor tissue type (nucleus versus annulus) had a significant effect on diffusivity as a function of measurement axis (P > 0.05).
Mechanical Characterization
Compared with the grade II disk, the grade III and IV disks exhibited significant deterioration of dynamic stiffness (a mean loss of 93% and 283%, Table 1). The rheological model similarly showed a corresponding loss of stress relaxation response with 32.7% and 170% lower instantaneous stiffness (E1), 95% and 259% lower viscous stiffness (E2) and 70% and 143% lower dampening coefficient (η1), Table 1. The reduction in the disk’s MR estimated hydration state was significantly correlated with the reduction in the disk’s dynamic (r2 = 0.66, P < 0.05) and instantaneous (E1: r2 = 0.89, P < 0.01) stiffness. Estimated hydration was not significantly correlated with either the long-term stiffness (E2) or the damping (η1) parameters.
Relationship of MR Parameters With Mechanical Properties
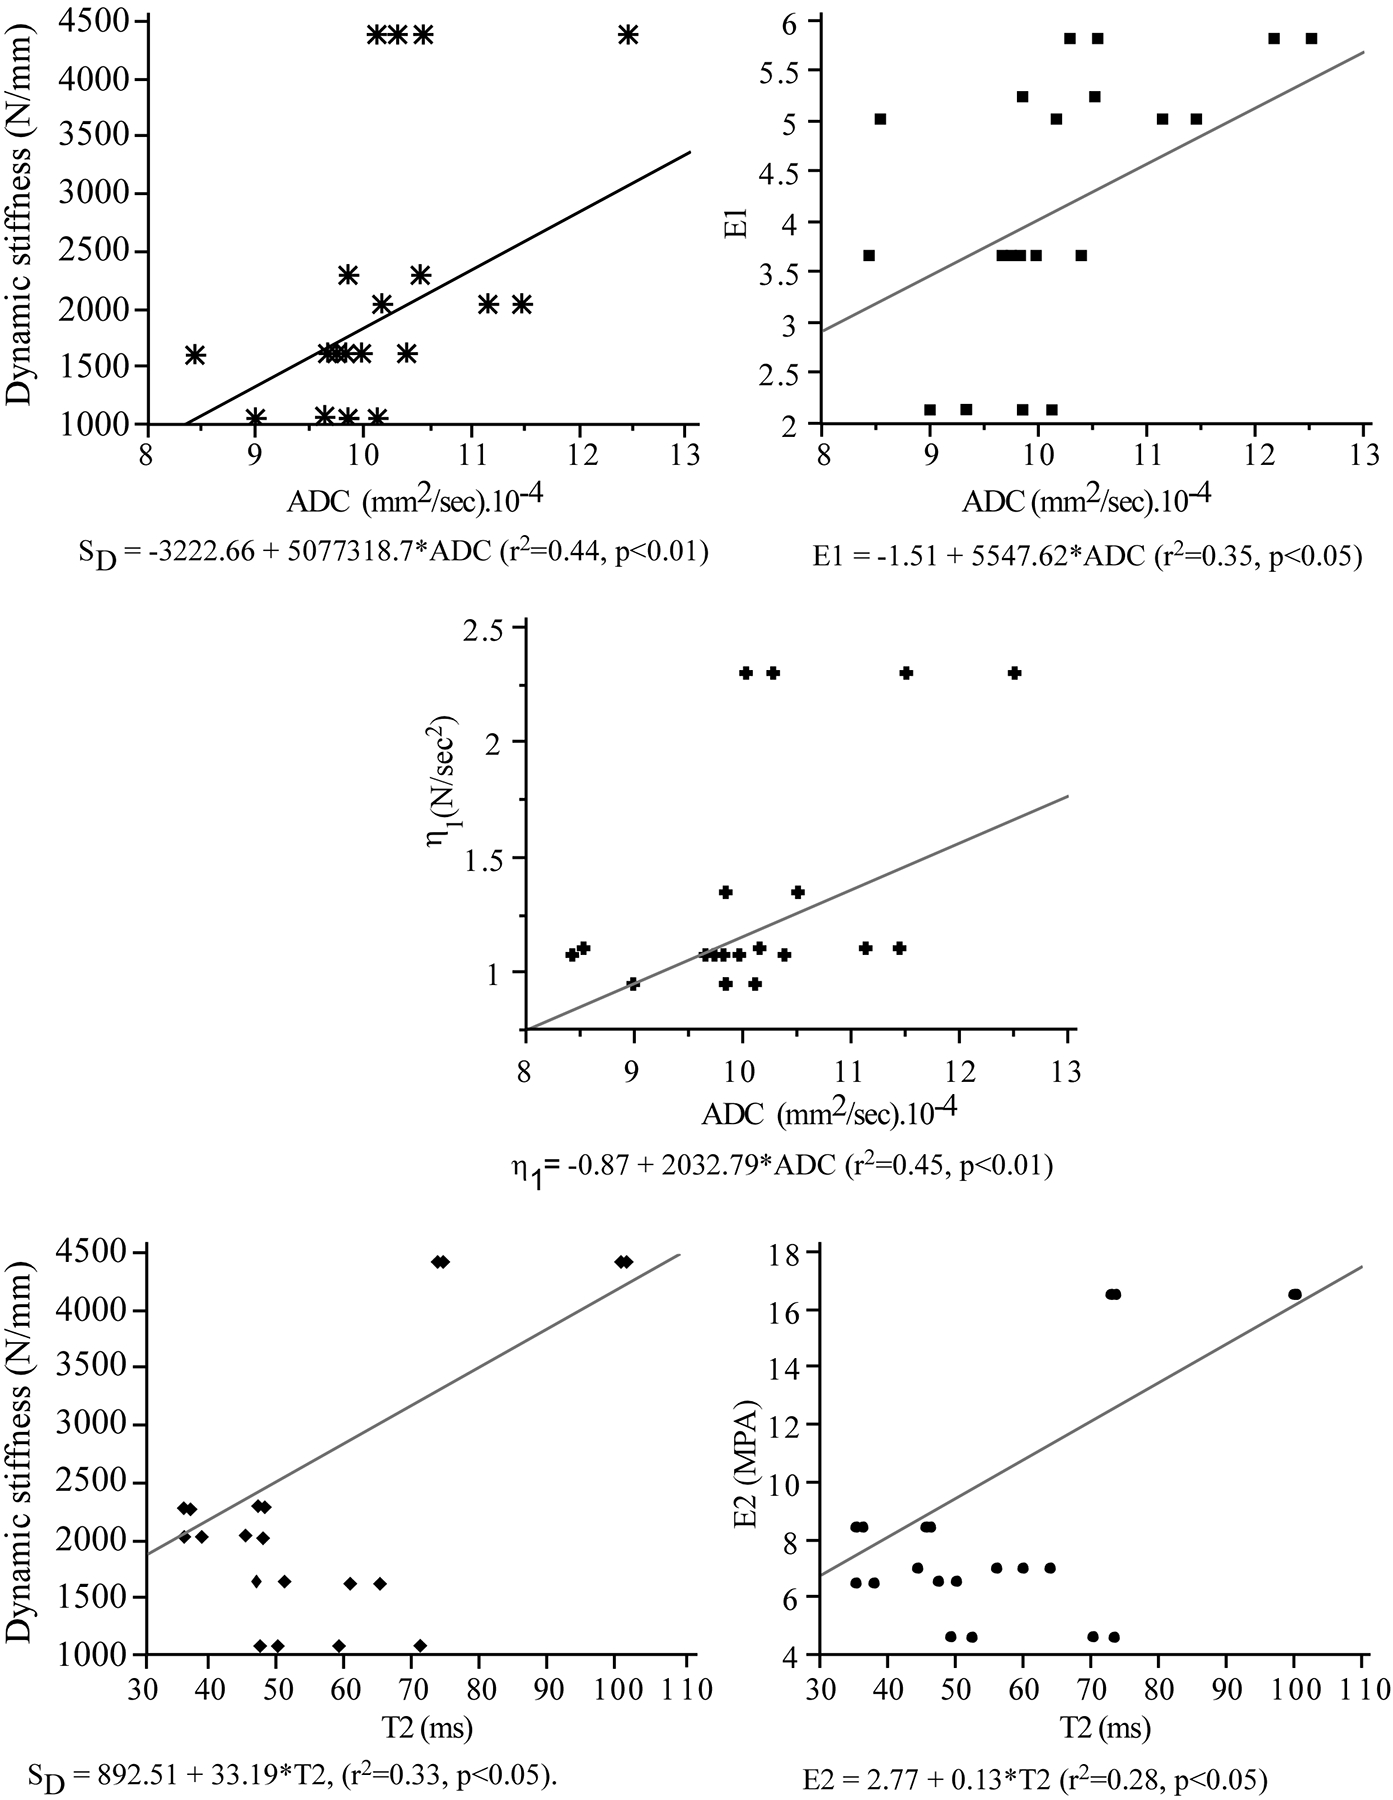
Figure 7 presents the correlations between MR metrics and the mechanical parameters computed from the dynamic and viscoelastic response of the disks. T2 was moderately correlated with dynamic (SD, P < 0.05) and long-term viscoelastic (E2, P < 0.05) stiffness, Table 2. ADC correlated strongly with dynamic stiffness (SD, P < 0.01) and viscoelastic damping coefficient (η1, P < 0.01) and was moderately correlated with instantaneous (E1, P < 0.05) and long- term viscoelastic (E2, P < 0.05) stiffness parameters (Table 2). Within the nucleus, higher Htisssu was correlated with instantaneous viscoelastic stiffness (E1, r = 0.35, P < 0.05). Within the annulus, higher Htisssu was correlated with dynamic (SD, r = 0.44, P < 0.05) and long-term viscoelastic (E2, r2 = 0.42, P < 0.05) stiffness.
Table 2.
Correlation of MR parameters with the mechanical properties of the whole disc under compression.
| MR metric | Mechanical property | Compressive Loading |
|---|---|---|
| T2 | Dynamic Stiffness (SD) | r2= 0.33, P < 0.05 |
| Instantaneous stiffness (E1) | P > 0.05 | |
| Long term stiffness (E2) | r2= 0.28, P < 0.05 | |
| Damping coefficient (η1) | P > 0.05 | |
| ADC | Dynamic Stiffness (SD) | r2= 0.44, p <0.01 |
| Instantaneous stiffness (E1) | r2= 0.35, p <0.05 | |
| Long term stiffness (E2) | r2= 0.30, p <0.05 | |
| Damping coefficient (η1) | r2= 0.45, p = 0.01 |
T2: (ms). ADC: (10−4.mm2/sec). SD: Dynamic Stiffness computed from the linear region of the loading phase at the tenth load of the compression cyclic test. Rheological parameters were computed from the viscoelastic model; E1(Mpa): Instantaneous stiffness. E2 (Mpa): Long term stiffness. η1 (N/sec2): Damping coefficient.
DISCUSSION
Although the etiology of low back pain is multi-factorial, both the degenerative changes in the composition of the disk (29) and the concomitant loss of hydration and osmotic pressure (30), are linked to this disease (1). The resulting loss in the disk’s static, dynamic, and viscoelastic mechanical performance (31,32), affects the disk primary role as a mechanical joint (33). In view of the intimate relationships between ultra-structure and composition with mechanical function (34,35), this in vitro study investigated the hypothesis that the apparent diffusion coefficients offers greater sensitivity than T2 for detecting the response of intervertebral disk to the application of loading. We further examined whether these relationships differed for the nucleus and annulus, with the severity of degeneration and, for the diffusion measurement, axis of measurement.
In vivo, the mapping of T2 relaxation values was reported to detect specific pathology, i.e., herniation and annular tears (36) and structural changes within the annulus and nucleus (37) and to be sensitive to changes in water content (8) and the arrangement of collagen fibers in disk tissues (11) in vitro. Although T2 values for the grade II disc were found to be markedly higher than that of grade III and IV, application of loading had little effect on T2 relaxation independent of degenerative grade. This finding is in agreement with previous studies reporting the application of creep (17) and stress–relaxation (38) -based loading to have little effect on T2 values within the disk.
By contrast, loading yielded highly significant decreases in the magnitude of diffusivity and increases in its variance independent of the grading classification of the disks. Furthermore, in contrast to the T2 values, diffusivity values were strongly correlated with the rheological parameters describing the viscoelastic response of the disk. In vivo, reduction in disk diffusivity is associated with degenerative (21), diurnal (39) and compressive (40) changes. In vitro, the application of compressive loading yielded decreased diffusivity in the isolated nucleus (23), had little effect in a bovine disk stress–relaxation model (38) while showing an increase under constant compressive loading (creep test) in human disks (17). These varying results, likely the result of the differences in vitro models, loading history and testing methods, highlight the early nature of studies of disk diffusion as a surrogate measure for disk status. It is, however, well established that degeneration has different effects on the structure and mechanical response of the annulus versus the nucleus (41). These differences in structure and composition, give rise to nonlinear stress-strain deformation patterns (42). Quantitative MR studies of nucleus samples have shown ADC to correlate with measures of structural integrity (8,23), hydraulic permeability, and compressive modulus (43). Strong association was found between diffusivity and estimated tissue hydration in response to loading. Although it is clear that there is variation in the mechanical properties that is not explained by the diffusion coefficients alone, these preliminary results suggest that diffusion imaging may provide a mechanism to predict the mechanical response of human disks. There remains a need for a tissue specific model to better understand the relationships between the degenerative status of the disk as assessed by imaging and its capacity as a mechanical joint.
Our finding of an axis-dependent diffusivity, being the highest along the cranial–caudal axis of the disk, is in agreement with the finding of Chiu et al (17) for whole disk specimens and Hsu and Setton (44) for annulus tissue. This difference may reflect the matrix alignment within the nucleus which correlates with the nutritional diffusion pathways known to largely depend on the vertebral end plates and to a lesser degree on the annulus (45). The minor differences in the X and Y axes spanning the plane parallel to the transverse plane of the disk, likely reflects the symmetry in the alternating orientations of collagen bundles within the lamellar structure of the annulus (46). Disk dehydration has been reported to be associated with increased degeneration state and the loss of the disk’s load carrying capacity (47). In agreement with previous reports on the change in T2 and diffusivity (8) with the increase in disk degeneration, this study has shown the estimated hydration to be negatively associated with the disk’s degenerative grade. Furthermore, this study has demonstrated the increased instantaneous viscoelastic stiffness for both the nucleus and annulus (Table 1) and for long-term viscoelastic stiffness in the annulus, to be strongly associated with the increase in MR estimated water. This finding appears to support the role of desiccation within the nucleus as a mechanism for the loss of the disk’s short-term mechanical performance and the role of the annulus in contributing to the long-term load carrying of the disk.
In assessing the finding of this preliminary study, several limitations must be considered. Although the disks included, graded as II to IV, span the range seen in adult patients, our sample size is small and thus we may have missed important relationships that may have been found to be significant in a larger study. For this reason, we have focused our attention of these associations that were significant even with our small numbers. In daily activities, the spine is exposed to complex time varying loading interposed by periods of constant load (creep) (33). The choice of loading protocol (stress relaxation) was driven by practicality, as maintaining a constant load (creep) during the imaging requires continuous actuation and monitoring of the loading system within the MR environment. The transport of fluid as well as the change in the tissue’s modulus and permeability, were shown to differ under the application of creep versus stress–relaxation (48). Under constant load, fluid is continuously expelled from the disk yielding increased compressive modulus and reduced permeability within the tissues suggesting a reduction in the rate of diffusivity with the tissue. By contrast, under stress relaxation, the modulus of the tissues decreases with the tissues hydraulic permeability remaining unchanged due to the constant imposed deformation (48), causing re-imbibing of water once the initial effects of imposed deformation have dissipated. Although the viscoelastic parameters defining the material properties of the tissue should be invariant to the loading history, the nonlinearity introduced due to different water flow mechanisms and changes in proteoglycan structure preclude a direct comparison between the two loading regimes. Current work in our group, enabling both computer-controlled loading within the MR and the use of diffusion tensor protocols, aims to alleviate these limitations and investigate the effects of the loading regime on MR diffusivity within the disk. For our stress-relaxation–based loading protocol, two load states simulating recumbent and standing conditions were used (25). Though clearly not spanning the range for adult spines, let alone reproducing the loading that would have been present in these subjects during life, these values represent two common daily activities.
The work was conducted in cadaver spines, rather than in vivo, as the use of cadaveric tissue permitted detailed and controlled assessment of disk mechanics that would not have been possible in vivo. It is certainly possible that the viscoelastic responses of the cadaver spine at room temperature differ from those at body temperature in vivo. It is also likely that muscular activity and the contribution of the posterior elements will influence the mechanical parameters that would be observed in living subjects. Pursuing these effects would require in vivo studies, with resulting limitations in the mechanical testing that could be performed. We note that the disk, with its profoundly low blood flow and metabolism, shows far less change from in vivo to the cadaver than would be the case for most other tissues. Although technically alive, the in vivo disk is remarkably well modeled by a cadaver specimen.
Both the diffusivity of water within soft tissues (49) and MR relaxation values (50), will be affected by MR induced changes in the tissue’s temperature. Although we did not directly measure temperature changes within the imaging volume, measurement of diffusivity values at the saline volume around the disc (Fig. 3) showed an increase of approximately 1% between the low load (200N) and high load (800N) acquisitions. Chiu et al in 2001, (17) using a similar MR protocol, reported the temperature rise for this period of time to be approximately 10 C and concluded that the T1 effect on the ADC measurement was minimal (50). We further note that the diffusivity measurements were made across the disk at the same time, thus assessments of the annulus and nucleus were at the same temperature, and changes in response to loading were only minimally affected by temperature. We did not perform direct measurement of tissue hydration, as this would have required destruction of the disk tissues. With the tissue required for a separate study, we were limited to MR estimated water content.
Note that our approach to estimate water content will be reliable only to the extent that the TR is long enough to suppress any T1 effects. Because this was not a component of the initial study, the TR was selected for SNR and imaging time considerations, and was not as long as would have been optimal for a robust estimate of water content. Although not the primary aim of the current study, our post imaging assessment method has been used for brain (7) imaging. These associations are significant and consistent with our understanding of structure and function, suggesting that these hydration estimates are useful, if less than perfect. Finally, our diffusion protocol, using three gradient orientations, produced diffusivity values in agreement with those reported for intervertebral disks both in vitro (17) and in vivo (21,22). However, this approach results in values that are non-rotationally invariant, a potential confound for interpretation in terms of the disk’s inherent structure (44). These limitations acknowledged, we believe that our approach offers important guidance as an initial illustration of these relationships between MR findings, particularly diffusion and estimated water content, and disk mechanics. Our results suggest that it may be possible to model and predict disk mechanical behavior by observing its MR properties. This would open new avenues for understanding the functional significance of disk degeneration. The insights gained from such studies will guide extension of these principles to in vivo studies and interpretation of clinical MR examinations.
In conclusion, MR diffusivity demonstrated greater sensitivity than T2 to mechanical loading in human cadaveric disks. MR imaging of disk mechanics can lead to better understanding of the nature and progression of degenerative disk disease. This can assist in planning invasive and noninvasive therapy, as well as approaches intended to retard or reverse the degenerative process.
Acknowledgments
Contract grant sponsor: NIH R01; Contract grant number: 1R01AR055582-01A1.
REFERENCES
- 1.Andersson GBJ. Epidemiological features of chronic back pain. Lancet 1999;354:581–585. [DOI] [PubMed] [Google Scholar]
- 2.Cassar-Pullicino VN. MRI of the ageing and herniating intervertebral disc: review. Eur J Radiol 1998;27:214–228. [DOI] [PubMed] [Google Scholar]
- 3.Boos N, Boesch C. Quantitative magnetic resonance imaging of the lumbar spine. Potential for investigations of water content and biochemical composition. Spine 1995;20:2358–2365. [PubMed] [Google Scholar]
- 4.Modic MT. Degenerative disc disease and back pain. Magn Reson Imaging Clin North Am 1999;7:481–491. [PubMed] [Google Scholar]
- 5.Buirski G, Silberstein M. The symptomatic lumbar disc in patients with low-back pain. Magnetic resonance imaging appearances in both a symptomatic and control population. Spine 1993; 18:1808–1811. [DOI] [PubMed] [Google Scholar]
- 6.Haughton V Medical imaging of intervertebral disc degeneration: current status of imaging. Spine 2004;29:2751–2756. [DOI] [PubMed] [Google Scholar]
- 7.Fullerton GD, Camron LL. Relaxation of biological tissues. In: Wehrli FH, Shaw D, Kneeland JB, editors. Biomedical magnetic resonance imaging: principles, methodology, and applications. New York: VCH; 1988. p 115–155. [Google Scholar]
- 8.Antoniou J, Pike GB, Steffen T, et al. , Quantitative magnetic resonance imaging in the assessment of degenerative disc disease. Magn Reson Med 1998;40:900–907. [DOI] [PubMed] [Google Scholar]
- 9.Wilson SE, Alkalay RN, Myers B. Effect of the degenerative state of the intervertebral disc on the impact characteristics of human spine segments. Front Biomech 2013. Accepted for publication. [DOI] [PMC free article] [PubMed] [Google Scholar]
- 10.Boos N, Wallin A, Harms S, Bock P. Tissue characterization of normal and herniated intervertebral discs by quantitative MRI. In: Proceedings of the 39th Annual Meeting of Orthopaedic Research Society. 1993. (abstract 417). [Google Scholar]
- 11.Chatani K, Kusaka Y, Mifune T, Nishikawa H. Topographic differences of 1H-NMR relaxation times (T1, T2) in the normal intervertebral disc and its relationship to water content. Spine (Phila Pa 1976) 1993;18:2271–2275. [DOI] [PubMed] [Google Scholar]
- 12.Tertti M, Paajanen H, Laato M, Aho H, Komu M, Kormano M. Disc degeneration in magnetic resonance imaging. A comparative biochemical, histologic, and radiologic study in cadaver spines. Spine (Phila Pa 1976) 1991;16:629–634. [DOI] [PubMed] [Google Scholar]
- 13.Eyre DR, et al. , eds. Basic science perspectives. Part B. Intervertebral disc. In: Frymoyer JW, Gordon SL, editors. New perspective on low back pain. Park Ridge IL: American Academy of Orthopaedic Surgeons; 1989. p 147–207. [Google Scholar]
- 14.Thompson JP, Pearce RH, Schechter MT, Adams ME, Tsang IK, Bishop PB. Preliminary evaluation of a scheme for grading the gross morphology of the human intervertebral disc. Spine 1990; 15:411–415. [DOI] [PubMed] [Google Scholar]
- 15.Ke JH, et al. Relationship between MRI relaxation time and water content in intervertebral discs. In: Proceedings of the 39th Annual Meeting of Orthopaedic Research Society. 1993. [Google Scholar]
- 16.Weidenbaum M, Foster RJ, Best BA, et al. Correlating magnetic resonance imaging with the biochemical content of the normal human intervertebral disc. J Orthop Res 1992;10:552–561. [DOI] [PubMed] [Google Scholar]
- 17.Chiu EJ, Newitt DC, Segal MR, Hu SS, Lotz JC, Majumdar S. Magnetic resonance imaging measurement of relaxation and water diffusion in the human lumbar intervertebral disc under compression in vitro. Spine 2001;26:437–444. [DOI] [PubMed] [Google Scholar]
- 18.Antoniou J, Mwale F, Demers CN, et al. Quantitative magnetic resonance imaging of enzymatically induced degradation of the nucleus pulposus of intervertebral discs. Spine 2006;31:1547–1554. [DOI] [PubMed] [Google Scholar]
- 19.Majors AW, et al. A correlative analysis of T2, ADC and MT Ratio with water, hydroxyproline and GAG content in excised intervertebral disc. In: Proceedings of the 40th Annual Meeting of Orthopaedic Research Society, New Orleans, LA, 1994. [Google Scholar]
- 20.Basser PJ, Jones DK. Diffusion-tensor MRI: theory, experimental design and data analysis - a technical review. NMR Biomed 2002; 15:456–467. [DOI] [PubMed] [Google Scholar]
- 21.Kerttula L, Kurunlahti M, Jauhiainen J, Koivula A, Oikarinen J, Tervonen O. Apparent diffusion coefficients and T2 relaxation time measurements to evaluate disc degeneration. A quantitative MR study of young patients with previous vertebral fracture. Acta Radiol 2001;42:585–591. [DOI] [PubMed] [Google Scholar]
- 22.Kerttula LI, Jauhiainen JP, Tervonen O, Suramo IJ, Koivula A, Oikarinen JT. Apparent diffusion coefficient in thoracolumbar intervertebral discs of healthy young volunteers. Magn Reson Imaging 2000;12:255–260. [DOI] [PubMed] [Google Scholar]
- 23.Antoniou J, Demers CN, Beaudoin G, et al. , Apparent diffusion coefficient of intervertebral discs related to matrix composition and integrity. Magn Reson Imaging 2004;22:963–972. [DOI] [PubMed] [Google Scholar]
- 24.Panjabi MM, Krag M, Summers D, Videman T. Biomechanical time-tolerance of fresh cadaveric human spine specimens. J Orthop Res 1985;3:292–300. [DOI] [PubMed] [Google Scholar]
- 25.Wilke HJ, Neef P, Caimi M, Hoogland T, Claes LE. New in vivo measurements of pressures in the intervertebral disc in daily life. Spine 1999;15:755–762. [DOI] [PubMed] [Google Scholar]
- 26.Brinckmann P, Frobin W, Hierholzer E, Horst M. Deformation of the end-plate under axial loading of the spine. Spine 1983;8: 851–856. [DOI] [PubMed] [Google Scholar]
- 27.Basser PJ, Ozarslan E. Introduction to diffusion MRI. In: H. Johansen-Berg H, Behrens TEJ, editors. diffusion MRI: from quantitative measurement to in-vivo neuroanatomy. London: Elsevier; 2009. p 3–10. [Google Scholar]
- 28.Watanabe A, Benneker LM, Boesch C, Watanabe T, Obata T, Anderson SE. Classification of intervertebral disk degeneration with axial T2 mapping. AJR Am J Roentgenol 2007;189:936–942. [DOI] [PubMed] [Google Scholar]
- 29.Bibby SR, Jones DA, Lee RB, Yu J, Urban JPG. The pathophysiology of the intervertebral disc. Joint Bone Spine 2001;68: 537–542. [DOI] [PubMed] [Google Scholar]
- 30.Acaroglu ER, Iatridis JC, Setton LA, Foster RJ, Mow VC, Weidenbaum M. Degeneration and aging affect the tensile behavior of human lumbar anulus fibrosus. Spine (Phila Pa 1976) 1995;20:2690–2701. [DOI] [PubMed] [Google Scholar]
- 31.Kasra M, Shirazi-Adl A, Drouin G. Dynamics of human lumbar intervertebral joints: Experimental and finite element investigations. Spine 1982;17:93–101. [DOI] [PubMed] [Google Scholar]
- 32.Keller TS, Spengler DM, Hansson TH. Mechanical behaviour of human lumbar spine I. Creep analysis during static compressive loading. J Orthop Res 1987;5:467–478. [DOI] [PubMed] [Google Scholar]
- 33.Panjabi MM, White AA III. Clinical biomechanics of the spine, 2nd edition. Philadelphia: JB Lippincott; 1990. [Google Scholar]
- 34.Iatridis JC, Setton LA, Foster RJ, Rawlins BA, Weidenbaum M, Mow VC. Degeneration affects the anisotropic and nonlinear behaviors of human anulus fibrosus in compression. J Biomech 1998;31:535–544. [DOI] [PubMed] [Google Scholar]
- 35.Skaggs DL, Weidenbaum M, Iatridis JC, Ratcliffe A, Mow VC. Regional variation in tensile properties and biochemical composition of the human lumbar anulus fibrosus. Spine (Phila PA 1976) 1994;19:1310–1319. [DOI] [PubMed] [Google Scholar]
- 36.Trattnig S, Stelzeneder D, Goed S, et al. Lumbar intervertebral disc abnormalities: comparison of quantitative T2 mapping with conventional MR at 3.0 T. Eur Radiol 2010;20:2715–2722. [DOI] [PubMed] [Google Scholar]
- 37.Welsch GH, Trattnig S, Paternostro-Sluga T, et al. Parametric T2 and T2* mapping techniques to visualize intervertebral disc degeneration in patients with low back pain: initial results on the clinical use of 3.0 Tesla MRI. Skeletal Radiol 2011;40:543–551. [DOI] [PubMed] [Google Scholar]
- 38.Manac’ha Y-G, Perie D, Gilbert G, Beaudoin G. Sensitivity of multi-parametric MRI to the compressive state of the isolated intervertebral discs. Magn Reson Imaging 2013; 3136–3143. [DOI] [PubMed] [Google Scholar]
- 39.Arun R, Freeman BJ, Scammell BE, McNally DS, Cox E, Gowland P. 2009 ISSLS Prize Winner: what influence does sustained mechanical load have on diffusion in the human intervertebral disc? Spine (Phila Pa 1976) 2009;34:2324–2337. [DOI] [PubMed] [Google Scholar]
- 40.Mwale F, Demers CN, Michalek AJ, et al. Evaluation of quantitative magnetic resonance imaging, biochemical and mechanical properties of trypsin-treated intervertebral discs under physiological compression loading. J Magn Reson Imaging 2008;27: 563–573. [DOI] [PMC free article] [PubMed] [Google Scholar]
- 41.Adams MA, McMillan DW, Green TP, Dolan P. Sustained loading generates stress concentrations in lumbar intervertebral discs. Spine (Phila Pa 1976) 1996;21:434–438. [DOI] [PubMed] [Google Scholar]
- 42.Shirazi-Adl A Finite element simulation of changes in the fluid content of human lumbar discs. mechanical and clinical implications. Spine (Phila Pa 1976) 1992;17:206–212. [PubMed] [Google Scholar]
- 43.Perie D, Latridis JC, Demers CN, et al. Assessment of compressive modulus, hydraulic permeability and matrix content of trypsin-treated nucleus pulposus using quantitative MRI. J Bio- mech 2006;39:1392–1400. [DOI] [PubMed] [Google Scholar]
- 44.Hsu EW, Setton LA. Diffusion tensor microscopy of the intervertebral disc annulus fibrosus. Magn Reson Med 1999;41:992–999. [DOI] [PubMed] [Google Scholar]
- 45.Maroudas A, Stockwell RA, Nachemson A, Urban J. Factors involved in the nutrition of the human lumbar intervertebral disc: cellularity and diffusion of glucose in vitro. J Anat 1975;120: 113–130. [PMC free article] [PubMed] [Google Scholar]
- 46.Marchand F, Ahmed AM. Mechanical properties and failure mechanisms of the lumbar disc annulus. In: Proceedings of the 35th Annual Meeting of Orthopaedic Research Society, 1989. [Google Scholar]
- 47.Adams MA, Roughley PJ. What is intervertebral disc degeneration, and what causes it?. Spine (Phila Pa 1976) 2006;31: 2151–2161. [DOI] [PubMed] [Google Scholar]
- 48.Cassidy JJ, Hiltner A, Baer E. The strain-dependent osmotic pressure and stiffness of the bovine nucleus pulposus apportioned into ionic and non-ionic contributors. Ann Biomed Eng 1991;19:331. [DOI] [PubMed] [Google Scholar]
- 49.Cussler EL. Diffusion: mass transfer in fluid systems. Cambridge series in chemical engineering. Cambridge: Cambridge University Press; 1984. [Google Scholar]
- 50.Young IR, Hand JW, Oatridge A, Prior MV. Modeling and observation of temperature changes in vivo using MRI. Magn Reson Med 1994;32:358–369. [DOI] [PubMed] [Google Scholar]


