

Abstract
This study uses novel data to conduct a comprehensive evaluation of the demographic and economic circumstances facing HIV-positive individuals who have just entered HIV care in Uganda. While the provision of HIV care and antiretroviral therapy (ART) may improve physical health, to achieve the broader goal of improving the quality of life and socioeconomic viability of people living with HIV/AIDS, appropriate social and economic programmes may need to complement treatment. We report results from baseline data of a longitudinal, prospective cohort study with a 12-month follow-up period in two Ugandan HIV clinics. We use t-tests to examine differences across sample subpopulations and in a second step employ multivariate logistic and ordinary least squares regressions. The investigation of retrospective variables such as the respondent’s employment and income history, as well as changes in household composition, allows us to draw conclusions about the shocks experienced by households with HIV-positive members. We find that the study participants have experienced job loss and declining household income since testing HIV-positive, mainly due to worsened health status of the respondent. We also find that households use a range of coping mechanisms, such as changes in household composition or borrowing in response to these shocks, but that these strategies are not accessible to all types of households to the same degree. The findings highlight the importance of ART, not only to improve physical health, but also as a first necessary (though potentially not sufficient) step to help households restore their economic capacity.
Keywords: I12, I15, J22
1. Introduction
HIV/AIDS continues to hit sub-Saharan Africa hard, with approximately 19.7 million people living with HIV/AIDS and an estimated 1.9 million new infections in 2008 (United Nations Programme on HIV/AIDS (UNAIDS) and World Health Organization (WHO), 2009). Uganda, one of the countries at the epicentre of the epidemic, has a prevalence rate of 6.4% among the adult population and about 1 million infected individuals (United Nations Programme on HIV/AIDS (UNAIDS) and World Health Organization (WHO), 2009). To combat the epidemic, efforts to scale-up access to HIV antiretroviral therapy (ART) have increased dramatically in sub-Saharan Africa over the past years. The Uganda Ministry of Health reports that approximately 150,000 people living with HIV/AIDS had started ART as of June 2009 (Uganda Ministry of Health, 2009).
Just as in developed countries, HIV treatment enables people to live longer and healthier lives in developing country settings (Coetzee et al., 2004; Ferradini et al., 2006; Bussmann et al., 2008). In Uganda, the provision of ART and co-trimoxazole prophylaxis has been estimated to have reduced HIV-related mortality by 95% between 2003 and 2005 when compared with no intervention, as well as having reduced HIV-related orphanhood by 93% (Mermin et al., 2008). What is less clear is the impact of ART and improved physical health on key social and economic outcomes such as employment and household stability. However, to investigate these effects of ART, it is first necessary to assess the economic position of households before they start treatment and to learn how HIV status has affected well-being.
The economic consequences of HIV are often difficult to discern due to data issues and the sometimes complex effects brought about by HIV. Some of the negative consequences of HIV-related illness or mortality on economic well-being that have been found in African settings include (see Glick (2010) for a comprehensive review of the evidence for Africa): reduced income and productivity (Yamano and Jayne, 2004), reallocation and consumption of assets and savings (Menon et al., 1998) and the diversion of labour to the care of sick family members (Bachmann and Booysen, 2003). At the same time, the household’s composition and the roles and responsibilities of its members may change. If an adult falls ill, extended family members may move in to care for him/her and/or the children (Bachmann and Booysen, 2003). Children may take on adult roles and responsibilities such as caring for the ill adults or siblings or working on the farm, and have been found to subsequently drop out of school (Case et al., 2004) or leave to stay with extended family (Evans, 2004).
Most of the literature on household impacts has investigated the impacts of HIV-related mortality (or simply adult mortality, assumed to proxy AIDS death). There has been much less exploration of the effects of being HIV-positive or of experiencing HIV-related illness and of the effects of illness severity on the outcomes just discussed (Linnemayr, 2010). One exception is Fox et al. (2004) who found that the productivity of Kenyan tea estate workers decreased due to AIDS-related causes. To address this gap in the literature, we sought to investigate the effects of time since testing HIV-positive, and of health conditional on the HIV-positive status of the individuals in the study sample.
In this paper, we investigate the economic and household characteristics of a clinic-based sample of HIV-positive individuals at the point of entry into HIV care in Uganda. Unlike previous analyses, we use detailed clinical information on disease progression (CD4 count, WHO disease stage) and time since HIV-testing to explore the impacts of HIV on individuals and households. Also unlike most prior analyses, we explore whether the consequences of being HIV-positive are conditioned by characteristics such as household wealth of the respondent. While we might expect that poorer households suffer more because they have fewer physical or financial assets to cushion the impacts, there in fact is little evidence on this question. Beegle et al. (2008) considered the influence of AIDS mortality (not illness) and did not find a relationship between a household’s initial level of welfare and the consumption impacts from an adult death. This is an important policy question, since, beyond providing ART to improve the physical health of all in need, it may be important to target additional resources to support households least able to cope with the effects of HIV. This study makes a contribution by providing new knowledge of the effects of HIV/AIDS on those living with the disease and on their families, and by indicating which kinds of households may be the most in need of assistance.
The paper continues as follows: In Section 2, we describe the data, followed by the methods employed in Section 3. In Section 4, we describe the study population and compare it to a nationally representative sample of Ugandans. In Section 5, we analyse the economic and other consequences for participants’ households of being HIV-positive, and how these impacts vary by disease stage, time since testing and household characteristics. Section 6 concludes.
2. Study setting and sample
This paper uses baseline data from a longitudinal, prospective cohort study of new HIV-positive clients who will be followed up for 12 months. The primary goal of the study was to examine the impact of ART on multiple dimensions of health and well-being. The study enrolled new clients attending two HIV clinics operated by the Joint Clinical Research Center (JCRC) in Uganda, one in Kampala and the other in Kakira. Kampala is the only large urban centre in (and the capital of) Uganda, while Kakira is a small rural town located next to a sugar plantation approximately 100 km outside Kampala. JCRC, the largest provider of ART in Uganda, operates in more than 75 health care facilities and provides care to more than 75,000 clients, including 40,000 on ART, which represents more than 25% of the Ugandans now on ART. To the extent that our study population is similar to those at other JCRC clinics (and, given the large reach of JCRC within Uganda, potentially to the overall HIV-positive population in Uganda), our findings will have wide relevance for policies addressing HIV-positive individuals in Uganda.
The sample consists of 602 HIV-positive clients, with half being eligible for and prescribed ART and the other half not yet eligible for ART but being relatively close to eligibility in terms of CD4 count. Clients were deemed eligible for ART if they had a CD4 count of less than 250 cells/mm3 or had WHO Stage III or IV disease (WHO disease stage I being asymptomatic and stages III and IV representing an AIDS diagnosis), and had a ‘treatment supporter’. To participate in the study, a client had to be (i) age 18 or older; (ii) new to the clinic and just evaluated for ART eligibility; (iii) willing to take ART if deemed eligible and (iv) having a CD4 count of less than 400 cells/mm3 (hence being close to eligibility for ART as just noted). Clients meeting these criteria were informed of the study by a clinic staff member at the visit in which their eligibility for ART was determined (usually by the second or third clinic visit). Participants were then referred to the study coordinator for consent procedures and administration of the baseline interview. Clinic staff reported that willingness of those asked to participate in the study was close to universal. Participants were paid 5,000 Uganda Shillings (~ $2.50 USD) to complete the interview. The study protocol was approved by the Institutional Review Boards at both RAND and JCRC, as well as the Uganda National Council for Science and Technology. Participants went on to be scheduled for follow-up interviews at months 6 and 12; however, only the baseline data are included in the analysis for this paper.
3. Methods and measures
The data on which this analysis is based are unique in that they represent a comprehensive evaluation of the situation of HIV-positive people who have just initiated HIV care. We investigate the impacts of disease stage on socioeconomic outcomes of clients and their households, and whether they are mediated by characteristics such as gender, wealth and location. We employ both descriptive and multivariate approaches. For the descriptive analysis, we use t-tests to examine differences across different subpopulations of the sample. Multivariate analysis using logistic regression (to accommodate binary outcome variables) allows us to control for various factors when investigating the relationship between two variables of interest. For example, when considering whether rural patients were more likely to have sold off assets to deal with the costs of the disease, we would like to control for other factors (such as education) that are associated with location.
We stress that causal inference in these regressions is not always possible; most estimates, strictly speaking, should be regarded as associations. However, in some cases—and unusual for non-experimental data on HIV and behaviour—we can make plausible causal inferences. In particular, to estimate the impacts of HIV illness, we are able essentially to use patients in the early stages of illness who are largely asymptomatic (WHO stages 1 and 2) as controls for those experiencing AIDS-related illness (WHO stages 3 and 4). Since both groups are similar along the most important dimension for this analysis—HIV seropositivity—the former are reasonable controls for the latter, and it is plausible to interpret the comparisons of outcomes for the two groups as representing a causal effect of disease progression. It should be kept in mind that no one in the sample has yet received ART so the analysis does not confuse the impacts of HIV-related illness and treatment for HIV.
With regard to outcome measures, we consider indicators capturing the household’s (and the patient’s) economic situation and household demographics. The data contain detailed information on the client’s households’ current circumstances as well as recent changes in their circumstances. Basic characteristics gathered by the survey include age, gender and marital status. Information on current household composition, and changes thereof as a potential coping mechanism, was also collected.
In addition to characteristics such as education level, occupation and employment status (both current as well as retrospectively over the last 6 months), we measure economic status using indices of assets owned by the household, one for relatively fixed characteristics that provides a measure of the respondent’s initial (before illness and diagnosis) situation; and a second to capture changes in the respondent’s situation since testing positive or becoming ill, i.e., changes in the level of material well-being. For the first kind of asset, we consider home ownership, an indicator of overall wealth status that we assume to be relatively stable given the sizable transaction costs associated with selling a home relative to more liquid assets. Hence, home ownership can give an idea of initial wealth status of households before it was affected by HIV or related illness (Linnemayr, 2010). However, this measure is only meaningful in our urban sample as in the rural site the cost of building a standard shack are extremely low (personal communication with the field team). Therefore, we create a measure of housing quality using the method of principal components. This method (Filmer and Pritchett, 2001) is a data reduction tool that creates a single index from multiple indicators in a manner that explains the largest fraction of the variance observed, facilitating comparison across individuals. We use the presence of electricity, indicators of wall materials, the number of rooms and housing quality as perceived by the respondent to create this index.
The second asset index, also created using principal components, captures more liquid forms of wealth that are more likely to change with current economic circumstances: ownership of a radio, cell phone, TV, livestock, a car or a motorcycle. We will explore the relationship of this measure to disease stage to assess whether asset decumulation has occurred. Finally, the same issue is addressed directly in the survey with a question about whether respondents’ households sold assets in the last 6 months.
In addition to assets, the data contain several other measures of the economic situation of the respondents. Here too, some are current ‘level’ indicators, while others capture changes in economic status. In the former category are current employment status, occupation and income of the respondent. In the latter category, the survey asked respondents whether they had lost their job or had suffered income loss because of their HIV status. We also collected information on borrowing and credit in the past 6 months (which corresponds for many respondents to the time since testing HIV-positive).
Our data are unique in that they contain both subjective and objective indicators of the consequences of HIV infection that allow double-checking results using both types of response variables. The former involve direct questions to the respondent about the impacts of being HIV-positive: e.g., have you lost your job because of HIV? More objective indicators ask about the occurrence of events without mentioning HIV as not to prompt the respondent.
Another unusual aspect of our data is that we collect information on the time since the respondent was tested and first learned of her HIV-positive status. The median time of testing was 7 months prior to entry into the study, and importantly, is not significantly correlated with the progression of illness as measured by CD4 or WHO stage. This allows us to independently estimate the impacts of actual illness (via variation in disease severity) and of knowledge of one’s HIV status, or more precisely, the duration of being knowingly HIV-positive. The latter may be associated with certain behavioural responses to HIV status since many of these responses, such as saving or dissaving (selling assets) or changing work behaviour, would take time to carry out because of transactions costs (or perhaps the need for psychological adjustment). Changes related to time since testing independently of illness may also be related to stigma, as over time more people may become aware of the HIV-status of the respondent. The appropriate policy response will depend on whether the outcomes reflect behavioural responses or physical disability. Below, we attempt to differentiate between the direct health effects and the behavioural aspects of the disease by including both measures (time since testing; WHO disease stage) in the analysis to the extent possible.
Further, note that some of the outcome measures described above can be regarded purely as negative consequences of HIV/AIDS, some as coping mechanisms and some as both. Loss of job and income are clearly in the first category. Changes in the household’s size and composition may be a coping mechanism, as noted. Similarly, selling assets represents a cost of the illness (it reduces wealth) but—for those households with assets to sell—it provides income at a time when earnings from agriculture or other employment may be sharply reduced and medical costs are high. Finding that some of these coping mechanisms are available only to certain households would provide information for targeting assistance to especially vulnerable types of households.
4. Characteristics of the sample
4.1. Demographics
The sample consists of 191 men and 411 women, 225 of whom were heads of their households. The average age of participants is just over 35 (Table 1). Almost half (45%) of the respondents reported being married or in a committed relationship. Widowhood was high among female respondents (31%) and especially high among female heads of households (45%); many other female household heads were divorced (36%). Widowhood among HIV-positive women may reflect the earlier death of husbands from AIDS; divorce, too, may be a consequence for women of being HIV-positive (Porter et al., 2004).
Table 1:
Summary Statistics for Household Demographics and Health Status
| (1) | (2) | (3) | (4) | (5) | (6) | (7) | |
|---|---|---|---|---|---|---|---|
| Women | Men | Kakira | Kampala | WHO 1 or 2 | WHO 3 or 4 | All | |
|
| |||||||
| Demographics | |||||||
| Age | 34.83*** | 37.51 | 36.49** | 34.88 | 35.90 | 35.41 | 35.68 |
| Household size (no. of members) | 4.57* | 4.18 | 4.76*** | 4.14 | 4.59 | 4.28 | 4.45 |
| Marital status | |||||||
| Single (%) | 4*** | 10 | 2*** | 9 | 5 | 6 | 6 |
| Married or committed (%) | 38*** | 60 | 48 | 42 | 48* | 41 | 45 |
| Divorced or widowed (%) | 58*** | 30 | 50 | 49 | 46* | 54 | 49 |
| Living without spouse (%) | 67*** | 48 | 56*** | 66 | 57** | 66 | 61 |
| Another HIV-positive person in Hh (%) | 28 | 28 | 31 | 26 | 31 | 25 | 28 |
| Someone moved into Hh because of HIV status (%) | 27 | 31 | 21 *** | 35 | 20*** | 38 | 28 |
| Child moved out because of HIV status (%) | 34* | 42 | 35 | 38 | 33* | 41 | 36 |
| Health status | |||||||
| WHO Stage 3 or 4 (%) | 46 | 43 | 29*** | 61 | – | – | 45 |
| Asymptomatic illness (%) | 22 | 24 | 31 *** | 14 | 34*** | 9 | 23 |
| Perceives health as ‘less than good’ (%) | 73 | 75 | 71* | 77 | 67*** | 83 | 74 |
| CD4 count <250 (%) | 56 | 58 | 56 | 57 | 44*** | 72 | 56 |
| Mean time since HIV-test in months | 20 | 17 | 20 | 18 | 20 | 18 | 19 |
| No. of observations | 411 | 191 | 300 | 302 | 331 | 271 | 602 |
Notes:
significant at 1% level
significant at 5% level
significant at 10% level.
Hh, household. The t-tests compare column 1 with column 2; column 3 with column 4; and column 5 with column 6.
The disproportionate share of the sample that is female is striking, but not unexpected; it is common to see more women than men present at HIV clinics in African settings. Although the slightly higher HIV prevalence rate among women in this region (Muula et al., 2007) may explain a small portion of the imbalance, women clearly have a higher proclivity to seek health care services for reasons that may include stigma, gender roles and time constraints (Remien et al., 2009).
A large share (61%) of respondents was living without a spouse or partner. About half of these were not in a relationship or were divorced and 38% of were widowed. The share without a partner is significantly higher for females, respondents at later WHO disease stages, and urban participants. The first two differences may reflect (again) prior death of partners, or possibly, divorce after HIV status disclosure or worsening of illness.
4.2. Health status
Approximately half of the individuals in our sample were classified as being at WHO disease stage 3 or 4 (symptomatic infection and/or AIDS diagnosis), but with a large difference by location: only 29% in the rural site compared with 61% in the urban site. The difference by location may reflect the much more active outreach programme at Kakira when compared with Kampala, which potentially increased testing and care seeking at earlier stages of disease in the former. Table 1 also shows that self-perceived health status is consistent with objective measures of WHO disease stage and having disease symptoms. Only about one-quarter of participants reported health status as good or better (26%). Mean time since testing HIV-positive is significantly higher in rural Kakira than in Kampala and also—at first glance surprisingly—for those with less advanced disease status at the time of care-seeking. These patterns imply that rural participants both tested at an earlier stage in disease progression (as already suggested) and also waited longer to return to the clinic for care, presumably because they were substantially less ill. Urban participants in contrast probably were already sicker when presenting for testing and thus returned earlier to receive care.
4.3. Socioeconomic status
Forty-one per cent of respondents had at least some secondary school education or higher. Educational attainment is significantly higher among urban respondents than rural respondents, but is not related to disease stage. The latter finding supports the similarity of respondents at different WHO disease stages and hence the exogeneity of health status conditional on HIV status (and the validity of using early illness stage participants as controls for late stage participants when measuring the impacts of HIV-related illness).
Less than half (46%) of respondents at WHO stage 3 or 4 reported having worked in the previous 7 days, compared with 67% of asymptomatic respondents. Rural respondents were more likely to be working, potentially due to the availability of (subsistence) farming and the opportunities for employment in the nearby sugar plantation.
4.4. Housing
Overall, about one-third of respondents own their houses, with rural respondents more likely to own their homes. As we discussed above, home ownership in the rural site is a less than ideal indicator of wealth status. Among the Kampala subsample, those at later WHO disease stages are less likely to own their homes, but female- and male-headed households are equally likely to own their homes.
Approximately 50% of urban Kampala households had electricity (from grid or generator) compared with 19% of rural households. In Kampala, male-headed households were more likely to have electricity. More urban households than rural had a water tap at home (32 versus 10%), and within Kampala, households headed by women were less likely to have this amenity (p-value 0.06). Domiciles in Kampala are of considerably better quality (measured by our quality index) than those in the rural site. Once we control for location, there is no significant difference in the value for the housing quality index between respondents at early and late disease stages, adding further support to the comparability of these two groups.
4.5. Assets
Sixty-three per cent of respondents owned a radio, 27% owned a TV and 8% owned a car or motorcycle. Using the asset index described above, Kampala respondents are statistically significantly better off than their rural counterparts. In both locations, female-headed households are worse off. Once we control for location, there is no difference in the value for the asset index between respondents at early and late disease stages. This index and the housing quality index discussed above are highly correlated within rural and urban subsamples (ρ = 0.42 and ρ = 0.46, respectively), suggesting that the asset index, despite being potentially more sensitive to an individual’s current health and economic situation, remains a good proxy for initial (pre-infection) well-being. However, an alternative explanation for this finding is that the respondents at a later stage were wealthier pre-infection, but had to spend down their assets or move to a lower quality dwelling since becoming ill (Table 2).
Table 2:
Summary Statistics for Household Socioeconomic Status
| (1) | (2) | (3) | (4) | (5) | (6) | (7) | |
|---|---|---|---|---|---|---|---|
| Women | Men | Kakira | Kampala | WHO stage 1 or 2 | WHO stage 3 or 4 | All | |
|
| |||||||
| Educational level | |||||||
| None (%) | 13*** | 5 | 18*** | 4 | 11 | 10 | 11 |
| Primary (%) | 49 | 45 | 49 | 46 | 47 | 49 | 48 |
| Secondary or higher (%) | 37*** | 50 | 33*** | 50 | 42 | 41 | 41 |
| Works as farmer (%) | 18 | 15 | 29*** | 6 | 22*** | 11 | 17 |
| Has electricity (%) | 33 | 38 | 19*** | 50 | 28*** | 42 | 35 |
| Owns TV (%) | 24** | 32 | 10*** | 44 | 23** | 31 | 27 |
| Worked in past 7 days (%) | 53*** | 69 | 70*** | 46 | 67*** | 46 | 58 |
| Owns home (%) | 32 | 36 | 42*** | 25 | 37** | 28 | 33 |
| Index for housing quality | −0.03 | 0.07 | −0.40*** | 0.40 | −0.16*** | 0.19 | 0.00 |
| Asset index | −0.10*** | 0.21 | −0.34*** | 0.33 | −0.06* | 0.08 | 0.00 |
| Had savings (%) | 53*** | 69 | 89*** | 27 | 69*** | 45 | 58 |
| Sold assets (%) | 13 | 16 | 3*** | 24 | 11*** | 18 | 14 |
| No. of observations | 411 | 191 | 300 | 302 | 331 | 271 | 602 |
Notes:
significant at 1% level
significant at 5% level
significant at 10% level.
The t-tests compare column 1 with column 2; column 3 with column 4; and column 5 with column 6.
In an effort to put our sample in the context of the wider population of Ugandans, we compare it to respondents of the AIDS Indicator Survey (AIS) Uganda 2004/2005 (MOH Uganda and ORC Macro, 2006). While it is difficult to compare the two populations (most importantly because the respondents in the AIS include also HIV-negative respondents, but also due to differences in sampling strategies, regions covered and age ranges of the respondents), there are some differences that we note in the data: first, our rural respondents on average are more educated than those in the AIS: whereas in Kakira about 27% of female respondents have secondary education or higher, the fraction of this respondent characteristic in East Central (the region in which Kakira lies and for which we have information in the AIS) is only 13.4%. As mentioned above, it is difficult to say whether this finding reflects true differences or is confounded by differences in gender, age and geographical composition between the two samples. Similarly, we find that respondents in Kakira on average are more likely to have electricity and have more assets than rural respondents in the AIS (which also includes the poor Northern regions of Uganda). Comfortingly, the values for Kampala match up well for most variables for which information is available.
5. Changes in household composition, employment and wealth
We begin by investigating the correlates of loss of employment and reduced household income in our HIV-positive sample. We focus mainly on health status as measured by WHO disease stage 3 or 4 (when compared with the asymptomatic stages 1 and 2), given strong expectations of progressive loss of productive capacity for HIV-positive individuals not yet on ART (Thirumurthy et al., 2008). Figure 1 presents four graphs showing the relationship between CD4 count (increasing in value on the x-axis to indicate less disease progression) and four main outcome variables (currently working, lost job due to HIV, someone moving into household, having savings) using locally weighted regression. There is a clear positive relationship between CD4 count and economic productivity (currently working, not having lost a job due to HIV) as well as savings, and a negative relationship with immigration of someone into the household to care for the respondent. Shocks to the economic well-being of the households probably trigger coping mechanisms that we will investigate in subsequent sections.
Figure 1:
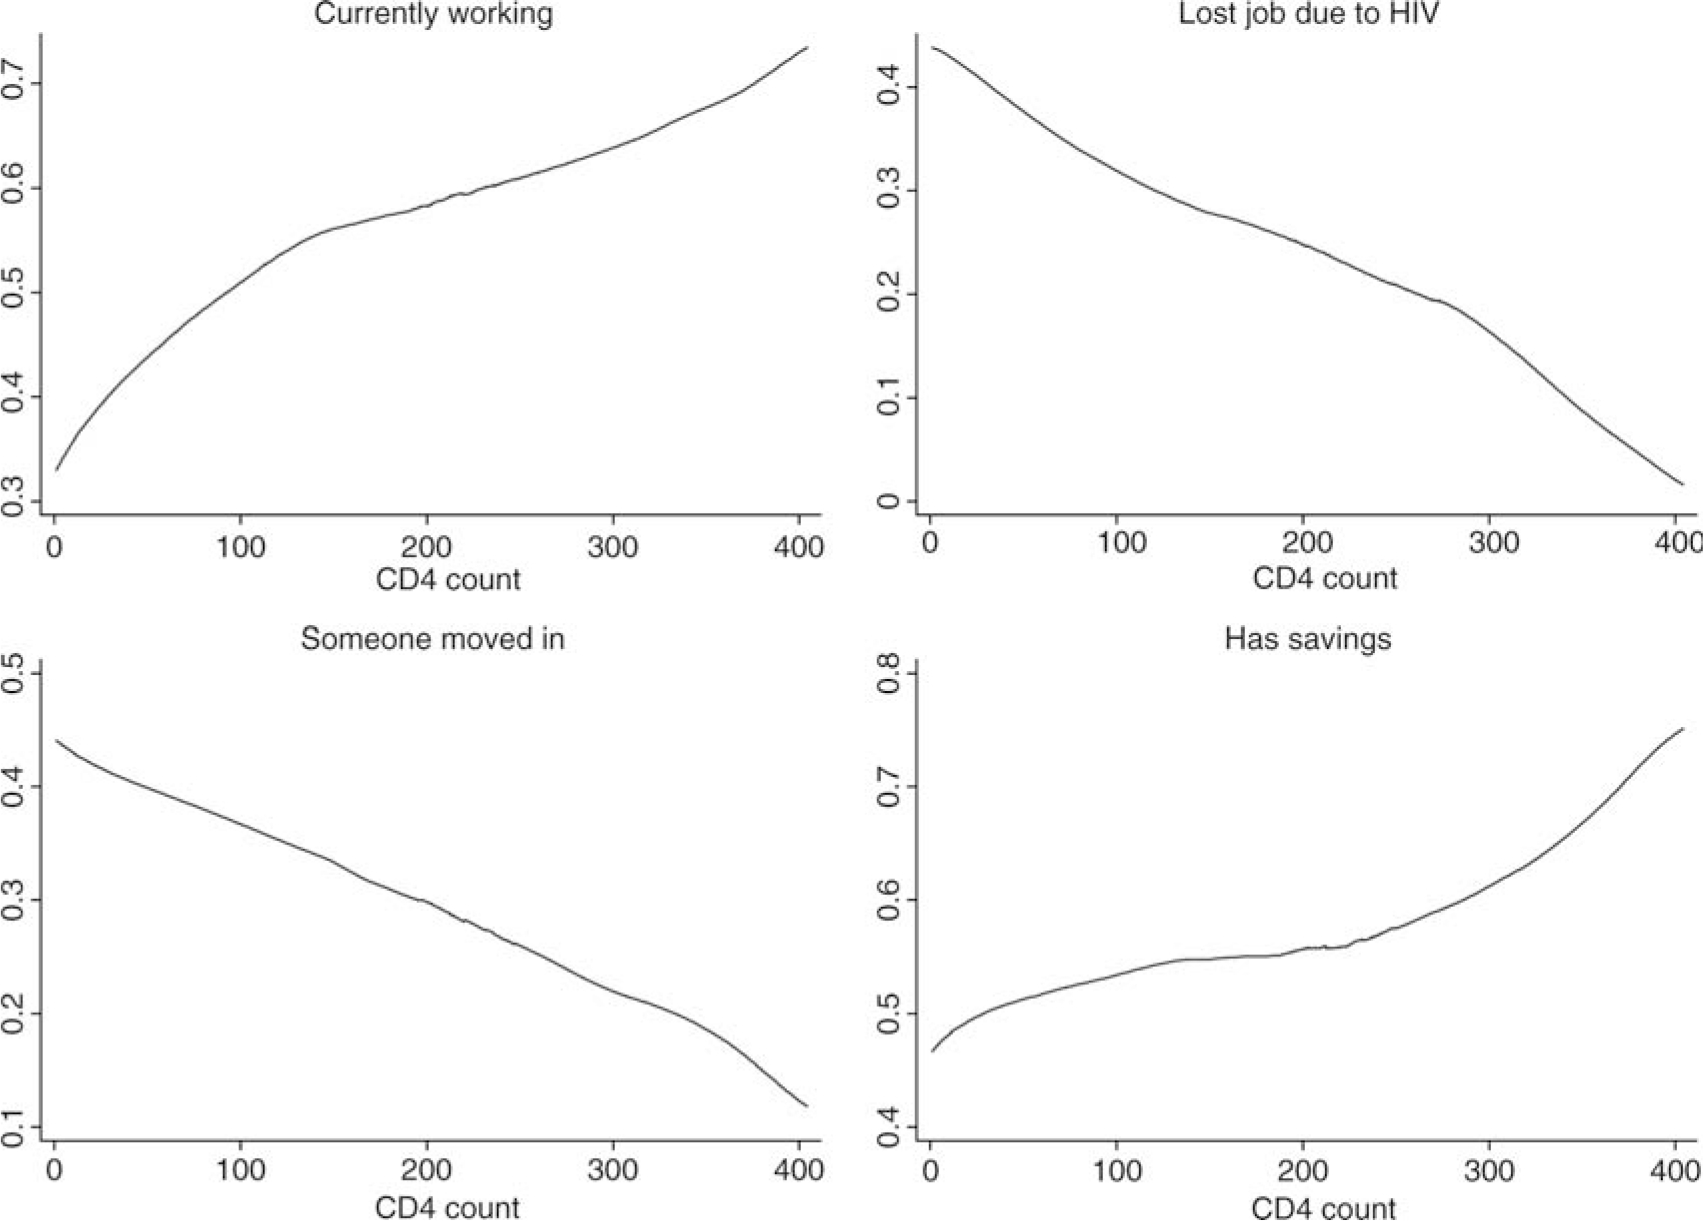
The relationship between CD4 count and four main outcome measures. Note: Graphs generated using locally weighted regression.
5.1. Income and employment
Job loss and reduced productive capacity are among the most direct negative economic effects experienced by households in our sample: out of 254 people (42%) who did not work in the last 7 days, nearly half (49%) cited sickness as the underlying reason (If we drop the missing values for the question, the sick fraction increases to 86%). This finding holds up when using more objective measures of health status: people at WHO stages 3 and 4 are less likely to have worked in the past 7 days than those at stage 1 or 2 (47% versus 67%). Similarly, over a quarter of people working at the time of HIV-testing indicated that they lost their job because of HIV status.
Controlling for a number of factors in the multivariate context, the results based on objective measures confirm the direct questions about the impacts of illness related to HIV status: current work is significantly less likely for respondents at WHO stages 3 or 4, as well as for urban respondents (Table 3, column 1). Men and those of either gender with secondary or higher education are more likely to be currently working. The results when using a binary variable indicating a CD4 count of less than 250 cells/mm3 (column 2) are very similar to the results in column 1 and this is the case for other outcomes as well, so we only present all further results using the illness stage.
Table 3:
Change in Employment and Household Income (Logit Regressions)
| Dependent variable | (1) | (2) | (3) Job loss |
(4) | (5) | (6) |
|---|---|---|---|---|---|---|
|
|
||||||
| Worked in last 7 days | Worked in last 7 days | Kakira | Kampala | Hh-income worsened | Hh-income worsened | |
|
| ||||||
| Age | 0.013 (0.011) | 0.011 (0.011) | −0.019 (0.021) | 0.023 (0.018) | 0.034 (0.011)*** | 0.034 (0.012)*** |
| Male | 0.546 (0.203)*** | 0.595 (0.205)*** | −0.575 (0.360) | −0.100 (0.332) | 0.004 (0.199) | 0.070 (0.210) |
| Secondary education or higher | 0.605 (0.199)*** | 0.611 (0.199)*** | −1.024 (0.327)*** | −0.026 (0.351) | −0.590 (0.188)*** | −0.500 (0.199)** |
| WHO stage 3 or 4 | −0.581 (0.184)*** | – | 1.031 (0.343)*** | 0.825 (0.311)*** | 0.457 (0.190)** | 0.237 (0.200) |
| CD4 count under 250 | – | −0.703 (0.182)*** | – | – | – | – |
| Months since testing | 0.002 (0.003) | 0.003 (0.003) | 0.002 (0.005) | 0.006 (0.004) | −0.000 (0.003) | −0.002 (0.003) |
| Housing quality index | 0.030 (0.108) | 0.003 (0.109) | 0.000 (0.196) | −0.201 (0.177) | −0.206* (0.111) | −0.204 (0.117)* |
| Asset index | 0.141 (0.115) | 0.133 (0.116) | −0.144 (0.189) | −0.211 (0.227) | −0.339 (0.114)*** | −0.337 (0.119)*** |
| Kampala | −1.098 (0.214)*** | −1.269 (0.211)*** | – | – | 0.140 (0.212) | 0.145 (0.220) |
| No other HIV + member | 0.021 (0.228) | −0.003 (0.228) | 0.116 (0.449) | −0.764 (0.388)** | 0.063 (0.222) | 0.137 (0.230) |
| Living without partner | −0.035 (0.221) | −0.074 (0.222) | 0.712 (0.414)* | −0.038 (0.350) | −0.016 (0.217) | −0.111 (0.227) |
| Job loss | – | – | – | – | – | 2.043 (0.308)*** |
| Constant | 0.270 (0.466) | 0.577 (0.483) | −0.826 (0.864) | −2.355 (0.757)*** | −0.734 (0.470) | −1.014 (0.484)** |
| Observations | 602 | 602 | 243 | 290 | 602 | 602 |
Notes:
significant at 1% level
significant at 5% level
significant at 10% level.
Hh, household.
In columns 3 and 4 of Table 3, we investigate the determinants of HIV-related loss of employment for each site, based on a direct question to respondents about whether this occurred specifically as a consequence of their being HIV-positive. Being at WHO disease stage 3 or 4 is the most important predictor for this event: being at this stage relative to WHO stage 1 or 2 for the whole sample is associated with an almost 15% increase in the probability of job loss controlling for other factors. The estimate may reflect voluntary withdrawal from work due to illness or stigma, or employer initiated separation due to reduced productivity or discrimination. Both the rural and urban samples show a higher probability of job loss in response to WHO disease stage 3 or 4. Similar results prevail when splitting the sample on broad occupation status, that is, being a farmer/fisherman versus other occupations (not shown). The first group, who are self-employed, are presumably not likely to experience loss of employment due to stigmatisation or discrimination. The impact of WHO stage 3 or 4 on ‘job loss’ for this group thus points to real reductions in productive capacity as a result of HIV-related illness. We also observe that loss of employment due to HIV is less likely for people with secondary or higher education, but only for Kakira. Turning to impacts on income, 60% of all respondents reported that their household income had fallen since testing HIV-positive. Logistic regression results in column 4 of Table 3 confirm the association of negative employment events and disease stage: being at WHO stage 3 or 4 when compared with stage 1 or 2 leads to an increase of 11% of experiencing worsening household income. Asset wealth and higher education are negatively associated with income loss, suggesting that these factors serve to protect against economic consequences of HIV, though the precise mechanisms are not clear. As the asset index captures short-term wealth, the negative coefficient may also indicate a reduction in this index in response to lower household income. Not surprisingly, when job loss of the respondent is added to the regression (column 5), it is the most highly significant predictor of reduced household income. This result underscores the point that increased physical functioning and, for many, potential renewal of work due to ART hold significant potential economic benefits not only for the respondent but also for the household she is part of. Also, in this specification, WHO disease stage is positive yet insignificant, indicating that health has no direct effect on household income once controlling for loss of employment (a direct effect would come about, for example, if the individual continued to work but his or her productivity was reduced).
5.2. Changes in household composition
Approximately 26% of respondents reported moving into a different home over the last year, 28% reported that someone moved into their household to help care for them because of their HIV status, and 36% reported that a child moved out of the household because of their HIV status. While we do not have similar data from non-HIV afflicted households or from a random national sample, these shares appear large, suggesting that changes in household composition are widely used as a coping mechanism in response to HIV illness. This inference is strengthened by the fact that patients at more advanced WHO stages (as well as non-nuclear households) were more likely to experience someone moving into the household due to their HIV, to have a child move out of the household, and to have moved to a new household themselves.
In a multivariate logistic regression including variables at the individual and household level (Table 4), the probability of having someone move into the household is positively related to WHO illness stage (column 1); the increase in this probability from being WHO stages 3–4 is 14%. These are large effects relative to the mean for the sample of 28%. These estimates suggest a significant effect of health status on household composition—perhaps because of the need for care or perform domestic work—as well as potential effects coming from the need for income to make up for the respondent’s loss of employment. As in the bivariate statistics, clients in Kampala have a higher probability of someone moving into the household; since we control for illness stage, this difference does not merely reflect the association of illness with urban residence. Respondents with no other HIV-positive household member and those living without a partner or spouse also experience a higher chance of having had someone move into the household to help with HIV care or provide income.
Table 4:
Changes in Household Composition (Logit Regressions)
| Dependent variable | (1) | (2) | (3) | (4) | (5) |
|---|---|---|---|---|---|
| Someone moved in | Child moved out | Respondent relocated | Father not in Hh | Mother not in Hh | |
|
| |||||
| Age | 0.015 (0.011) | −0.019 (0.012) | −0.041 (0.013)*** | 0.019 (0.012) | 0.020 (0.011)* |
| Male | 0.400 (0.210)* | 0.694 (0.212)*** | 0.277 (0.221) | −2.292 (0.254)*** | 0.170 (0.203) |
| Secondary education or higher | −0.305 (0.209) | −0.478 (0.207)** | −0.031 (0.215) | −0.452 (0.216)** | −0.155 (0.202) |
| WHO stage 3 or 4 | 0.720 (0.199)*** | 0.261 (0.197) | 0.129 (0.205) | −0.559 (0.207)*** | −0.131 (0.196) |
| Months since testing | 0.001 (0.003) | 0.003 (0.003) | −0.002 (0.003) | 0.000 (0.003) | 0.001 (0.003) |
| Housing quality index | 0.160 (0.119) | 0.004 (0.113) | 0.326 (0.123)*** | 0.027 (0.116) | −0.066 (0.113) |
| Asset index | −0.038 (0.121) | −0.466 (0.126)*** | −0.547 (0.134)*** | 0.367 (0.128)*** | 0.436 (0.119)*** |
| Kampala | 0.453 (0.226)** | 0.435 (0.223)* | 0.691 (0.233)*** | −0.387 (0.230)* | −0.332 (0.220) |
| No other HIV + member | 0.540 (0.247)** | −0.473 (0.240)** | 0.245 (0.255) | 0.472 (0.254)* | 0.227 (0.230) |
| Living without partner | 0.713 (0.248)*** | 0.184 (0.227) | 0.356 (0.247) | 1.558 (0.253)*** | 0.341 (0.230) |
| Constant | −2.698 (0.519)*** | −0.314 (0.494) | −0.445 (0.537) | −0.786 (0.502) | −1.643 (0.475)*** |
| Observations | 602 | 559 | 602 | 602 | 602 |
Notes:
significant at 1% level
significant at 5% level
significant at 10% level.
Hh, household.
Sending children to live in another household is a further possible, if difficult, coping mechanism used by HIV-afflicted households (Evans, 2004). The probability of having a child leave the household because of the respondent’s HIV status (column 2 of Table 4) is higher for male respondents and those living in Kampala, but is not associated with WHO disease stage 3 or 4. The probability of this event is lower for more educated and wealthier respondents, as well as for cases where the respondent is the only HIV-positive member in the household. Moving into a new household over the last year was more likely to have occurred for younger respondents and those with a lower asset index, as well as for those in Kampala and with a higher housing quality index, potentially because they moved to wealthier households (column 3).
We also investigated the determinants of the presence of children whose biological parents do not reside in the household (columns 4 and 5), which is more likely for relatively richer households. Fostering is a common phenomenon in African societies, which has gained an importance as the AIDS epidemic has produced enormous numbers of orphans, and it is expected that relatively better-off households would be more likely to take in other children. What is somewhat striking in our results is that even households that themselves contain an HIV-positive adult support other children in this way. At the same time, respondents living with no other adults (as is typically the case for female-headed households) have a higher number of paternal and double orphans (latter result not shown). Many female heads of household are widowed, and the presence of a child without a father living in the household simply reflects this fact.
5.3. Changes in assets, savings and borrowing
More than half of all households have some form of financial savings (58%) with rural respondents and those at less advanced WHO stages more likely to have savings. Savings categories include money kept in the home, deposits with financial institutions, deposits with savings committees and bonds, shares and security. In a multivariate framework with controls for other factors (Table 5, column 1), the association with earlier disease stage disappears. However, we see that more educated respondents and those with a higher asset index are more likely to report having savings, as are those in rural Kakira; the latter appears to be due to many more people in the rural setting having ‘money at home’ that is counted as ‘savings’, rather than having money in a financial institution. When we add job loss to the regression, we find it to be negatively associated with having savings, and highly statistically significant (not shown). It therefore appears to be the case that savings are being used to cope with loss of employment, a mechanism that may not be available to all households. When we stratify the regression by the housing quality index as a measure of long-term wealth (Linnemayr, 2010), we find no statistically significant differences by wealth in the effect of disease progression on savings behaviour, although this potentially is due to small cell sizes.
Table 5:
Changes in Financial Assets (Logit Regressions)
| Dependent variable | (1) | (2) | (3) | (4) | (5) | (6) |
|---|---|---|---|---|---|---|
| Having any savings | Poor households | Better-off households | Borrowing | Gifts | Sold assets | |
| Having any savings | Having any savings | |||||
|
| ||||||
| Age | 0.005 (0.014) | 0.016 (0.023) | 0.004 (0.020) | 0.020 (0.013) | 0.018 (0.013) | 0.001 (0.016) |
| Male | 0.674 (0.261)*** | −0.166 (0.437) | 1.106 (0.349)*** | 0.523 (0.227)** | −0.152 (0.257) | 0.465 (0.278)* |
| Secondary education or higher | 1.021 (0.269)*** | 0.730 (0.443)* | 1.372 (0.357)*** | 0.434 (0.232)* | −0.055 (0.244) | −0.056 (0.269) |
| WHO stage 3 or 4 | −0.214 (0.235) | 0.087 (0.373) | −0.320 (0.323) | 0.480 (0.230)** | 0.286 (0.234) | 0.062 (0.264) |
| Months since testing | 0.000 (0.004) | −0.005 (0.005) | 0.007 (0.005) | −0.002 (0.004) | 0.004 (0.003) | 0.005 (0.004) |
| Housing quality index | 0.193 (0.140) | −0.002 (0.252) | 0.163 (0.316) | −0.040 (0.134) | 0.160 (0.139) | −0.421 (0.158)*** |
| Asset index | 0.504 (0.148)*** | 1.031 (0.302)*** | 0.254 (0.183) | 0.336 (0.133)** | −0.252 (0.143)* | 0.080 (0.155) |
| Kampala | −4.192 (0.344)*** | −4.901 (0.546)*** | −3.961 (0.541)*** | −0.465 (0.259)* | 1.274 (0.282)*** | 2.585 (0.400)*** |
| No other HIV + member | −0.304 (0.301) | −0.041 (0.430) | −0.468 (0.452) | −0.153 (0.270) | −0.074 (0.305) | −0.364 (0.337) |
| Living without partner | −0.095 (0.290) | 0.176 (0.429) | −0.328 (0.410) | −0.149 (0.262) | 0.610 (0.296)** | −0.100 (0.313) |
| Constant | 2.096 (0.615)*** | 2.001 (0.970)** | 1.942 (0.921)** | −2.414 (0.558)*** | −3.474 (0.616)*** | −3.763 (0.745)*** |
| Observations | 602 | 329 | 273 | 602 | 602 | 602 |
Notes:
significant at 1% level
significant at 5% level
significant at 10% level.
With respect to borrowing behaviours, slightly fewer than 20% of respondents reported having obtained funds in the last 6 months that they later had to repay. The regression results in Table 5, column 4, show that respondents at more advanced disease stages are more likely to have borrowed, as are male respondents and those with higher asset wealth; the latter may reflect better access to credit for those who have collateral. A similar fraction of respondents (18%) received gifts in the form of money or goods in the last 6 months. Regression analysis (column 5) shows that this is not related to disease stage when controlling for other factors, but is associated with living in Kampala, and with living alone.
Another coping strategy common in our sample is the sale of assets (14%), of which 42% were reported to be for medical reasons. In the multivariate framework (Table 5, column 6), we find that asset sales were less likely to occur for those with higher initial wealth as proxied for by the housing quality index, indicating that they may have had other options that allowed them not to deplete their assets.
The duration in months that the individual has known of his or her HIV-positive status (time since testing) was added to each of the regressions in Tables 3–5. In no case did the estimates on this covariate approach statistical significance. This suggests that the range of economic consequences we observe are the direct result of ill health (or possibly discrimination tied to evident AIDS illness) rather than behavioural adjustments. We know of no other studies that have similarly attempted to distinguish these two kinds of causal impacts of HIVon socioeconomic outcomes.
To more fully explore heterogeneity in the effects of disease progression, we interacted disease stage with the measures of wealth presented above in order to test whether household resources protect from the consequences of disease progression. By and large the results were not statistically significant (not reported). This suggests (conditional on the wealth measures not being directly impacted by HIV) that having more resources does not prevent loss of work and savings as the disease progresses. It should be kept in mind that the models control for the direct impacts of health status and wealth.
6. Summary and conclusion
This study is one of the first to conduct a comprehensive evaluation of the social and economic lives of people living with HIV and AIDS at the outset of HIV care. The contribution to the literature is twofold: first, we investigate the types of economic and demographic shocks brought about by HIV-related illness, on which the existing literature has little to say. Secondly, the results from this baseline analysis provide a detailed picture of the demographic and socioeconomic status of a sample of HIV-positive Ugandans about to begin HIV care and set the stage for subsequent follow-up analysis to evaluate the effects of ART on the economic and demographic position of ART recipients.
Beyond changes in household composition, respondents report worrying socioeconomic changes since testing HIV-positive. About half of the 254 respondents who did not work in the last 7 days cited sickness as the underlying reason, and nearly a quarter of respondents reported job loss because of their HIV status. A large percentage of respondents reported worsened household income since testing HIV-positive—largely related to the respondent’s job loss. The households in our sample employ a range of coping mechanisms to deal with these adverse economic shocks such as changes in household composition (people moving in to help with HIV care, children moving out of the household), the drawing down of savings, sale of assets or increased borrowing. We find that wealth acts as a buffer against the negative consequences of disease progression such as worsening household income that is not available for all households as a coping mechanism. Similarly, respondents with secondary education or higher are both less likely to experience job loss and worsening household income. These findings suggest that women, uneducated and poor clients are least equipped to deal with the consequences of HIV-related disease progression and are probably most in need of support.
A potential limitation of the current study is that the study participants were recruited at the clinic; HIV-positive individuals not presenting for HIV care may experience different effects of disease progression. Another limitation is that due to the design of the study (which attempted to use comparable groups that were both near the eligibility cut-off for ART) the study participants all have a CD4 count of 400 or lower. Hence, we cannot make inferences about the effects of disease progression for HIV-positive individuals with higher CD4 count, i.e., about what happens in the early stages of HIV infection.
To conclude, our study finds that HIV-positive individuals in Uganda experience severe economic outcomes brought about by worsening health due to HIV, and attempt to deal with them using a range of coping mechanisms which they employ with varying success. However, a remaining question is the extent to which initiation of anti-retroviral therapy can reverse these loses, and conversely, the extent to which assistance is still required—and to which households it should be targeted. We will begin to address these questions as we follow the cohort through ART treatment in subsequent research.
Acknowledgements
We would like to thank the study coordinators (Tonny Kizza, Joseph Bebe, Mark Magina), the clinic directors (Drs. William Tamale and Grace Namayanja), nurse Erina Turya and counsellors (Hellen Nakyambadde, Rose Byaruhanga, Grace Barungi) who helped to identify and refer participants, and the client participants who gave so generously of their time and their personal stories to inform the study.
Funding
This research is supported by a grant from the Rockefeller Foundation.
References
- Bachmann M and Booysen F (2003) ‘Health and Economic Impact of HIV/AIDS on South African Households: a Cohort Study’, BMC Public Health, 3: 14. [DOI] [PMC free article] [PubMed] [Google Scholar]
- Beegle K, de Weerdt J and Dercon S (2008) ‘Adult Mortality and Consumption Growth in the Age of HIV/AIDS’, Economic Development and Cultural Change, 56 (2): 299–326. [Google Scholar]
- Bussmann H, Wester C, Ndwapi N, Grundmann N, Gaolathe T, Puvimanasinghe J, Avalos A, Mine M, Seipone K, Essex M, Degruttola V and Marlink R (2008) ‘Five-year Outcomes of Initial Patients Treated in Botswana’s National Antiretroviral Treatment Program’, Aids, 22 (17): 2303–11. [DOI] [PMC free article] [PubMed] [Google Scholar]
- Case A, Paxson C and Ableidinger J (2004) ‘Orphans in Africa: Parental Death, Poverty, and School Enrollment’, Demography, 41 (3): 483–508. [DOI] [PubMed] [Google Scholar]
- Coetzee D, Hildebrand K, Boulle A, Maartens G, Louis F, Labatala V, Reuter H, Ntwana N and Goemaere E (2004) ‘Outcomes after Two Years of Providing Antiretroviral Treatment in Khayelitsha, South Africa’, Aids, 18 (6): 887–95. [DOI] [PubMed] [Google Scholar]
- Evans D (2004) The Spillover Impacts of Africa’s Orphan Crisis (unpublished manuscript). Santa Monica, CA: RAND Corporation. [Google Scholar]
- Ferradini L, Jeannin A, Pinoges L, Izopet J, Odhiambo D, Mankhambo L, Karungi G, Szumilin E, Balandine S, Fedida G, Carrieri M, Spire B, Ford N, Tassie J, Guerin P and Brasher C (2006) ‘Scaling up of Highly Active Antiretroviral Therapy in a Rural District of Malawi: an Effectiveness Assessment’, Lancet, 367 (9519): 1335–42. [DOI] [PubMed] [Google Scholar]
- Filmer D and Pritchett L (2001) ‘Estimating Wealth Effects Without Expenditure Data – or Tears: an Application to Educational Enrollments in States of India’, Demography, 38 (1): 115–32. [DOI] [PubMed] [Google Scholar]
- Fox M, Rosen S, MacLeod W, Wasunna M, Bii M, Foglia G and Simon J (2004) ‘The Impact of HIV/AIDS on Labour Productivity in Kenya’, Tropical Medicine and International Health, 9 (3): 318–24. [DOI] [PubMed] [Google Scholar]
- Glick P (2010) ‘Reproductive Health and Behavior, HIV/AIDS, and Poverty in Africa’, in Mwabu G and Ajakaiye O (eds), Reproductive Health, Economic Growth and Poverty Reduction in Africa: Frameworks of Analysis. Nairobi, Kenya: African Economic Research Consortium and University of Nairobi. [Google Scholar]
- Linnemayr S (2010) ‘Consumption Smoothing and HIV/AIDS: The Case of Two Communities in South Africa’, Economic Development and Cultural Change, 58 (3): 475–506. [Google Scholar]
- Menon R, Wawer M, Konde-Lule J, Sewankambo N and Li C (1998) ‘The economic impact of adult mortality on households in Rakai district, Uganda’, in Ainsworth M and Fransen L and Over M (ed.), Confronting AIDS: Evidence from the Developing World. Brussels: European Commission and Washington, D.C.: World Bank. [Google Scholar]
- Mermin J, Were W, Ekwaru J, Moore D, Downing R, Behumbiize P, Lule J, Coutinho A, Tappero J and Bunnell R (2008) ‘Mortality in HIV-infected Ugandan Adults Receiving Antiretroviral Treatment and Survival of Their HIV-uninfected Children: a Prospective Cohort Study’, Lancet, 371 (9614): 752–59. [DOI] [PubMed] [Google Scholar]
- Ministry of Health (MOH) and ORC Macro (2006) Uganda HIV/AIDS Sero-behavioural Survey 2004–2005. Calverton, MD: Macro International Inc. [Google Scholar]
- Muula A, Ngulube T, Siziya S, Makupe C, Umar E, Prozesky H, Wiysonge C and Mataya R (2007) ‘Gender distribution of adult patients on highly active antiretroviral therapy (HAART) in Southern Africa: a systematic review’, BMC Public Health, 7 (63): 1–15. [DOI] [PMC free article] [PubMed] [Google Scholar]
- Porter L, Hao L, Bishai D, Serwadda D, Wawer M, Lutalo T and Gray R (2004) ‘HIV Status and Union Dissolution in Sub-Saharan Africa: the Case of Rakai, Uganda’, Demography, 41 (3): 465–82. [DOI] [PubMed] [Google Scholar]
- Remien R, Chowdhury J, Mokhbat J, Soliman C, Adawy M and El-Sadr W (2009) ‘Gender and Care: Access to HIV Testing, Care, and Treatment’, Journal of Acquired Immune Deficiency Syndromes, 51: S106–S110. [DOI] [PMC free article] [PubMed] [Google Scholar]
- Thirumurthy H, Zivin J and Goldstein M (2008) ‘The Economic Impact of AIDS Treatment – Labor Supply in Western Kenya’, Journal of Human Resources, 43 (3): 511–52. [PMC free article] [PubMed] [Google Scholar]
- Uganda Ministry of Health (2009) Status of HIV/AIDS Epidemic. Kampala: Uganda Ministry of Health. [Google Scholar]
- United Nations Programme on HIV/AIDS (UNAIDS) and World Health Organization (WHO) (2009) AIDS Epidemic Update, Report Update, November 2009.
- Yamano T and Jayne T (2004) ‘Measuring the Impacts of Working-Age Adult Mortality on Small-Scale Farm Households in Kenya’, World Development, 32 (1): 91–119. [Google Scholar]