

Abstract
Wearable bioelectronics for continuous and reliable pulse wave monitoring against body motion and perspiration remains a great challenge and highly desired. Here, a low-cost, lightweight, and mechanically durable textile triboelectric sensor that can convert subtle skin deformation caused by arterial pulsatility into electricity for high-fidelity and continuous pulse waveform monitoring in an ambulatory and sweaty setting is developed. The sensor holds a signal-to-noise ratio of 23.3 dB, a response time of 40 ms, and a sensitivity of 0.21 μA kPa−1. With the assistance of machine learning algorithms, the textile triboelectric sensor can continuously and precisely measure systolic and diastolic pressure, and the accuracy is validated via a commercial blood pressure cuff at the hospital. Additionally, a customized cellphone application (APP) based on built-in algorithm is developed for one-click health data sharing and data-driven cardiovascular diagnosis. The textile triboelectric sensor enabled wireless biomonitoring system is expected to offer a practical paradigm for continuous and personalized cardiovascular system characterization in the era of the Internet of Things.
Keywords: carbon nanotubes, machine learning, motion artifacts, personalized healthcare, pulse wave monitoring, smart textiles
1. Introduction
Cardiovascular diseases remain the leading cause of mortality with nearly 20 million deaths per year globally.[1] Whereas much of the cardiovascular-associated mortality can be largely preventable with improved pharmacological management and healthcare delivery through early monitoring and timely interventions.[2,3] Traditional cardiovascular monitoring, such as the use of bulky and unsatisfactory electrocardiogram machines in hospitals for episodic diagnosis, is severely hampered by the scarcity and inconvenience of medical resources, especially in the underserved groups in the United States and low-income countries.[4] Large populations at high risk for cardiovascular diseases remain undiagnosed; therefore, there is an urgent need to develop population-wide wearable biotechnologies for continuous monitoring for prevention of cardiovascular disease.[5,6]
Arterial pulse waves represent one of the most widely detected biosignals in the human body, providing comprehensive cardiovascular information for monitoring and diagnosing arterial stiffness in association with hypertension.[7–11] Numerous wearable biomedical sensors have been developed to continuously monitor human pulse waves, including triboelectric,[11,12] piezoelectric,[13] magnetoelastic,[14] resistive,[15,16] capacitive,[17,18] ultrasonic,[19,20] transistor-based,[21] magnetic plethysmograph,[22] and photoplethysmogram-based[23] sensors. Among them, triboelectric effect based pulse wave monitoring technology has recently gained interest due to its self-powered capacity, high sensitivity, cost-effectiveness, and wearability.[24–26] Nevertheless, pulse wave signal transmitted from the artery surface are extremely weak,[27,28] and pulse-to-electricity sensing mechanisms enabled by the surface charging effect render the signal prone to interference with body motion, humidity, and respiration, resulting in a plethora of challenges for the translation to clinical application.[29–31]
In this context, we present a scalable, conformable, waterproof, and machine-learning-assisted textile triboelectric pulse sensor that can be serviceable in a sweaty state along with body motion artifacts. A hierarchically structured carbon nanotubes (CNTs) triboelectric layer facilitates the textile triboelectric sensor to achieve high sensitivity with a signal-to-noise ratio (SNR) of 23.3 dB, a response time (τ) of 40 ms, and a sensitivity up to 0.21 μA kPa−1. An integrated machine learning algorithm also facilitates blood pressure measurements comparable to a commercial blood pressure cuff. In addition, the textile triboelectric sensor is readily integrated with a wearable signal processing circuit, a Bluetooth transmission module, and a customized cellphone APP to build up a wireless cardiovascular monitoring system, which could interact with the Internet for one-click health data sharing and data-driven cardiovascular management. The machine-learning-assisted wireless textile biomonitoring system represents a solid step toward continuous and personalized arterial blood pressure monitoring in the era of Internet of Things (IoT).
2. Results
Healthcare delivery is moving from its current reactive and disease-centric system to a personalized, predictive, preventative, and anticipatory mode with a focus on disease prevention and health promotion. To this end, we propose a wireless cardiovascular monitoring system that allows for continuous acquisition of patient-generated data and one-click expert-level diagnosis for personalized healthcare as a paradigm shift, as schematically shown in Figure 1a. And the wearable bioelectronics must be adapted to daily body motions and perspiration conditions, bypassing the traditional testing in specific sites and in a stationary indoor environment (Figure S1, Supporting Information). A self-powered textile triboelectric sensor is designed to be extremely sensitive to the weak pulse for decent electrical output (Figure 1b). To realize the textile triboelectric sensor for ambulatory pulse wave monitoring, it is elaborately designed with waterproof and conformable properties, as structurally shown in Figure 1c. The outer textile layer acts as both a protective layer against airflow noise due to body motions and a waterproof layer to repel external moisture. The inner encapsulated layer of poly(dimethylsiloxane) (PDMS) is widely used as a biocompatible and waterproof material in bioelectronics.[32,33] The nonwoven fluorinated ethylene propylene (FEP) textile is a highly negative electron affinity material that is very stable and lightweight.[34,35] Another triboelectric layer is single-walled CNTs conductive network and also serves as a lead-out electrode, which is the monodispersed CNTs (Figure S2a, Supporting Information) deposited on a the hierarchically structured cotton using a scalable spray-coating method (Figure 1d,e). The CNTs percolated network exhibits a low sheet resistance of 1.2 kΩ □−1 due to the uniform distribution and form a hierarchical morphology (Figure 1f; Figure S2b, Supporting Information) that benefits from the yarn-knitted structure of cotton textile (Figure S3, Supporting Information). Figure 1g also shows the high flexibility and scalable fabrication of the CNTs/cotton film. The decent waterproof capability of the sensor was characterized by measuring the surface contact angles of the outer and inner layers, showing results of 136° and 104°, respectively (Figure 1h). The detailed information for the fabrication of textile triboelectric sensors is schematically shown in Figure S4 of the Supporting Information and presented in the Experimental Section. The cross-sectional image of the entire triboelectric sensor structure was captured in Figure S5 of the Supporting Information. As a result, the lightweight (0.27 g) and thin (225 μm) textile triboelectric sensor attached to the wrist artery is skin-conformable and wearing-comfortable for pulse wave monitoring. Meanwhile, a machine learning algorithm is proposed to automatically extract pulse features from collected pulse waves for cuffless blood pressure estimation using a supervised feedforward neural network architecture (Figure 1i).[36]
Figure 1.

Design of a textile cardiovascular monitoring system. a) A concept of the cardiovascular monitoring system based on a self-powered textile triboelectric sensor and the collected signals that can be wirelessly transmitted to a cellphone. b) Schematic diagrams showing the electricity generation of textile triboelectric sensor in response to the radial artery pulse. c) Schematic structure of the textile triboelectric sensor. d) Spray-coating monodispersed CNTs solution onto cotton textile to form a conductive network. e) CNTs conductive network uniformly distributed on cotton textile. f) SEM image of the hierarchically structured CNTs textile. Scale bar: 300 μm. g) Photograph showing the spray-coated CNTs textile. Scale bar: 3 cm. h) Waterproof performance of textile triboelectric sensor. i) Architecture of the supervised feedforward neural network for blood pressure prediction. HR, AI, and RWTT are short for heart rate, augmentation index, and reflected wave transit time, respectively.
The proposed textile triboelectric sensor for pulse monitoring is the amalgamation of triboelectric effect with electrostatic induction that convert biomechanical pressure into electricity.[37–39] The gentle intra-arterial pressure due to the systolic and diastolic behavior of the heart will rise and fall, resulting in perceptible pulse beating at the shallower part of the radial artery surface.[12] The periodical pressure can initiate a relative motion between CNTs and FEP to fulfill the contact–separation process. Consequently, an alternating current of the textile triboelectric sensor will be generated with the periodically increased and decreased pulse pressure during the blood circulation. The process of contact electrification can be well described by an atomic-scale-electron-cloud potential-well model between FEP and CNTs triboelectric layers (Figure 2a; Figure S6, Supporting Information). Accordingly, the electrical output of the textile triboelectric sensor is due to the electrostatic induction with a contact–separation operation model (Figure S7, Supporting Information). A more detailed explanation of the working mechanisms of the textile triboelectric sensor is presented in Note S1 of the Supporting Information.
Figure 2.

Electrical and mechanical characterizations of the textile triboelectric sensor. a) Atomic-scale-electron-cloud potential-well model to describe the contact electrification between FEP and CNTs. b) Simulated potential distribution around the CNTs and FEP with a gap distance of 2 mm. c) ISC performance of textile triboelectric sensor measured by periodically applying the pressure with a pressure of 40 Pa at different frequencies of 0.5, 1, 2, and 3 Hz, respectively. d) ISC performance of textile triboelectric sensor measured by periodically applying the pressure with a frequency of 1 Hz at a different pressure of 10, 20, 30, and 40 Pa, respectively. e–g) τ, SNR, sensitivity, and electrical output stability of textile triboelectric sensor.
The hierarchical structure on the triboelectric layer can endow the textile triboelectric sensor high sensitivity like many other well-designed microstructures.[40–43] Additionally, it has a higher electrical output due to the increased surface area, which has been verified by finite element simulation (Figure 2b; Figure S8a, Supporting Information). The results show that the electric potential distributions the hierarchically structured CNTs-based device is much different and the open-circuit voltage (VOC) is much higher compared to that of the planar one at the same gap distance of CNTs and FEP layers (Figure S8b, Supporting Information). This result lays a good foundation for decent signal-to-noise ratio as a highly sensitive sensor in pulse monitoring.
The mechanical-to-electrical conversion performance of the textile triboelectric sensor was systematically investigated. Short-circuit current (ISC) was demonstrated at different frequencies and pressure. At a constant frequency of 1 Hz close to the pulse frequency, ISC increases with the extremely low pressure and has a decent output at 40 Pa (Figure 2c). ISC was also measured at 40 Pa and increased with frequency from 0.5 to 3 Hz (Figure 2d). The responsiveness of textile triboelectric sensor was also extracted from ISC curves at a frequency of 1 Hz and pressure of 40 Pa. The results show that ISC signals have a SNR value of 23.3 and τ of 40 ms, respectively (Figure 2e). The sensitivity of the textile triboelectric sensor was estimated as 0.21 μA kPa−1 with a high linear working range under low pulse-magnitude pressure (Figure 2f). The performance of the textile triboelectric sensor was also characterized by the Voc signal as shown in Figure S9 of the Supporting Information. A simplified model was also built to analyze the electricity generation and sensing performance of the textile triboelectric sensor (Figure S10, Supporting Information) and the detailed discussion was included in Note S2 of the Supporting Information.
As demonstrated in triboelectric effect based ultralow-pressure sensing, frequency-dependent ISC is more suitable to measure a dynamic input such as rapid vibration and pulse.[44] Therefore, ISC was selected as to monitor the pulse wave with multiple characteristic peaks (Figure S11, Supporting Information).[44] Additionally, ISC also exhibited outstanding stability even after 10 000 cycles, which results from the excellent stability of CNTs coated on cotton as demonstrated by the conductivity stability of the CNTs textile (Figure S12, Supporting Information). Therefore, the textile triboelectric sensor could hold a collection of compelling features, including high sensitivity, short response time, and stability, which are conducive to pulse monitoring for long-term cardiovascular management.
As schematically shown in Figure 3a, the blood in the human body is squeezed into the aorta through the contraction of the left ventricle and then transferred to the systemic arteries.[45] However, this important physiological function of blood circulation is generally prone to dysfunction due to atherosclerosis, which is considered to be the most common acquired factor leading to cardiovascular disease.[46] As a typical peripheral vascular disease in the population, atherosclerosis degrades vascular function including the deposition of fat material and cholesterol inside the blood vessels, thus causing the blood vessels to become irregular and the wall stiffness also degrades (Figure 3b). Consequently, blood pressure varies with the vascular state and wall stiffness, which can therefore be well reflected on pulse waveform (Figure 3c). A detailed explanation of the pulse waveform related to the increase and decrease of intra-arterial blood pressure induced by systolic and diastolic processes of the heart was presented in Note S3 of the Supporting Information. The textile triboelectric sensor attached to the radial artery can obtain high fidelity and all pulse wave characteristics that follow the fundamental rhythm of the heartbeat at a normal stationary state (Figure 3d). In addition, it can also function well for pulse monitoring even in moving (Figure 3e) and moisture (Figure 3f) conditions. This is due to the soft and waterproof layer textile that can resist environmental interference such as airflow noise and repel the external moisture to hold free charge.
Figure 3.
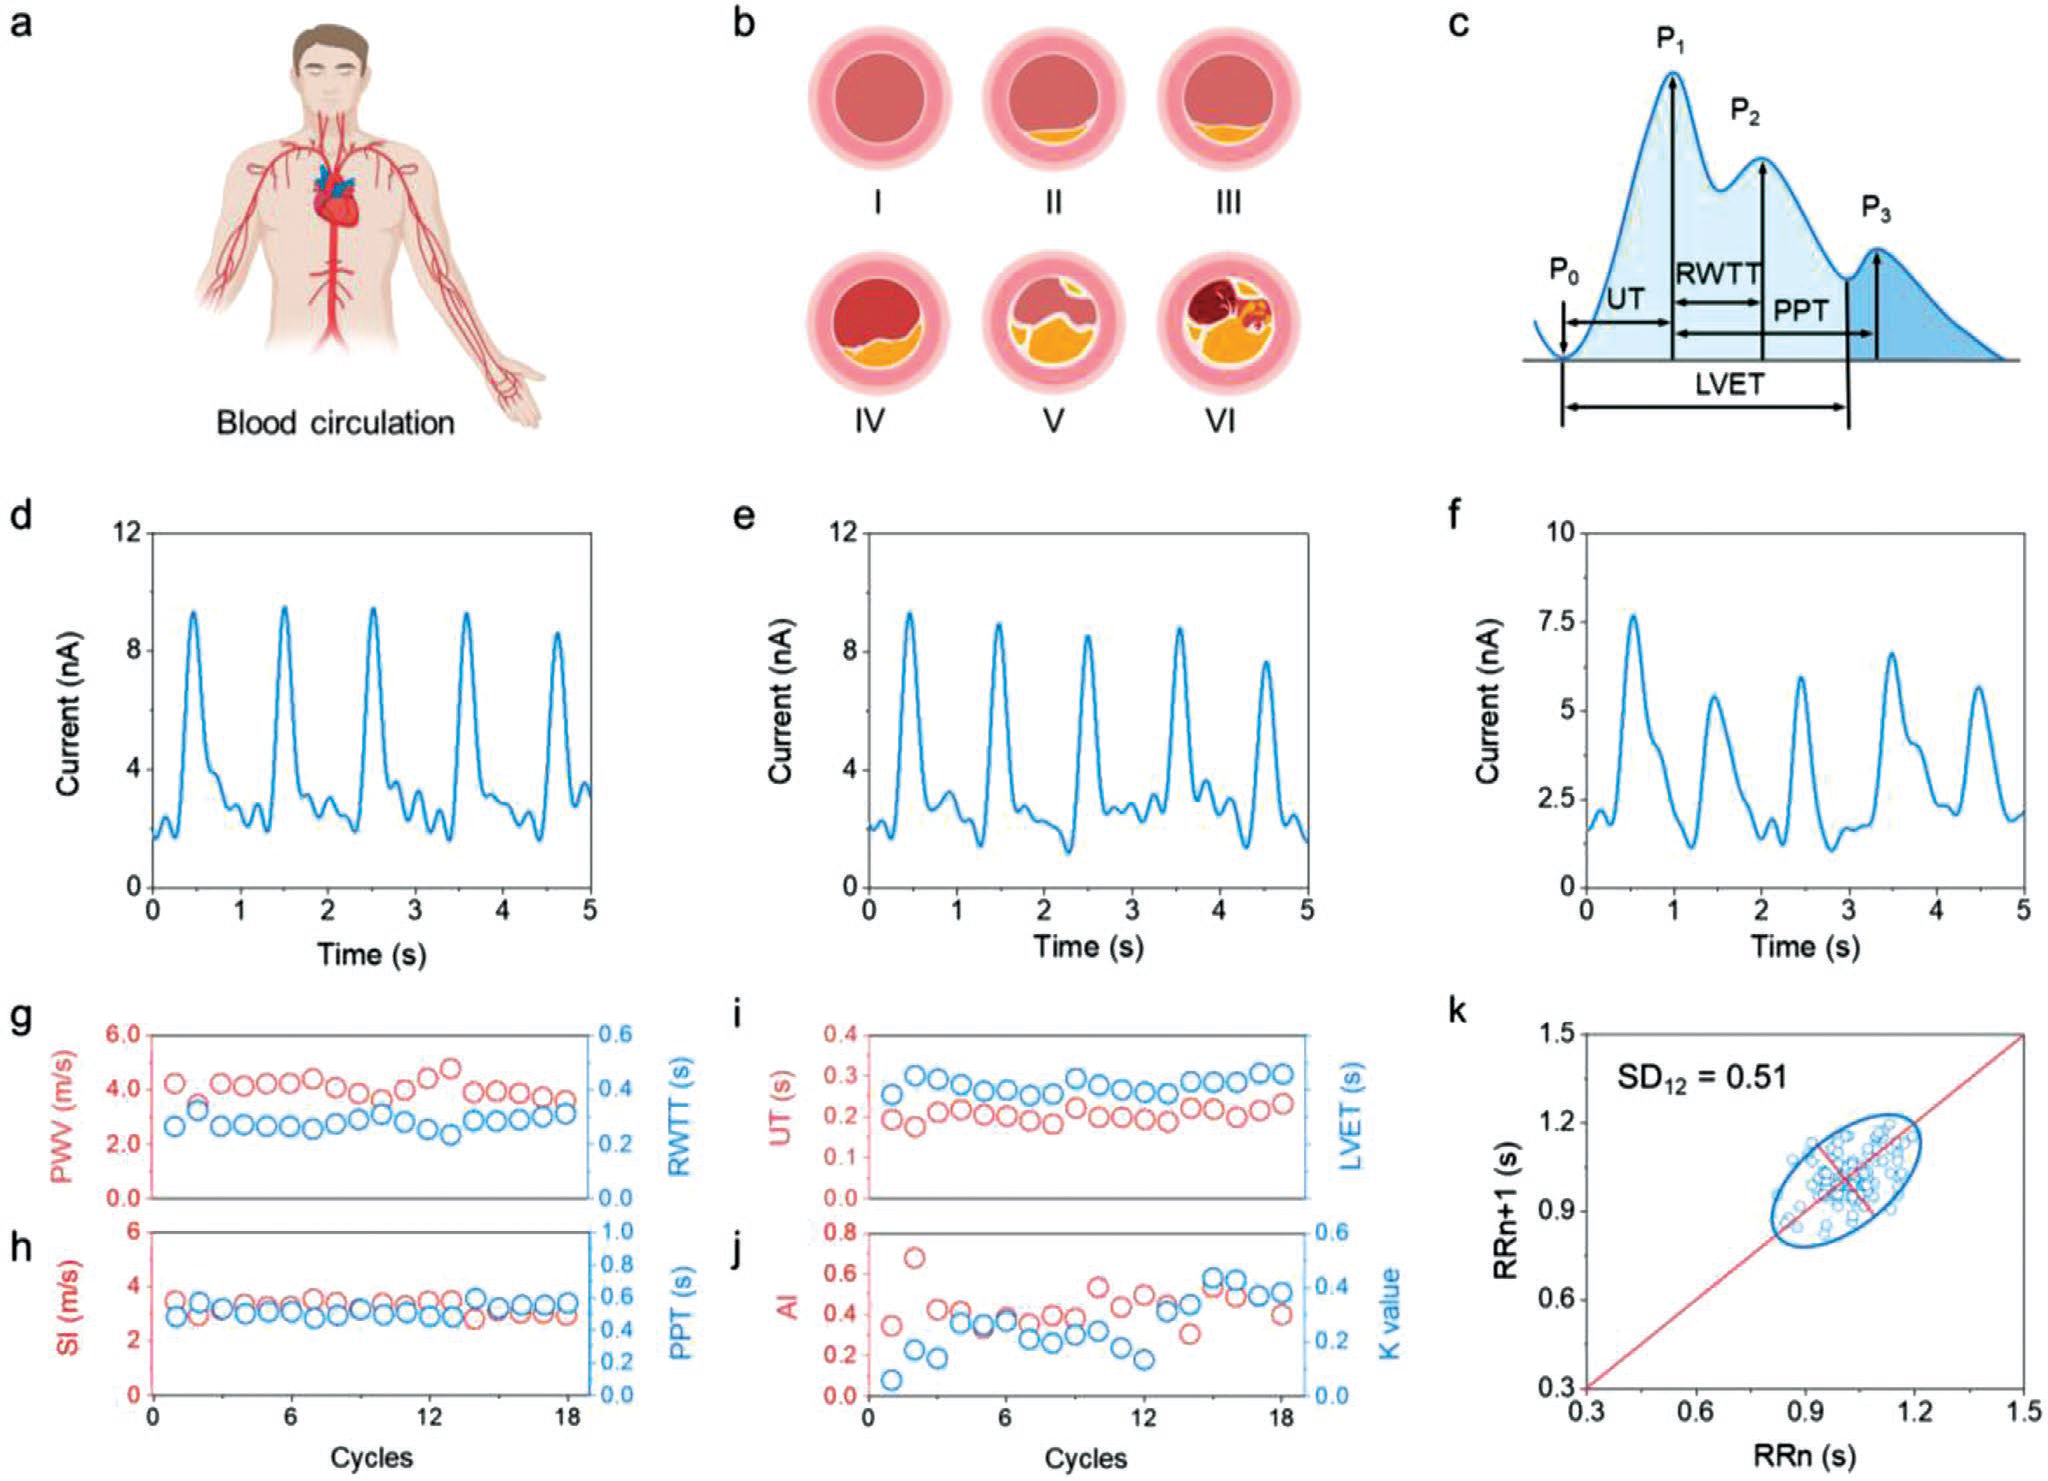
Textile triboelectric sensor for cardiovascular monitoring with body motions and moisture. a) Schematic illustration of the blood circulation in the human body. b) Schematic drawings of the atherosclerosis progression process in the blood vessel with the process of initial lesion (I), fatty streak (II), intermediate lesion (III), atheroma (IV), fibrous plaque (V), and complicated lesion or rupture (VI). c) Typical contour plot of the human arterial pulse wave. d–f) ISC performance of the cardiovascular textile triboelectric sensor under varying environments of stationary, moving, and humid conditions. g–j) Systolic upstroke time (UT), RWTT, left ventricular ejection time (LVET), systolic–diastolic time (PPT), pulse wave velocity (PWV), stiffness index (SI), AI, and characteristic K value obtained from continuous pulse monitoring. k) Poincare plot of the test subject.
The cardiovascular monitoring is comprehensively discussed based on the assessment method as presented in Note S4 of the Supporting Information. From the continuous pulse monitoring of a 30-year male subject (Figure S13, Supporting Information), UT, RWTT, LVET, PPT, PWV, SI, AI, and K values as shown in Figure 3g–j, all of which are correlated with the reported reference values of healthy individuals.[27] Cardiovascular conditions were also assessed by HR and standard deviation of heart beat interval (SDNN), which are the most commonly used parameters in clinical diagnosis. They were calculated as 59 beats per minute and 91.1 ms, respectively, which are also in the standard reference range (Figure S14, Supporting Information). Figure 3k shows a mapped scatter points plot of pulse interval (Ti) to reflect the heart rate variability known as the Poincare plot. It exhibits a standard comet-like shape with an SD12 value of 0.51, indicating a coordinated heartbeat with the nervous system.
Combining the data collected using the textile triboelectric sensor with machine learning algorithms, it is expected to realize cuffless blood pressure estimation from extracted pulse wave features (Figure 4a). A trained neural network takes these extracted features as inputs and generates two outputs representing the systolic and diastolic blood pressure. Based on our trained neural network model, systolic and diastolic blood pressure are continuously estimated to be 117.3 and 70.2 mmHg with standard deviations of 3.06 and 3.50 (Figure 4b). Compared to the values validated by commercial cuffs at the medical center of University of California, Los Angeles (Figure S15, Supporting Information), they have only relatively small mean deviations of only 2.9% and 1.2%, respectively (Figure 4c), which demonstrate the high reliability of machine learning for estimating blood pressure.
Figure 4.
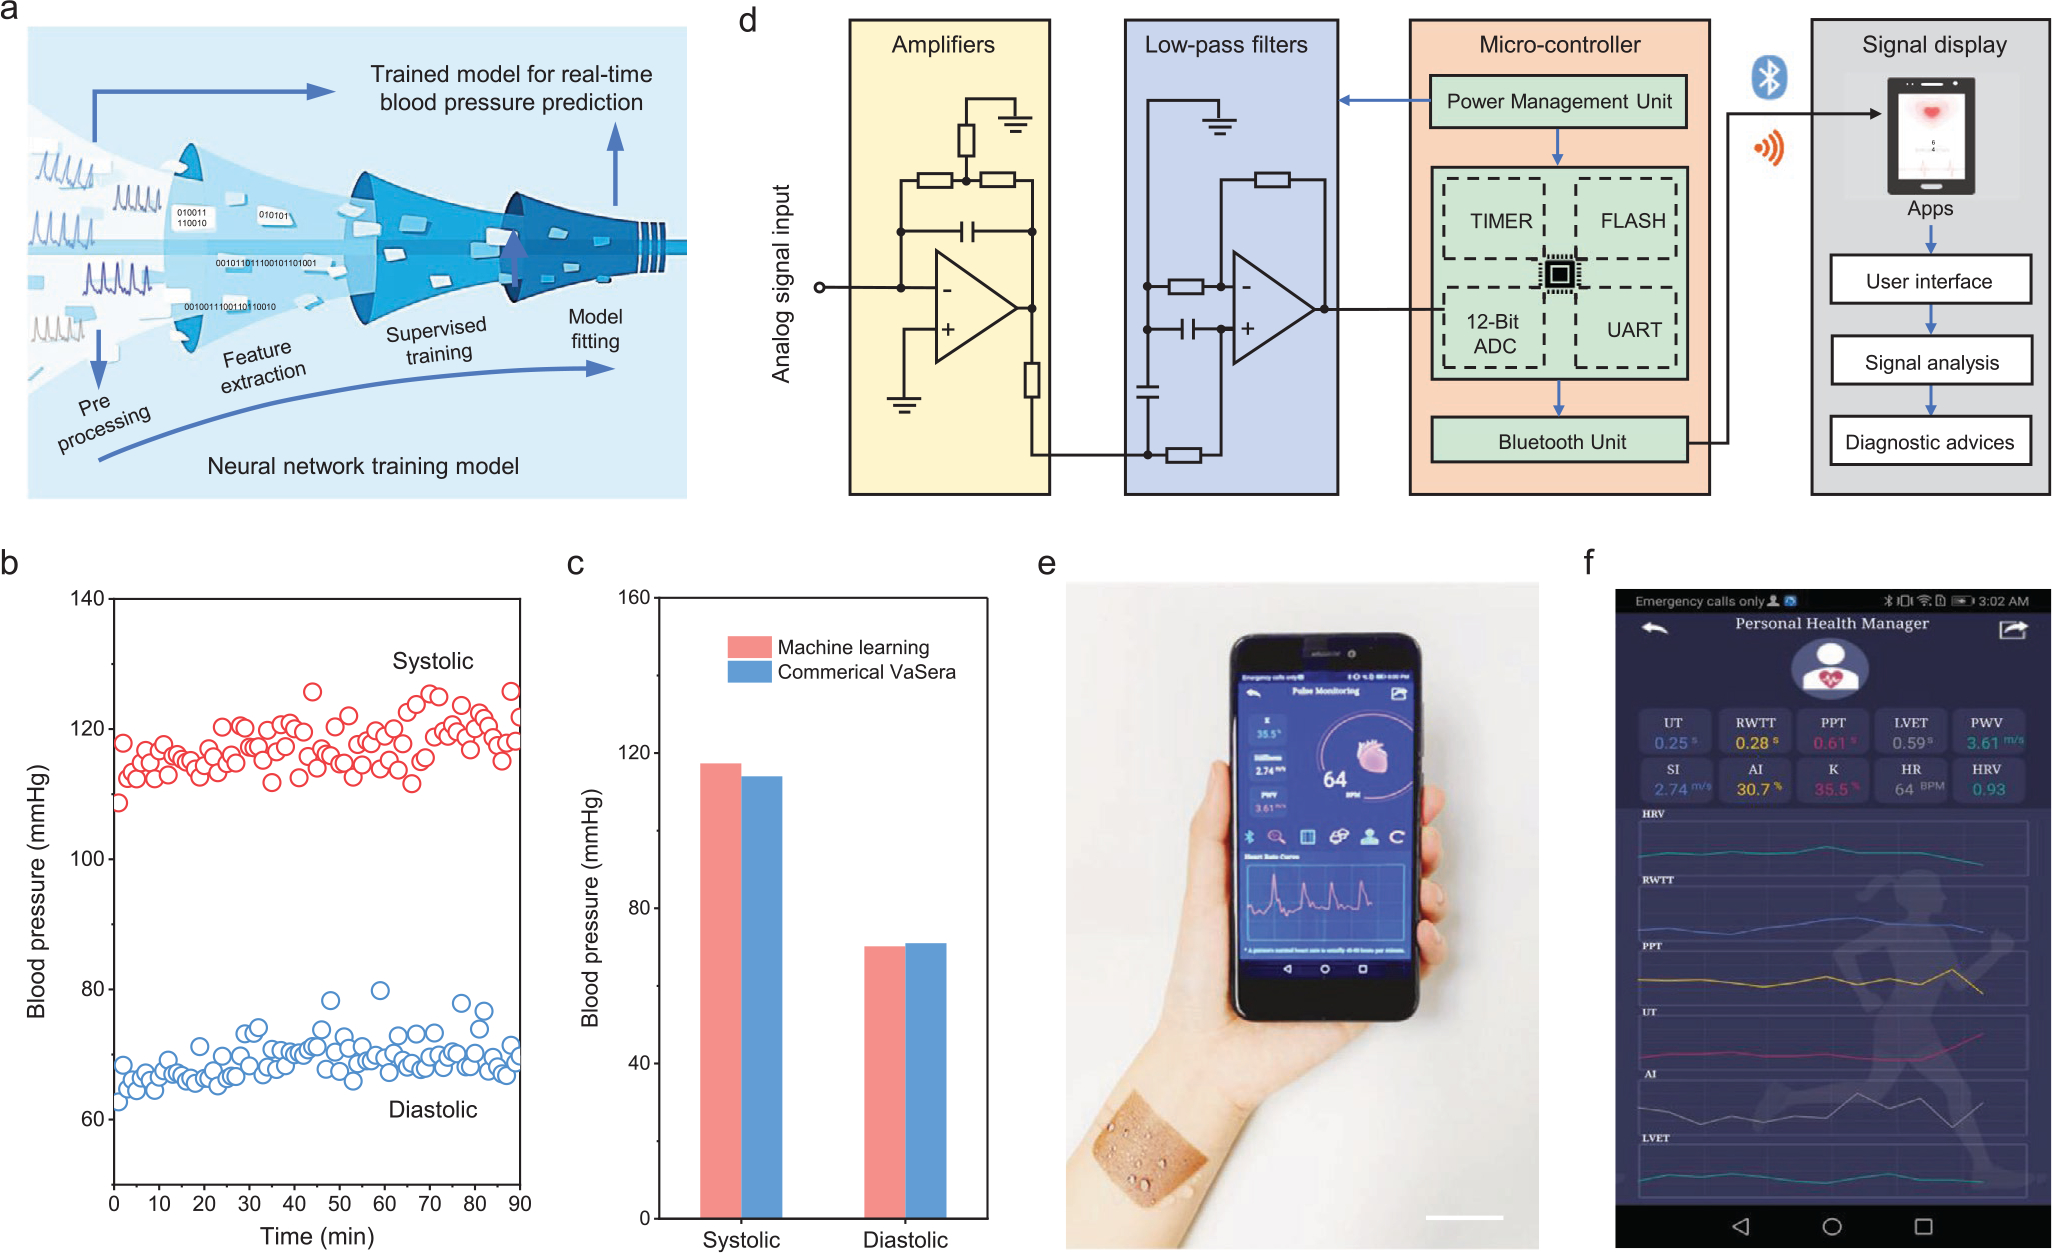
Design of a body-area-network constructed personalized cardiovascular monitoring system. a) Estimation of the blood pressure from the measured pulse signal using a machine learning technique. b) Systolic and diastolic blood pressure estimated using machine learning. c) Evaluated blood pressure validated using a commercial cuff. d) A schematic diagram of the textile triboelectric sensor-based biosignal management circuit composed of four components of data acquisition, signal processing, wireless transmission, and signal display. e) A photograph of the harsh environment-tolerant textile triboelectric sensor-enabled real-time pulse monitoring using a mobile phone. Scale bar: 3 cm. f) Cardiovascular conditions displayed on a cellphone interface using a customized APP program.
To improve user friendliness, we took a further step to build up a real-time platform from the collection of cardiovascular signals to display the processed results, including a textile triboelectric sensor, a signal processing circuit, a Bluetooth transmission module, and a customized APP program. Figure 4d illustrates the implementation schematic in both hardware and software for the manipulation of monitored pulse wave from the analog signal acquisition to customized mobile terminal displays. As shown in Figure 4e, the cardiovascular characterization of a tester can be wirelessly transmitted to a mobile phone and displayed on a customized APP program (Figure S16, Supporting Information). The APP program can also measure real-time cardiovascular condition by processing the pulse wave data using a feature peak search and calibration algorithm (Figure 4f). On top of that, the APP program is also capable of uploading the collected data to the cloud database for long-term data-based analysis with improved accuracy (Figure S17, Supporting Information), or sharing the cardiovascular information with the clinicians via email or message (Figure S18, Supporting Information). As such, this system is able to provide a reliable paradigm for population-wide cardiovascular care and circumvent the unpredictability of cardiovascular events even with the variable daily activities of an individual (Video S1, Supporting Information). Consequently, it enables cardiovascular monitoring, signal transmitting-processing-storing-sharing, automatic diagnosis, providing a personalized diagnosis in an ambulatory round-up.
3. Conclusion
We have developed a machine-learning-assisted wearable textile triboelectric sensor for long-term and continuous high-fidelity pulse monitoring and cardiovascular condition assessment. It holds a collection of compelling parameters, including a light weight of 0.27 g, a thickness of 225 μm, a SNR value of 23.3 dB, τ of 40 ms, and a sensitivity of 0.21 μA kPa−1. With the assistance of a machine learning technique, it can perform timely cardiovascular system management in a cuffless manner even with body motion and in a humid environment. The measured systolic and diastolic pressure results were validated via a commercial blood pressure cuff in the hospital. Above all, the developed textile triboelectric sensor enabled wireless biomonitoring system is a solid step toward ambulatory personalized cardiovascular system characterization in the era of IoT.
4. Experimental Section
Fabrication of Conductive CNTs Textile:
Single-walled CNTs powder purchased from Carbon Solutions Inc. (P3-CNTs, 10 mg) was added to the mixed solution of isopropyl alcohol (IPA, 18 mL) and water (2 mL). The solution was then dispersed using a tip horn sonicator for 2 h and centrifuged at 8000 rpm for 15 min to remove the nondispersed particles. The prepared CNTs solution was spray-coated on clean, dry, and cotton textile using a Model S68 airbrush with a distance of 10 cm. Afterward, the CNTs-coated textile was naturally dried at ambient conditions and used as triboelectric layer.
Fabrication of Al Electrode:
Commercial FEP film (26 μm) was cleaned stepwise in ultrasonic baths of deionized (DI) water with detergent, DI water, ethanol, and DI water for 15 min, respectively. The film was blown with N2 and dried in a 60 °C oven for 1 h. The clean FEP film was then transferred into the vacuum evaporation chamber in a N2-filled glovebox. Al electrode (100 nm) was deposited at a rate of 0.5 nm s−1 and a base pressure of 3 × 10⁻⁶ Torr.
Fabrication of Waterproof Textile Triboelectric Sensor:
The CNTs textile was cut into 2 cm × 2 cm and adhered to the waterproof Band-Aid bandage. The double-sided adhesive tape (200 μm) was bonded onto the CNTs textile as a spacer and the FEP film side was firmly attached. Two thin copper wires were used to lead out the test electrodes from CNTs textile and Al surfaces. A thin layer of liquid PDMS solution (Sylgard184 from Dow Corning with a mixed weight ratio of 10:1) was spin-coated on the Al surface at 3000 rpm for 45 s. Finally, the fabricated device was placed in a 60 °C oven for 2 h to fully cure the PDMS layer.
Machine Learning for Blood Pressure Estimation:
A published cuffless blood pressure estimation data set was used to validate the proposed machine learning model.[36] To perform the supervised learning, photoplethysmography signals were used as input and predicted arterial blood pressure values were compared with the test values in the dataset. Specifically, four features of HR, AI, RWTT, and K were extracted from the data collected. Afterward, a neural network was trained with extracted features as input, generating the systolic and the diastolic blood pressure. The smallest absolute deviation was used as the loss function. As for data partitions, 80% of the data was used for training, 10% of the data was used for validation, and 10% of the data was used for testing. Thus, a well-trained model with optimal model parameters was built for real-time blood pressure prediction. Then the pulse wave of a 30-year male tester was measured for 1.5 h using the textile cardiovascular sensor. Finally, systolic and diastolic blood pressure were assessed from the collected data and the predicted results were validated using a commercial cuff at UCLA medical center (Vascular Screening System VaSera VS-1500N).
Design of the Wireless Pulse Monitoring System:
The pulse monitoring system is composed of hardware and software components. After receiving the analog pulse signals from the textile triboelectric sensor, the analog circuit with an amplifier (MCP6001) amplifies the acquired signals and a low-pass filter (op07) removes both interference signals and environmental noise. An analog-to-digital converter based on a microcontroller (STM32) unit is used to convert the amplified analog pulse signals to digital signals for subsequent processing. Afterward, the microcontroller unit with both computational and serial communication capabilities analyzes the converted pulse signal. Finally, an on-board Bluetooth module (HC-05) is added to transmit the digital signal to the mobile phone terminal application via wireless communication.
A Customized Pulse Monitoring APP:
A customized health monitoring Android APP (named Pulse_Monitoring) was developed via MIT AI2 Companion. It could continuously receive the converted pulse signals and then provide further analysis of the cardiovascular condition. Important cardiovascular parameters of UT, RWTT, LVET, PPT, PWV, SI, AI, K, and HR were calculated with the assistance of a feature peak search and calibration algorithm. Therefore, after a series of algorithmic processes, a real-time health scale can be displayed on the app screen and provide users with timely cardiovascular condition feedback. It can also store the health data on a cloud database and share the cardiovascular information to the clinicians over a distance by email or message, and link the treatment and medical system services in a round-up.
Electricity Generation Simulation:
2D electrostatic model in COMSOL Multiphysics was used to simulate electricity generation and output performance of the hierarchical and plane structured devices. Both the transferred triboelectric charge densities of the two triboelectric layers were assigned to the inner surfaces as 2 μC m−2 and floating potentials were applied at the outer surfaces with an initial voltage of 0 V. The air gap between the two layers was adjusted from 0 to 2 mm, and the resulting potential distributions and the potential differences of the two different structures could be simulated for comparison.
Human Subject Study:
The textile triboelectric sensor used for wearable cardiovascular monitoring was performed using human subjects in compliance with all the ethical regulations under a protocol (ID: 20–001882) that was approved by the Institutional Review Board at University of California, Los Angeles. All participating subjects belonged to University of California, Los Angeles and provided informed consent before participation in the study.
Characterizations and Measurements:
Contact angles of the outer surfaces of a Band-Aid bandage and PDMS were characterized with an APPR telescope-goniometer. SEM images of the hierarchical CNTs textile were obtained using an FEI Nova Nano 230 scanning electron microscope. Electrical output of the textile triboelectric sensor was measured at the different applied forces and frequencies. VOC and ISC were collected using a voltage electrometer (Keithley 6514 System Electrometer) and a low-noise current preamplifier (Stanford Research System SR570), respectively. Real-time data acquisition and analysis were realized using the LabVIEW software platform. The conductivity stability (resistance) of CNTs textile and the output stability of the textile triboelectric sensor were recorded under the periodic trigger of a linear motor with a frequency of 1 Hz. The textile triboelectric sensor attached to the wrist artery was used to collect pulse waves using SR570 under stationary, moving and humid conditions.
Supplementary Material
Acknowledgements
The authors acknowledge the Henry Samueli School of Engineering & Applied Science and the Department of Bioengineering at the University of California, Los Angeles for the startup support. J.C. also acknowledges the 2020 Okawa Foundation Research Grant and the 2021 Hellman Fellows Fund. Validation for blood pressure (VASera) was supported by the National Institutes of Health (HL118650, HL111437, and HL118650) to T.K.H. The authors also want to thank the full support from the Medical Center of University of California, Los Angeles.
Footnotes
Conflict of Interest
The authors declare no conflict of interest.
Supporting Information
Supporting Information is available from the Wiley Online Library or from the author.
Contributor Information
Yunsheng Fang, Department of Bioengineering University of California Los Angeles, Los Angeles, CA 90095, USA.
Yongjiu Zou, Department of Bioengineering University of California Los Angeles, Los Angeles, CA 90095, USA.
Jing Xu, Department of Bioengineering University of California Los Angeles, Los Angeles, CA 90095, USA.
Guorui Chen, Department of Bioengineering University of California Los Angeles, Los Angeles, CA 90095, USA.
Yihao Zhou, Department of Bioengineering University of California Los Angeles, Los Angeles, CA 90095, USA.
Weili Deng, Department of Bioengineering University of California Los Angeles, Los Angeles, CA 90095, USA.
Xun Zhao, Department of Bioengineering University of California Los Angeles, Los Angeles, CA 90095, USA.
Mehrdad Roustaei, School of Medicine University of California Los Angeles, Los Angeles, CA 90095, USA; Department of Bioengineering University of California Los Angeles, Los Angeles, CA 90095, USA.
Tzung K. Hsiai, School of Medicine University of California Los Angeles, Los Angeles, CA 90095, USA Department of Bioengineering University of California Los Angeles, Los Angeles, CA 90095, USA.
Jun Chen, Department of Bioengineering University of California Los Angeles, Los Angeles, CA 90095, USA.
Data Availability Statement
The data that support the findings of this study are available from the corresponding author upon reasonable request.
References
- [1].Benjamin EJ, Muntner P, Alonso A, Bittencourt MS, Callaway CW, Carson AP, Chamberlain AM, Chang AR, Cheng S, Das SR, Delling FN, Djousse L, Elkind MSV, Ferguson JF, Fornage M, Jordan LC, Khan SS, Kissela BM, Knutson KL, Kwan TW, Lackland DT, Lewis TT, Lichtman JH, Longenecker CT, Loop MS, Lutsey PL, Martin SS, Matsushita K, Moran AE, Mussolino ME, O’Flaherty M, Pandey A, Perak AM, Rosamond WD, Roth GA, Sampson UKA, Satou GM, Schroeder EB, Shah SH, Spartano NL, Stokes A, Tirschwell DL, Tsao CW, Turakhia MP, VanWagner LB, Wilkins JT, Wong SS, Virani SS, Circulation 2019, 139, 56. [Google Scholar]
- [2].Thomas H, Diamond J, Vieco A, Chaudhuri S, Shinnar E, Cromer S, Perel P, Mensah GA, Narula J, Johnson CO, Roth GA, Moran AE, Global Heart 2018, 13, 143. [DOI] [PubMed] [Google Scholar]
- [3].Tat T, Libanori A, Au C, Yau A, Chen J, Biosens. Bioelectron. 2021, 171, 112714. [DOI] [PubMed] [Google Scholar]
- [4].Brainin M, Sliwa K, Lancet 2020, 396, 533. [DOI] [PMC free article] [PubMed] [Google Scholar]
- [5].Krittanawong C, Rogers AJ, Johnson KW, Wang Z, Turakhia MP, Halperin JL, Narayan SM, Nat. Rev. Cardiol. 2020, 18, 75. [DOI] [PMC free article] [PubMed] [Google Scholar]
- [6].Lukas H, Xu C, Yu Y, Gao W, ACS Nano 2020, 14, 16180. [DOI] [PubMed] [Google Scholar]
- [7].Chen G, Au C, Chen J, Trends Biotechnol. 2021, 10.1016/j.tibtech.2020.12.011. [DOI] [PubMed] [Google Scholar]
- [8].Fang Y, Zhao X, Tat T, Xiao X, Chen G, Xu J, Chen J, Matter 2021, 4, 1102. [Google Scholar]
- [9].Zhang S, Bick M, Xiao X, Chen G, Nashalian A, Chen J, Matter 2021, 4, 845. [Google Scholar]
- [10].Meng K, Chen J, Li X, Wu Y, Fan W, Zhou Z, He Q, Wang X, Fan X, Zhang Y, Yang J, Wang ZL, Adv. Funct. Mater. 2019, 29, 1806388. [Google Scholar]
- [11].Lin Z, Chen J, Li X, Zhou Z, Meng K, Wei W, Yang J, Wang ZL, ACS Nano 2017, 11, 8830. [DOI] [PubMed] [Google Scholar]
- [12].Meng K, Zhao S, Zhou Y, Wu Y, Zhang S, He Q, Wang X, Zhou Z, Fan W, Tan X, Yang J, Chen J, Matter 2020, 2, 896. [Google Scholar]
- [13].Park DY, Joe DJ, Kim DH, Park H, Han JH, Jeong CK, Park H, Park JG, Joung B, Lee KJ, Adv. Mater. 2017, 29, 1702308. [DOI] [PubMed] [Google Scholar]
- [14].Zhou Y, Zhao X, Xu J, Fang Y, Chen G, Song Y, Li S, Chen J, Nat. Mater. 2021, 20, 1300. [DOI] [PubMed] [Google Scholar]
- [15].Pang C, Lee GY, Kim TI, Kim SM, Kim HN, Ahn SH, Suh KY, Nat. Mater. 2012, 11, 795. [DOI] [PubMed] [Google Scholar]
- [16].Ma C, Xu D, Huang YC, Wang P, Huang J, Zhou J, Liu W, Li ST, Huang Y, Duan X, ACS Nano 2020, 14, 12866. [DOI] [PubMed] [Google Scholar]
- [17].Huang Y-C, Liu Y, Ma C, Cheng H-C, He Q, Wu H, Wang C, Lin C-Y, Huang Y, Duan X, Nat. Electron. 2020, 3, 59. [Google Scholar]
- [18].Xiong Y, Shen Y, Tian L, Hu Y, Zhu P, Sun R, Wong C-P, Nano Energy 2020, 70, 104436. [Google Scholar]
- [19].Wang C, Li X, Hu H, Zhang L, Huang Z, Lin M, Zhang Z, Yin Z, Huang B, Gong H, Bhaskaran S, Gu Y, Makihata M, Guo Y, Lei Y, Chen Y, Wang C, Li Y, Zhang T, Chen Z, Pisano AP, Zhang L, Zhou Q, Xu S, Nat. Biomed. Eng. 2018, 2, 687. [DOI] [PMC free article] [PubMed] [Google Scholar]
- [20].Sempionatto JR, Lin M, Yin L, De la Paz E, Pei K, Sonsa-Ard T, de Loyola Silva AN, Khorshed AA, Zhang F, Tostado N, Xu S, Wang J, Nat. Biomed. Eng. 2021, 5, 737. [DOI] [PubMed] [Google Scholar]
- [21].Schwartz G, Tee BC-K, Mei J, Appleton AL, Kim DH, Wang H, Bao Z, Nat. Commun. 2013, 4, 1859. [DOI] [PubMed] [Google Scholar]
- [22].Nabeel PM, Joseph J, Sivaprakasam M, IEEE Trans. Biomed. Circuits Syst. 2017, 11, 1065. [DOI] [PubMed] [Google Scholar]
- [23].Yokota T, Nakamura T, Kato H, Mochizuki M, Tada M, Uchida M, Lee S, Koizumi M, Yukita W, Takimoto A, Someya T, Nat. Electron. 2020, 3, 113. [Google Scholar]
- [24].Yang J, Chen J, Su Y, Jing Q, Li Z, Yi F, Wen X, Wang Z, Wang ZL, Adv. Mater. 2015, 27, 1316. [DOI] [PubMed] [Google Scholar]
- [25].Xu C, Wang AC, Zou H, Zhang B, Zhang C, Zi Y, Pan L, Wang P, Feng P, Lin Z, Wang ZL, Adv. Mater. 2018, 30, 1803968. [DOI] [PubMed] [Google Scholar]
- [26].Wang ZL, Adv. Energy Mater. 2020, 10, 2000137. [Google Scholar]
- [27].Chen S, Wu N, Lin S, Duan J, Xu Z, Pan Y, Zhang H, Xu Z, Huang L, Hu B, Zhou J, Nano Energy 2020, 70, 104460. [Google Scholar]
- [28].Dagdeviren C, Shi Y, Joe P, Ghaffari R, Balooch G, Usgaonkar K, Gur O, Tran PL, Crosby JR, Meyer M, Su Y, Chad Webb R, Tedesco AS, Slepian MJ, Huang Y, Rogers JA, Nat. Mater. 2015, 14, 728. [DOI] [PubMed] [Google Scholar]
- [29].Graham SA, Chandrarathna SC, Patnam H, Manchi P, Lee J-W, Yu JS, Nano Energy 2021, 80, 105547. [Google Scholar]
- [30].Lin Z, Yang J, Li X, Wu Y, Wei W, Liu J, Chen J, Yang J, Adv. Funct. Mater. 2018, 28, 1704112. [Google Scholar]
- [31].Zhao X, Askari H, Chen J, Joule 2021, 5, 1391. [Google Scholar]
- [32].Fang Y, Li Y, Wang X, Zhou Z, Zhang K, Zhou J, Hu B, Small 2020, 16, 2000450. [DOI] [PubMed] [Google Scholar]
- [33].Zhou Z, Chen K, Li X, Zhang S, Wu Y, Zhou Y, Meng K, Sun C, He Q, Fan W, Fan E, Lin Z, Tan X, Deng W, Yang J, Chen J, Nat. Electron. 2020, 3, 571. [Google Scholar]
- [34].Zou H, Zhang Y, Guo L, Wang P, He X, Dai G, Zheng H, Chen C, Wang AC, Xu C, Wang ZL, Nat. Commun. 2019, 10, 1427. [DOI] [PMC free article] [PubMed] [Google Scholar]
- [35].Deng W, Zhou Y, Zhao X, Zhang S, Zou Y, Xu J, Yeh MH, Guo H, Chen J, ACS Nano 2020, 14, 9050. [DOI] [PubMed] [Google Scholar]
- [36].Kachuee M, Kiani MM, Mohammadzade H, Shabany M, IEEE Trans. Biomed. Eng. 2017, 64, 859. [DOI] [PubMed] [Google Scholar]
- [37].Zhou Y, Deng W, Xu J, Chen J, Cell Rep. Phys. Sci. 2020, 1, 100142. [Google Scholar]
- [38].Xu Q, Fang Y, Jing Q, Hu N, Lin K, Pan Y, Xu L, Gao H, Yuan M, Chu L, Ma Y, Xie Y, Chen J, Wang L, Biosens. Bioelectron. 2021, 187, 113329. [DOI] [PMC free article] [PubMed] [Google Scholar]
- [39].Li X, Tat T, Chen J, Trends Chem. 2021, 10.1016/j.trechm.2021.04.009. [DOI] [Google Scholar]
- [40].Zou Y, Xu J, Chen K, Chen J, Adv. Mater. Technol. 2021, 6, 2000916. [Google Scholar]
- [41].Kim Y, Chortos A, Xu W, Liu Y, Oh JY, Son D, Kang J, Foudeh AM, Zhu C, Lee Y, Science 2018, 360, 998. [DOI] [PubMed] [Google Scholar]
- [42].Boutry CM, Negre M, Jorda M, Vardoulis O, Chortos A, Khatib O, Bao Z, Sci. Rob. 2018, 3, 6914. [DOI] [PubMed] [Google Scholar]
- [43].Chortos A, Liu J, Bao Z, Nat. Mater. 2016, 15, 937. [DOI] [PubMed] [Google Scholar]
- [44].Cao Z, Chu Y, Wang S, Ye X, Nano Energy 2021, 79, 105450. [Google Scholar]
- [45].Avolio AP, Butlin M, Walsh A, Physiol. Meas. 2010, 31, R1. [DOI] [PubMed] [Google Scholar]
- [46].Seidelmann SB, Claggett B, Bravo PE, Gupta A, Farhad H, Klein BE, Klein R, Di Carli M, Solomon SD, Circulation 2016, 134, 1328. [DOI] [PMC free article] [PubMed] [Google Scholar]
Associated Data
This section collects any data citations, data availability statements, or supplementary materials included in this article.
Supplementary Materials
Data Availability Statement
The data that support the findings of this study are available from the corresponding author upon reasonable request.