Abstract
The quantification of cerebrospinal fluid (CSF), specifically the extra-axial cerebrospinal fluid (EA-CSF), which is the CSF in the subarachnoid space surrounding the cortical surface of the brain, has recently been shown to play an important role in the neuropathology of autism spectrum disorder (ASD) in infants. While prior work addressed measuring the global volume of EA-CSF, there was no available tool that quantifies the local, anatomical distribution of the EA-CSF. A localized EA-CSF quantification would provide more accurate and interpretable measurements. In our recent work, we proposed such a local EA-CSF extraction by using a pipeline that combines probabilistic brain tissue segmentation, cortical surface reconstruction and streamline-based local EA-CSF quantification. Yet, that system had several shortcomings, in particular a lack of available software tools, as well as a quantification where EA-CSF portions are counted multiple times. The purpose of this article is to present a novel, graphical user interface based, publicly available software tool, called LocalEACSF, which allows the user to easily run an adapted version of this pipeline and provide a set of straightforward quality control visualizations to assess the quality of the EA-CSF quantification. This tool further adds improvements and optimizations to the prior assessment. The LocalEACSF tool allows neuroimaging labs to compute a local extraction of extra-axial CSF in their neuroimaging studies in order to investigate its role in normal and atypical brain development, without the need for extensive technical knowledge.
Keywords: Cerebrospinal Fluid, Extra-axial CSF, Open-Source Software
1. INTRODUCTION
Cerebrospinal fluid (CSF) is a clear, colorless body fluid that surrounds the brain and spinal cord. The fluid is made by a group of cells, called the choroid plexus, and distributed in two distinct spaces, within the brain ventricle spaces as well as the the subarachnoid space (between the pia mater and the arachnoid), which is a space external to the central nervous system. The latter part is called extra-axial cerebrospinal fluid (EA-CSF) and is the subject of our study.
The CSF plays an essential role in the development and the function of the brain as well as its protection both prenatally and throughout the lifespan. CSF circulation allows delivery of signaling molecules necessary for healthy neural growth, as well as the cleaning of the brain by removing neurotoxins and metabolic waste byproducts of neuronal function. Previous studies have indicated that the EA-CSF is a promising marker for the early detection of children at risk of neuro-developmental disorders such as autism spectrum disorders (ASD).1,2
A global quantification of EA-CSF is important in understanding the CSF pathology and its relation to ASD symptoms. However, a more localized analysis of the EA-CSF is needed for more accurate and anatomically more interpretable measurements . In this paper, we present a tool for such a localized quantification of EA-CSF from magnetic resonance images (MRI). We implemented a user-friendly graphical user interface (GUI) to enhance usability for neuroimaging community interested in brain development.
2. METHODS
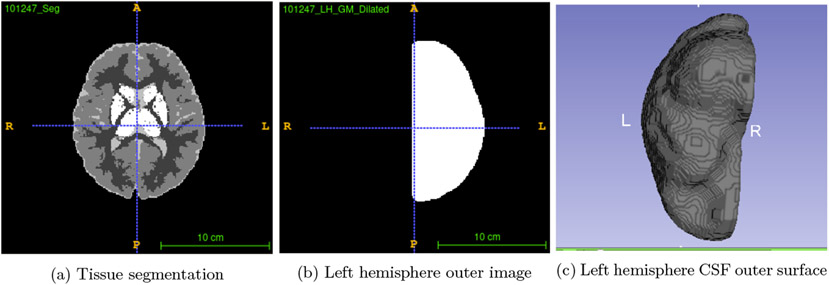
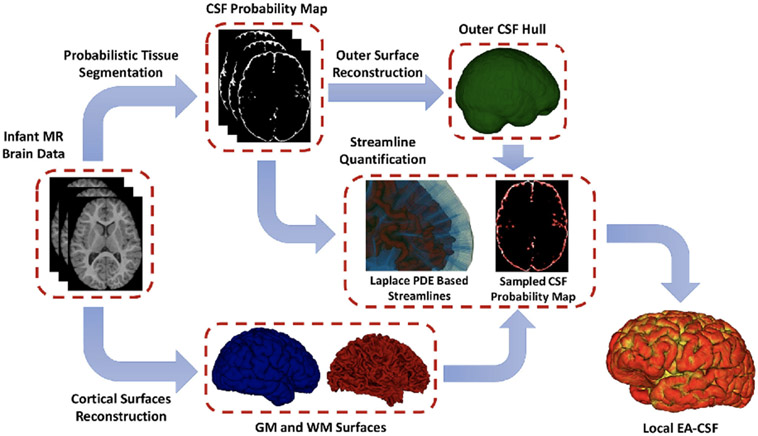
In our recent work, we proposed a novel approach to compute the local EA-CSF.3 Here, we further improved that approach and incorporated it into the proposed tool. We implement the necessary pre-processing steps for a fully automated approach to compute the local EA-CSF. First, a probabilistic tissue segmentation of white matter (WM), gray matter (GM) and cerebrospinal fluid (CSF) is computed from T1 and T2 weighted MRI data. Cortical surfaces in the middle of the white/gray and gray/pial boundary, as well as the outer CSF hulls are generated from the tissue segmentations Figure 1 shows an example of the outer CSF surface. The space between these surfaces is then employed as the solution space for a partial differential equation and streamlines are generated that connect both surfaces. Second, we implement additional constraints in the computation of streamlines. Finally, along each of the streamlines, the CSF space is sampled and the probability values are integrated to generate a local EA-CSF measure at each vertex of the cortical surface. We also include an additional option to compute group statistics of local EA-CSF values according to a cortical parcellation. Figure 2 shows this processing pipeline.
Figure 1.
Figure 2:
The proposed framework for the extraction of local EA-CSF from structural MRI.
2.1. Generation of streamlines
A Laplacian equation is solved to obtain the gradient field enclosed between the the cortical and outer hull surfaces and is defined as follows Δu = ∇2u(x) = 0. From this gradient field, we generate streamlines connecting the inner and outer surfaces. The streamlines are orthogonal to the gradients directions and generated via a fourth-order Range-Kutta forward integration of the gradients field. We introduce additional constraints in the computation of streamlines: Reduction of grid size dependency: The grid size of the gradient field is a parameter of the current approach. Grid size related instability of the EA-CSF computation is lessened by computing the measures over three nearby grid sizes and averaging of the measures if instability is observed; Elimination of double-counting: In the original approach, CSF measurements are sampled along streamlines without accounting for possibly counting CSF voxels multiple times. This leads to an over-quantification of the local EA-CSF. Here, we correct the integration of the CSF quantities along the streamline, by inversely weighting local CSF values with the sum of streamline path lengths passing through a CSF voxel. The EA-CSF at vertex v is thus computed as where TL is the total length of all streamlines passing through the voxel at P(k). This correction removes the over-quantification of the original approach.
2.2. Local EA-CSF estimation
A local measure of EA-CSF is computed for each vertex v by sampling the streamline lv starting at that vertex and integrating the probabilities of CSF along the streamline. The local CSF probabilities values are obtained from the posterior CSF probability of the tissue segmentation. Linear interpolation is used to compute the probabilities at each location of the streamlines and averaged between neighboring locations, so that the EA-CSF at vertex v is computed as follows: , where Δk represents the Euclidean distance between the point k and its successor k + 1 in the sample.
2.2.1. Smoothing:
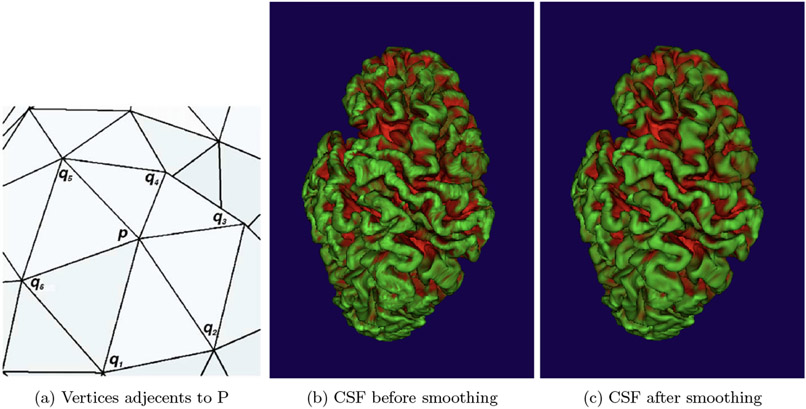
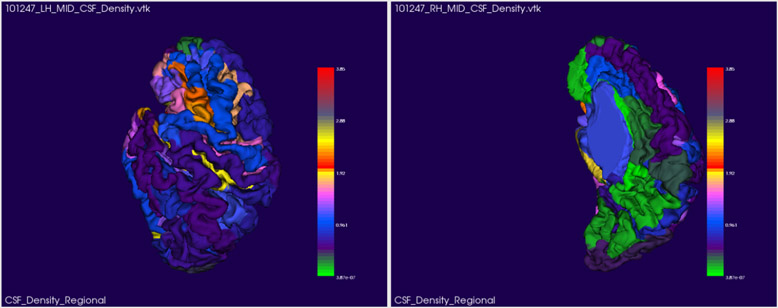
To smooth the computed CSF a heat kernel smoothing4 was applied. The method of this smoothing is the following: Let P be a vertex, to smooth the value of CSF at P: we consider the set Np {q0, q1, q2 …. qm} of vertices adjacent to it (Figure 8). For each element of Np the geodesic distance of P d(p,qi) is defined by 3D Euclidean distance ∥p − qi∥. Considering σ the bandwith, the weight of every vertex in Np is given by :
| (1) |
and the smoothed CSF density at the specific vertex P is:
| (2) |
This process is repeated N times until having the desired result. The bandwith σ and the number of iteration N are settled by default and are editable. Figure 3 shows the smoothing of the local CSF values.
Figure 3.
2.2.2. Minimize Local EA-CSF computation error
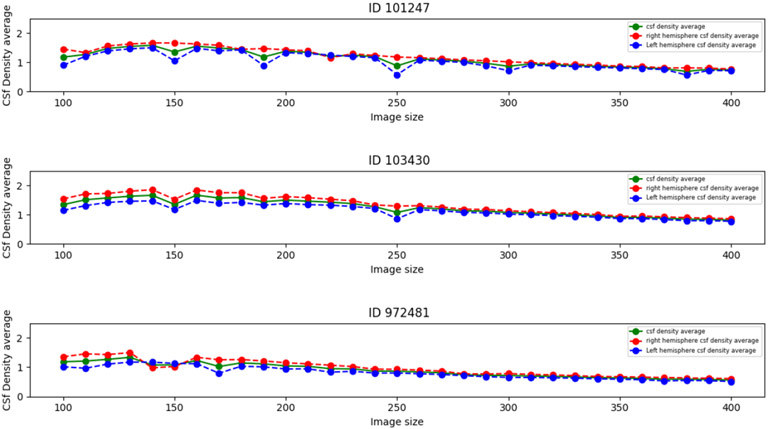
We minimize computation error by calculating the local EA-CSF across 3 different image sizes. As shown in Figure 4 as the image size increases, CSF density average stabilizes, i.e., at image size less than 250 the CSF density average calculation jitters. This is due to interpolation and discrete operations inherent to the method. For this reason, the final local EA-CSF values are averaged across 3 contiguous grid sizes.
Figure 4:
Local EA-CSF average image size
2.3. Regional EA-CSF measurements
Following the computation of the local EA-CSF measures, the tool further allows the collection of these measures into cortical regions defined by a prior cortical parcellation. In addition, the local EA-CSF maps are smoothed via a traditional heat-equation based smoothing operation.4
2.4. Quality Control
The quality control is performed a) quantitatively by comparing the overall CSF volume and the sum of all local EA-CSF measures, b) the hemispheric asymmetry of the overall CSF volume and the sum of all local EA-CSF measures, as well as c) visually by inspecting the EA-CSF maps on the cortical surfaces in a visualization tool like ShapePopulationViewer that allows the inspection of multiple surfaces at the same time (for reasons of efficiency). For (a) and (b), we expect the measures to be similar, and thus diverging measurements are flagged for further inspection. In the visual inspection, the rater looks for the presence of pattern that would indicate failure, such as non-biological line patterns or the local absence of CSF values.
3. RESULTS AND DISCUSSION
3.1. Comparison between the results of existing pipeline and the new tool :
To compare the results of the original pipeline and the new tool, both were executed for the same data (45 subjects). The new tool was executed without the improvements and with the same parameters as the original pipeline. Both provided a similar results with a difference between 0% to 10% ( Figure 12). This is due to an rounding error while computing the CSF Outer surface. This error is accumulated throughout the resolution of the differential equation making the final results different. That show us the sensitivity of Laplacian to a slight difference of the inputs.
3.2. Evolution of EA-CSF in terms of age:
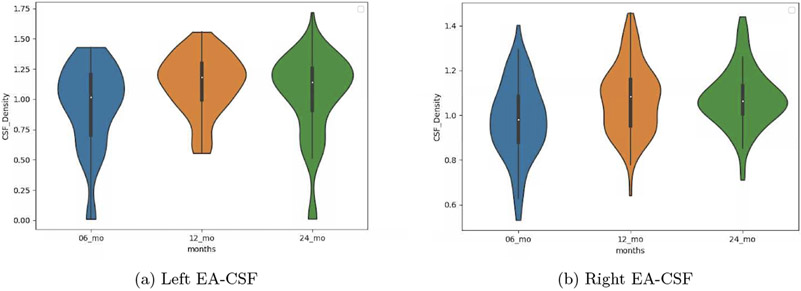
In order to see the evolution of EA-CSF in term of age the tool was applied for a 100 subjects at 6, 12 and 24 months, We expect to see a decrease of EA-CSF while increasing the age which was the case from 12 to 24 months but from 6 to 12 the EA-CSF increased that could be due to the difference of scan that we use for 12 and 6 months (Figure 13 ).
4. CONCLUSION :
Here, we presented the development of a publicly available interface-based tool for a local computation of extra-axial CSF. We also presented some improvements to the existing local computation process of EA-CSF by making it more precise. However, the density remains slightly different from the volume due to the lengths of the streamlines which can sometimes be larger or smaller than the size of the voxels and the computation time still considerable (at least 8 hours). future versions of the tool should take these two improvements into account.
Figure 5:
EA-CSF regional mean
Figure 6:
Difference between the results of the new tool and the original pipeline
Figure 7:
EA-CSF evolution in the time
5. ACKNOWLEDGEMENT :
Funding was provided by the IBIS (Infant Brain Imaging Study) Network, an NIH funded Autism Center of Excellence (HDO55741) that consists of a consortium of 7 Universities in the U.S. and Canada, and the NIH grants U54HDO79124, R01EB021391, P50 HD103573, and K12-HD001441.
REFERENCES
- [1].Shen MD, “Cerebrospinal fluid and the early brain development of autism,” Journal of neurodevelopmenta. disorders 10(1), 1–10 (2018). [DOI] [PMC free article] [PubMed] [Google Scholar]
- [2].LeMaout A, Yoon HB, Kim SH, Mostapha M, Shen MD, Prieto J, and Styner M, “Automatic measurement of extra-axial csf from infant mri data,” in [Medical Imaging 2020: Biomedical Applications in Molecular, Structural, and Functional Imaging], 11317, 113171I, International Society for Optics and Photonics; (2020). [DOI] [PMC free article] [PubMed] [Google Scholar]
- [3].Mostapha M, Kim SH, Evans AC, Dager SR, Estes AM, McKinstry RC, Botteron KN, Gerig G, Pizer SM, Schultz RT, et al. , “A novel method for high-dimensional anatomical mapping of extra-axial cerebrospinal fluid: Application to the infant brain,” Frontiers in Neuroscience 14 (2020). [DOI] [PMC free article] [PubMed] [Google Scholar]
- [4].Chung MK, Robbins SM, Dalton KM, Davidson RJ, Alexander AL, and Evans AC, “Cortical thickness analysis in autism with heat kernel smoothing,” NeuroImage 25(4), 1256–1265 (2005). [DOI] [PubMed] [Google Scholar]


