
Fig. 2.
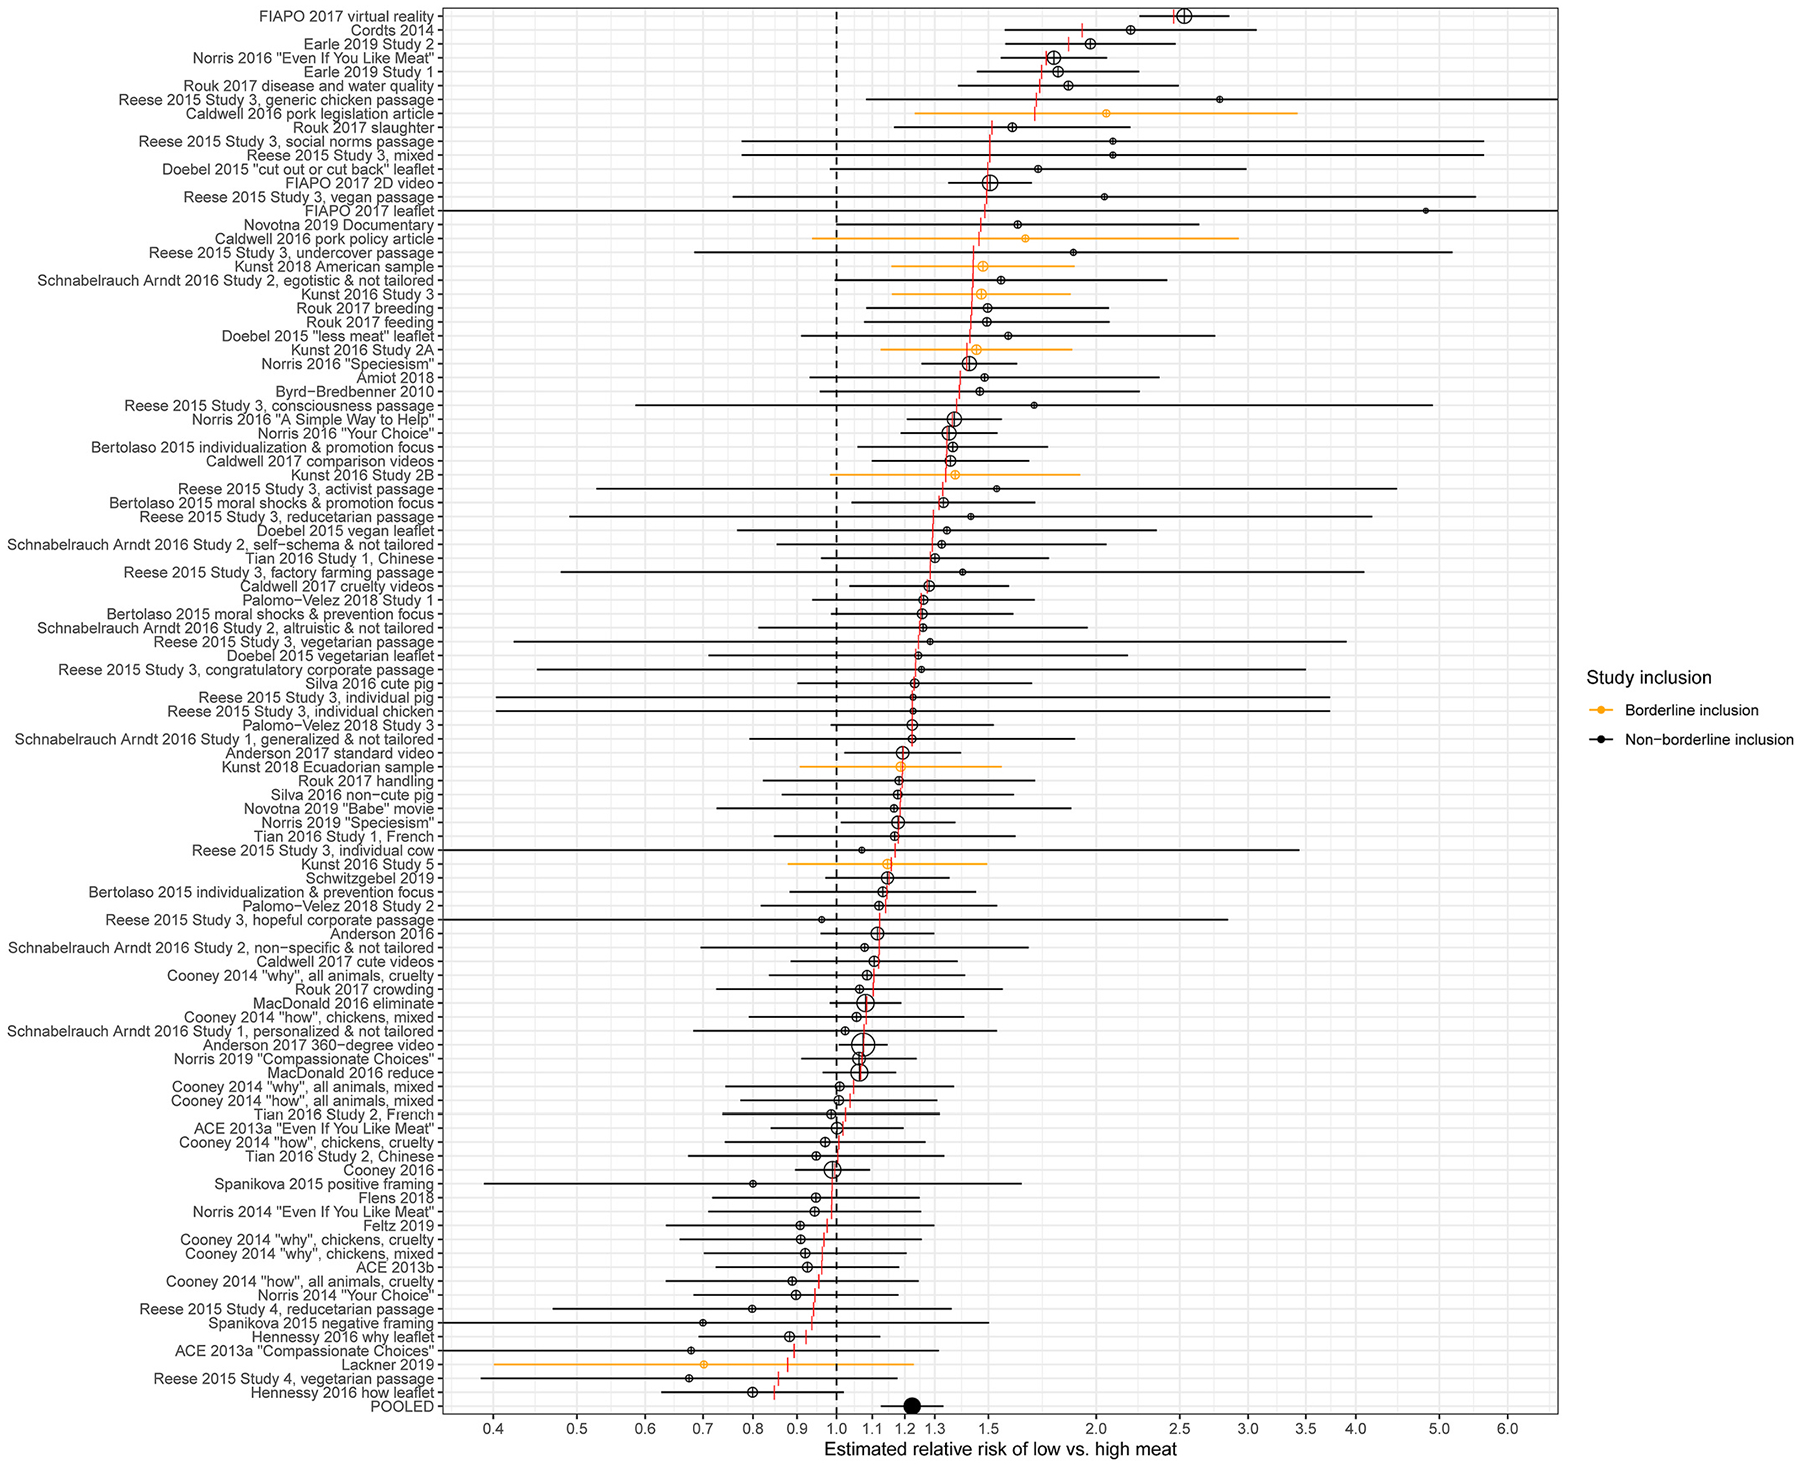
Point estimates in each study (open circles), ordered by the study’s calibrated estimate (vertical red tick marks), and the overall meta-analytic mean (solid circle). Areas of open circles are proportional to the estimate’s relative weight in the meta-analysis. Orange estimates were borderline with respect to inclusion criteria and were excluded in sensitivity analysis. The x-axis is presented on the log scale. Error bars represent 95% confidence intervals. The vertical, black dashed line represents the null (no intervention effect).