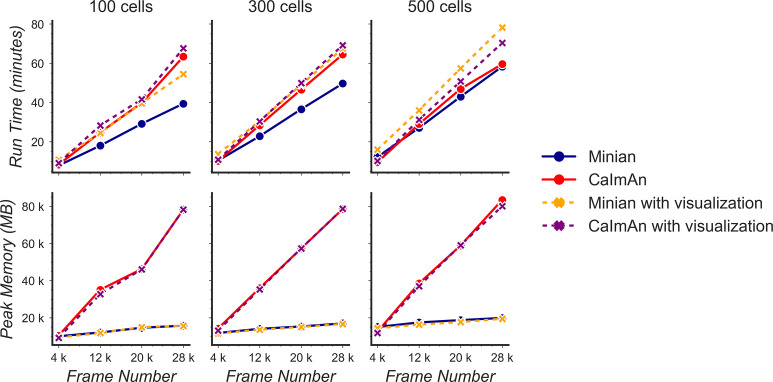
Figure 18. Benchmarking of computational performance.
Data with varying number of cells and frames were processed through Minian and CaImAn. The run time (top) and peak memory usage (bottom) were recorded and plotted as a function of frame number. For both pipelines, the run time scales linearly as a function of the number of frames and remains similar across the pipelines. However, the peak memory usage for CaImAn also scales linearly as the number of frames increases, while Minian maintains a relatively constant peak memory usage across different frame numbers and cell numbers.

