Abstract
Various methods of evaluating a humectant’s moisture retention have unique mechanisms. Hence, for designing advanced or efficient ingredients of cosmetic products, a clear understanding of differences among methods is required. The aim of this study was to analyze the moisture-retention capacity of glycerin, a common ingredient in cosmetic products. Specifically, this study applied gravimetric analysis, transepidermal water loss (TEWL) analysis, and differential scanning calorimetry (DSC) to examine the evaporation of glycerin solutions of different concentrations. The results revealed that the moisture-retention capacity of glycerin increased with the glycerin concentration from 0 to 60 wt%, and glycerin at concentration of 60–70 wt% did not exhibit weight change during the evaporation process. When the glycerin concentration exceeded 70 wt%, moisture sorption occurred in the glycerin solution. Furthermore, the results revealed a deviation between the evaporation rates measured using gravimetric analysis and those measured using TEWL analysis. However, normalizing the results of these analyses yielded the relative evaporation rates to water, which were consistent between these two analyses. DSC thermograms further confirmed the consistent results and identified two hydrated water microstructures (nonfreezable water and free water) in the glycerin solutions, which explained why the measured evaporation rate decreased with the glycerin concentration. These findings can be applied to prove the moisture-retention capacity of a humectant in cosmetic products by different measuring methods.
Subject terms: Chemistry, Engineering
Introduction
The moisture-retention capacity of ingredients is crucial in cosmetics1. An effective moisture-retaining agent in cosmetic products can be beneficial against skin aging2,3. A humectant is a hygroscopic substance that can maintain skin moisture and hydration3,4. Loss of skin hydration engenders skin dryness, wrinkling, sagging, and laxity. Accordingly, several studies have sought humectants that exhibit high efficacy in retaining moisture on the human stratum corneum5.
A humectant’s moisture-retention capacity can be measured through various methods such as gravimetric analysis, transepidermal water loss (TEWL) analysis, differential scanning calorimetry (DSC), thermogravimetric analysis, dilatometry, infrared spectroscopy, and nuclear magnetic resonance spectroscopy–based relaxation time analysis6–9. Among these methods, gravimetric analysis can be easily applied to measure the weight change of an analyte in a material through evaporation within a specific period; a low level of weight loss indicates high moisture retention. However, because of the detection limit of balance machines used for gravimetric analysis, considerable time is required for accumulating detectable weight changes in order to measure a solution’s evaporation rate, which is an indicator of the solution’s moisture-retention10. Therefore, in gravimetric analysis, obtaining accurate evaporation rates is a time-consuming process11.
In general, TEWL refers to the amount of water vapor that permeates a certain area of membrane per unit of time and can be measured using a probe. A TEWL probe is an open-chamber system that applies two pairs of temperature and moisture sensors on a cylinder to determine water loss (in grams per hour per square meter) through evaporation12. The measuring principle of a TEWL probe is based on Fick’s law of diffusion, which relates to the mass transfer rate of water per unit area within a specific period. Compared with water loss measurement methods that involve weighing an analyte, a TEWL probe can afford a more stable measurement of water loss in a few minutes13.
DSC is a powerful tool for exploring the microstructure and thermal behavior of a liquid sample14; it can also be applied for evaluating the moisture retention of a humectant15. According to the freezing temperature criterion, the microstructure of water in a humectant can be categorized into three types: nonfreezable water, intermediate water, and free water8,16–19, as shown in Fig. 1 for three hydrated water types. Nonfreezable water and intermediate water can easily bind to a humectant through hydrogen bonding and are thus called bound water. Intermediate water and free water can exhibit phase transitions and are thus called freezable water20. Nonfreezable water tightly binds to the hydrophilic sites of a humectant and has low mobility because of the strong water–humectant interactions. Specifically, nonfreezable water involves very weak free water–water interactions. Intermediate water is oriented around nonfreezable water and the humectant as a hydration shell, forming cage-like structures through which the maximum number of hydrogen bonds is achieved in the available space21. The molecular interactions of intermediate water involve both water–humectant and water–water interactions. Molecular interactions of free water mainly involve water–water interactions.
Figure 1.
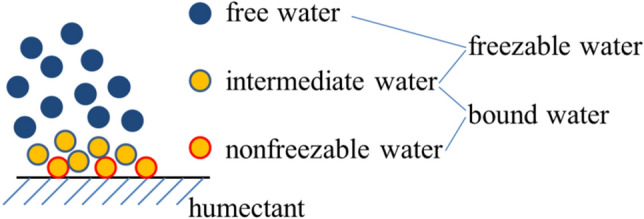
Three hydrated water types in a humectant.
Various methods of evaluating a humectant’s moisture retention have unique mechanisms. Hence, for designing advanced or efficient ingredients of cosmetic products, a clearer understanding of the differences among such methods is required. Accordingly, this study used glycerin—a common humectant—as a model to examine moisture retention; specifically, the study examined the moisture-retention capacity of glycerin solutions of different concentrations by using three convenient methods, namely; gravimetric analysis, TEWL assessment and DSC, for comparison.
Materials and methods
Glycerin (First Cosmetics Manufacture Co., Ltd., Taiwan) and deionized water were used in this study. Glycerin solutions of different concentrations (wt%) were prepared by diluting glycerin with various amounts of deionized water; these solutions were then subjected to evaporation experiments. Each evaporation experiment was conducted by placing 3 mL glycerin solution in a vial with an internal diameter of 9 mm. These experiments were conducted in a closed system at 30 °C and 70% relative humidity.
The weight change of the glycerin solutions during evaporation was automatically monitored using a precise five-digit electronic balance machine (AS 60/220.R2, Radwag Wagi Elektroniczne, Poland) for 35 h. Additionally, a well-known TEWL probe (Courage + Khazaka Electronic, Köln, Germany) was used to detect the evaporation rate of the glycerin solutions at the beginning of the evaporation process according to the international guidelines. A single measurement was collected every 2 s until the standard deviation was below 0.1 g/hr/m2.
DSC experiments were performed using a differential scanning calorimeter (Q10, TA Instruments, New Castle, USA) with a Thermo Model FC100AX0TA refrigerated cooling system and Thermal Advantage Universal Analysis software. A 5-mg sample was weighed and sealed in the aluminum pan of the calorimeter. The sample pan along with a reference pan was then placed in the DSC instrument, cooled from 40 to − 50 °C, and heated up again to 40 °C at a rate of 1 °C/min to avoid the response time lag caused by a faster heating rate. The temperature and enthalpy peak associated with the phase transition during the heating process were analyzed. The enthalpy in unit of J/g was calculated by integration of enthalpy peak and normalization of water weight in the glycerin solution6. The experiments were repeated at least three times to ensure the reproducibility of the DSC results.
Results and discussion
Gravimetric analysis
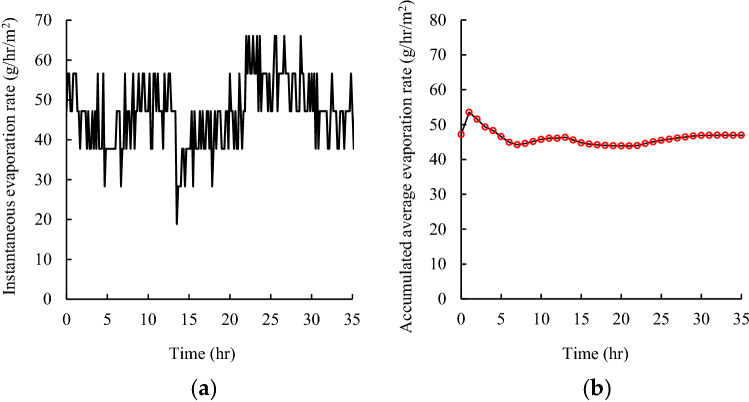
Figure 2a illustrates the fluctuation of the instantaneous evaporation rate of a water solution with time; the rate was measured using an electronic balance. The weight of the water solution was measured automatically every minute during the evaporation process to calculate the instantaneous evaporation rate. The instantaneous evaporation rate fluctuated considerably because of a limited change in the weight of the water solution during the evaporation process and detection limitation of the balance. Figure 2b displays the accumulative average evaporation rate defined as the overall evaporation rate from start to a certain time, presented in Fig. 2a. As indicated in this figure, the accumulative average evaporation rate also fluctuated considerably during the early phases of the evaporation process due to the small weight change; however, the fluctuation decreased gradually with evaporation time because of the relatively large accumulated weight change. A stable accumulative average evaporation rate may be obtained after more than 5 h. Therefore, the gravimetric analysis was determined to consume considerable time before yielding a stable evaporation rate.
Figure 2.
Gravimetric analysis of water evaporation rate with time: (a) instantaneous evaporation rate and (b) accumulative average evaporation rate.
Evaporation rates measured using gravimetric and TEWL analyses
The evaporation rate of a humectant can be an indicator of the moisture-retention capacity of the humectant. Figure 3 presents evaporation rates measured through gravimetric and TEWL analyses for glycerin solutions of different concentrations (wt%). The evaporation rate of 10 wt% glycerin measured through TEWL analysis was determined to be consistent with that revealed by an in vivo report on 20 healthy volunteers22. The results of the two analyses indicated that the evaporation rate decreased with the glycerin concentration, demonstrating that a concentrated glycerin solution has a high moisture-retention capacity. No obvious evaporation rate could be measured when the glycerin concentration was at 60–70 wt%. This phenomenon can be attributed to the equilibrium between glycerin evaporation and moisture sorption. A glycerin molecule has three hydroxyl groups and is hygroscopic. When the glycerin concentration exceeded 70 wt%, a considerable amount of moisture sorption occurred, resulting in an increase in the weight of the glycerin solution and a negative evaporation rate.
Figure 3.
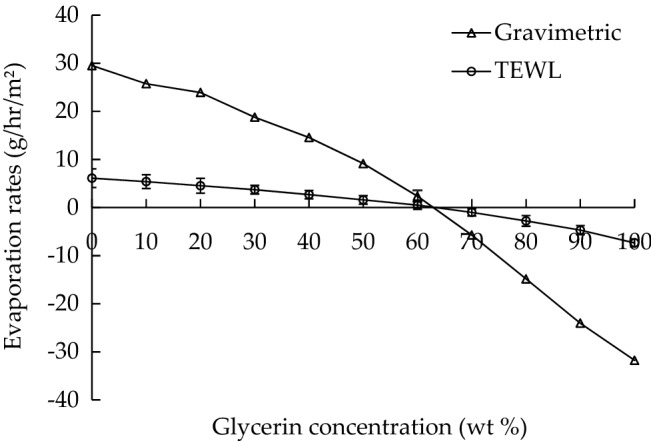
Evaporation rate of glycerin solutions of various concentrations measured by using gravimetric and TEWL analyses.
This study revealed a deviation between the evaporation rates measured using gravimetric analysis and those measured using TEWL analysis. The rates measured using gravimetric analysis were higher than those measured using TEWL analysis. This deviation can be attributed to the different mechanisms of these two analyses. In gravimetric analysis, the direct evaporation rate of a solution is measured in terms of weight loss (in grams per hour per square meter) during the evaporation process. By contrast, in TEWL analysis, evaporation rate is evaluated as the rate of water vapor diffusion through a TEWL probe, as determined through the calculation of vapor density gradient using Fick’s law of diffusion.
To ensure a fair comparison between the analyses, this study normalized their results. The relative evaporation rate to water (RERW) was defined as the ratio of the water evaporation rate of glycerin solution to the water evaporation rate of pure water. Figure 4 displays the RERW measured using gravimetric and TEWL analyses. The rates derived from the two analyses were consistent, verifying the accuracy of this evaporation experiment. According to the definition of RERW, moisture sorption started when the RERW was less than 0%, where no water loss occurred. Therefore, as revealed in Fig. 4, when the RERW was 0%, the glycerin concentration was approximately 60–70 wt%. Glycerin concentrations that were lower than 60 wt% were associated with positive and less than 100% RERWs, indicating that glycerin at this concentration can achieve moisture retention and reduced evaporation. However, when the glycerin concentration was higher than 70 wt%, the RERW became negative, demonstrating that glycerin at this concentration can gain water. This finding agrees with the reports of Fluhr et al.23 and Kiran et al.24 that glycerin is an excellent humectant and hygroscopic agent. Humectancy or hygroscopicity is the tendency of a substance to absorb moisture from the surrounding atmosphere. Pure glycerin absorbs its own weight in water over 3 days23.
Figure 4.
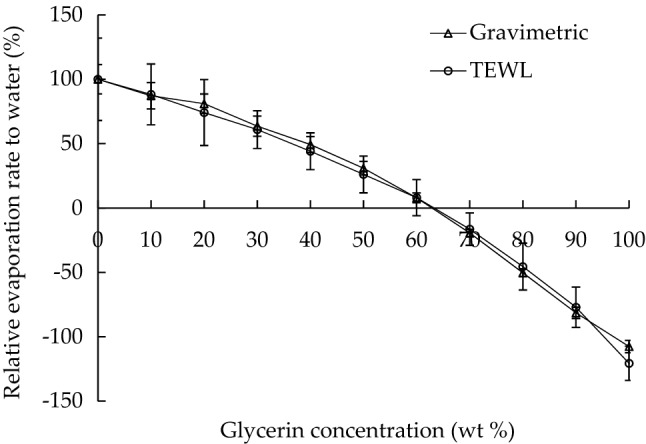
RERWs of glycerin solutions of various concentrations measured by using gravimetric and TEWL analyses.
DSC analysis
DSC analysis was conducted to investigate the microstructure of water in the glycerin solutions. Figure 5 displays DSC thermograms of the glycerin solutions of different concentrations. The melting curves varied considerably with the glycerin concentration, with an obvious peak appearing at a glycerin concentration of 0 wt% and no signal appearing after a glycerin concentration of 70 wt% indicating existence of nonfreezable water. These peaks were ascribed to the melting of frozen water including bulk water and free water18. Different types of frozen water have different transition temperatures and peak shapes. The transition temperature of intermediate water is lower than that of free water19. Nevertheless, no melting peak was observed for intermediate water in this study. This result corresponded to a previous study reporting that poly(2-methoxyethylacrylate) analogous polymers had just two hydrated water types, nonfreezable water and free water18.
Figure 5.
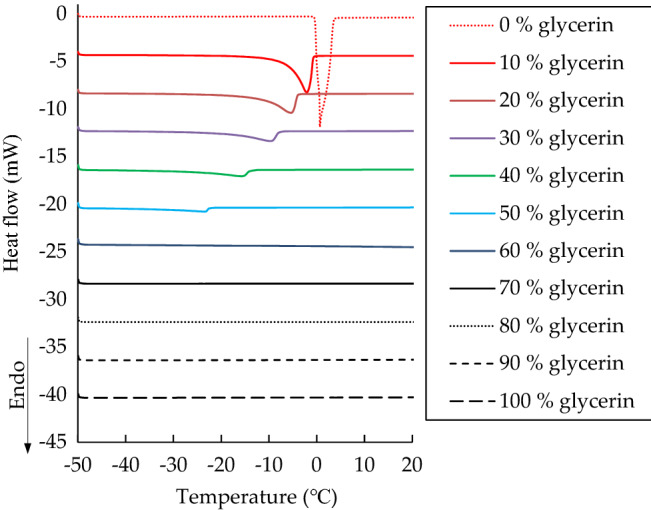
Heating curves of DSC thermograms at a 1 °C/min scanning rate for glycerin solutions of various concentrations.
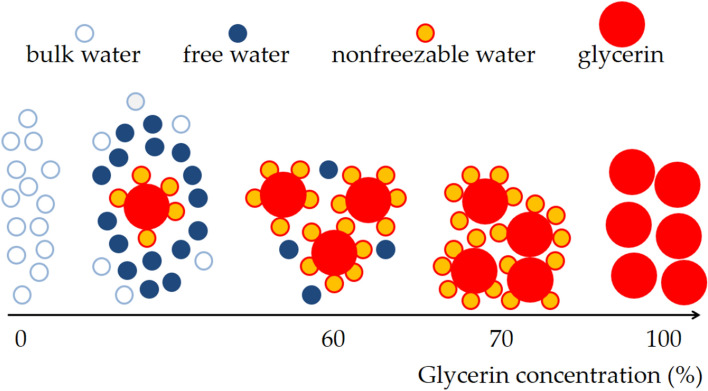
Table 1 presents a summary of the peaks observed for the glycerin solutions of different concentrations. The melting enthalpy observed for 0 wt% glycerin was noted to be consistent with the value obtained for pure water in a previous study25, indicating that the DSC method and conditions considered in the present study could be applicable to other study settings. The results also revealed that the peak temperature decreased with the glycerin concentration and that only 0 wt% glycerin was associated with a positive peak temperature. The positive melting peak indicates that the microstructure type of the water in 0 wt% glycerin was bulk water18. However, the melting peaks associated with 10–60 wt% glycerin were lower than 0 °C, signifying that the microstructure type of the water in the material also included free water except bulk water. When the glycerin concentration exceeded 70 wt%, no melting peak was observed, revealing that the microstructure of the water was nonfreezable water. Figure 6 illustrates the microstructure type of the water in the glycerin solutions at different concentrations.
Table 1.
DSC thermogram analysis of 0 to 100 wt% glycerin solutions.
| Glycerin concentration (wt%) | Peak temperature (°C) | Enthalpy (J/g) |
|---|---|---|
| 0 | 0.64 | 334.3 |
| 10 | − 2.28 | 213.8 |
| 20 | − 5.48 | 167.0 |
| 30 | − 9.80 | 112.1 |
| 40 | − 15.77 | 67.7 |
| 50 | − 23.50 | 50.8 |
| 60 | − 32.45 | 8.5 |
| 70 | – | – |
| 80 | – | – |
| 90 | – | – |
| 100 | – | – |
Figure 6.
A schematic diagram to illustrate the microstructure type of the water in the glycerin solutions with various concentrations.
The melting enthalpy peak decreased with the glycerin concentration, and no melting enthalpy was observed when the glycerin concentration exceeded 70 wt% (Table 1). This finding was consistent with the results of the evaporation experiments conducted using gravimetric analysis and the TEWL probe. The melting enthalpy resulted from frozen water (bulk water and free water), which can evaporate. The melting enthalpy increases with the amount of frozen water evaporating. This thus explains why the evaporation rate of the glycerin solutions decreased with the glycerin concentration. For concentrated glycerin solutions, the microstructure of the water tended to be nonfreezable water without evaporation.
To more clearly demonstrate the microstructures of water, the DSC thermograms for glycerin solutions with concentrations of < 10 wt% are displayed in Fig. 7 for comparison. The curves for 0.1, 1, and 5 wt% glycerin were between those for 0 and 10 wt% glycerin. The melting peaks associated with 0.1, 1, and 5 wt% glycerin shifted left from 0 wt% glycerin toward lower temperature regions; additionally, the melting temperatures ranged from both above and below 0 °C. This phenomenon signifies that free water was formed when glycerin molecules were added to the bulk water solution18. When the glycerin concentration reached 10 wt%, the melting peak was in the negative temperature region because of the large amount of free water. Furthermore, as revealed in Table 2, in addition to the peak temperature, the melting enthalpy decreased with the glycerin concentration.
Figure 7.
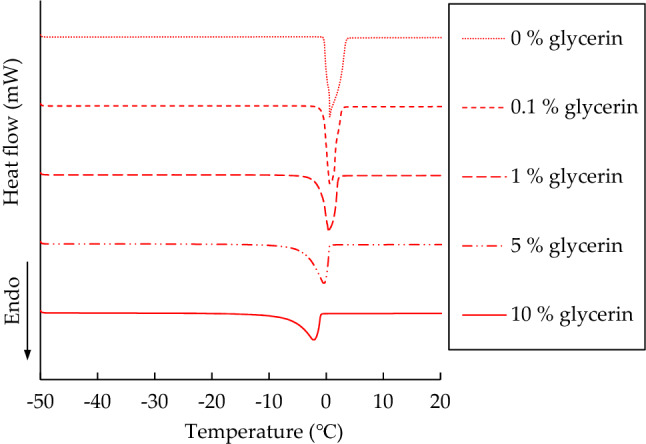
Heating curves of DSC thermograms at a 1 °C/min scanning rate for glycerin solutions with the concentrations of 0–10 wt%.
Table 2.
DSC thermogram analysis of glycerin solutions with low concentrations.
| Glycerin concentration (wt%) | Peak temperature (°C) | Enthalpy (J/g) |
|---|---|---|
| 0 | 0.64 | 334.3 |
| 0.1 | 0.48 | 295.3 |
| 1 | 0.42 | 269.4 |
| 5 | − 0.68 | 259.8 |
| 10 | − 2.28 | 213.8 |
Conclusions
This study compared three methods used to evaluate the moisture-retention capacity of glycerin solutions of different concentrations. The results indicate that the moisture-retention capacity of glycerin increases with the glycerin concentration. Although a deviation was observed between the results of gravimetric analysis and TEWL analysis, normalizing the results of these analyses revealed reasonably high consistency levels between them. In addition to confirming the consistency between the gravimetric and TEWL analyses results, this study generated DSC thermograms to further identify two hydrated water forms in the glycerin solutions, which explained the measured evaporation rates of the glycerin solutions. These findings can be applied to prove the moisture-retention capacity of a humectant in cosmetic products by different measuring methods.
Author contributions
C.Y. Chen and B.W. Huang did data curation. H.J. Chen, P.Y. Lee, S.L. Huang, F.J. Dai, C.F. Chau, C.S. Chen, and Y.S. Lin performed formal analysis and discussion. Y.S. Lin wrote the main manuscript text. All authors reviewed the manuscript.
Funding
This research was funded by the Ministry of Science and Technology, Grant Number 110-2622-E-239-003.
Data availability
All data generated or analysed during this study are included in this published article.
Competing interests
The authors declare no competing interests.
Footnotes
Publisher's note
Springer Nature remains neutral with regard to jurisdictional claims in published maps and institutional affiliations.
These authors contributed equally: H. J. Chen and P. Y. Lee.
References
- 1.Kim H, Kim JT, Barua S, Yoo SY, Hong SC, Lee KB, Lee J. Seeking better topical delivery technologies of moisturizing agents for enhanced skin moisturization. Expert Opin. Drug. Deliv. 2018;15:17–31. doi: 10.1080/17425247.2017.1306054. [DOI] [PubMed] [Google Scholar]
- 2.Choi SY, Hong JY, Ko EJ, Kim BJ, Hong SW, Lim MH, Yeon SH, Son RH. Protective effects of fermented honeybush (Cyclopia intermedia) extract (HU-018) against skin aging: a randomized, double-blinded, placebo-controlled study. J. Cosmet. Laser Ther. 2018;20:313–318. doi: 10.1080/14764172.2017.1418512. [DOI] [PubMed] [Google Scholar]
- 3.Wang H, Zhang Q, Mao G, Conroy O, Pyatski Y, Fevola MJ, Cula GO, Maitra P, Mendelsohn R, Flach CR. Novel confocal Raman microscopy method to investigate hydration mechanisms in human skin. Skin Res. Technol. 2019;25:653–661. doi: 10.1111/srt.12698. [DOI] [PubMed] [Google Scholar]
- 4.Spada F, Barnes TM, Greive KA. Skin hydration is significantly increased by a cream formulated to mimic the skin’s own natural moisturizing systems. Clin. Cosmet. Investig. Dermatol. 2018;11:491–497. doi: 10.2147/CCID.S177697. [DOI] [PMC free article] [PubMed] [Google Scholar]
- 5.Chen K, Guo B, Luo J. Quaternized carboxymethyl chitosan/organic montmorillonite nanocomposite as a novel cosmetic ingredient against skin aging. Carbohydr. Polym. 2017;173:100–106. doi: 10.1016/j.carbpol.2017.05.088. [DOI] [PubMed] [Google Scholar]
- 6.Li W, Xue F, Cheng R. States of water in partially swollen poly(vinyl alcohol) hydrogels. Polymer. 2005;46:12026–12031. doi: 10.1016/j.polymer.2005.09.016. [DOI] [Google Scholar]
- 7.Kataoka Y, Kitadai N, Hisatomi O, Nakashima S. Nature of hydrogen bonding of water molecules in aqueous solutions of glycerol by attenuated total reflection (ATR) infrared spectroscopy. Appl. Spectrosc. 2011;65:436–441. doi: 10.1366/10-06183. [DOI] [PubMed] [Google Scholar]
- 8.Bag MA, Valenzuela LM. Impact of the hydration states of polymers on their hemocompatibility for medical applications: a review. Int. J. Mol. Sci. 2017;18:1422. doi: 10.3390/ijms18081422. [DOI] [PMC free article] [PubMed] [Google Scholar]
- 9.Jiménez-Pérez ZE, Singh P, Kim YJ, Mathiyalagan R, Kim DH, Lee MH, Yang DC. Applications of Panax ginseng leaves-mediated gold nanoparticles in cosmetics relation to antioxidant, moisture retention, and whitening effect on B16BL6 cells. J. Ginseng Res. 2018;42:327–333. doi: 10.1016/j.jgr.2017.04.003. [DOI] [PMC free article] [PubMed] [Google Scholar]
- 10.Lin YS, Chen CY. A novel evaporation detection system using an impedance sensing chip. Analyst. 2014;139:5781–5784. doi: 10.1039/C4AN01107D. [DOI] [PubMed] [Google Scholar]
- 11.Chou WL, Lee PY, Chen CY, Lin YH, Lin YS. A high performance impedance-based platform for evaporation rate detection. J. Vis. Exp. 2016;116:e54575. doi: 10.3791/54575. [DOI] [PMC free article] [PubMed] [Google Scholar]
- 12.Cristiano MC, Froiio F, Mancuso A, Iannone M, Fresta M, Fiorito S, Celia C, Paolino D. In vitro and in vivo trans-epidermal water loss evaluation following topical drug delivery systems application for pharmaceutical analysis. J. Pharm. Biomed. Anal. 2020;186:113295. doi: 10.1016/j.jpba.2020.113295. [DOI] [PubMed] [Google Scholar]
- 13.De Paepe K, Houben E, Adam R, Wiesemann F, Rogiers V. Validation of the VapoMeter, a closed unventilated chamber system to assess transepidermal water loss vs. the open chamber Tewameter®. Skin. Res. Technol. 2005;11:61–69. doi: 10.1111/j.1600-0846.2005.00101.x. [DOI] [PubMed] [Google Scholar]
- 14.Sambale A, Kurkowski M, Stommel M. Determination of moisture gradients in polyamide 6 using StepScan DSC. Thermochim. Acta. 2019;672:150–156. doi: 10.1016/j.tca.2018.12.011. [DOI] [Google Scholar]
- 15.Lin CP, Tsai SY. Differences in the moisture capacity and thermal stability of Tremella fuciformis polysaccharides obtained by various drying processes. Molecules. 2019;24:2856. doi: 10.3390/molecules24152856. [DOI] [PMC free article] [PubMed] [Google Scholar]
- 16.Utoh S. Nonfreezing water confined in water layer of multilamellar L-α, distearoyl phosphatidylcholine in temperature range between 0 °C and −190 °C. J. Chem. Phys. 2001;115:601–607. doi: 10.1063/1.1371952. [DOI] [Google Scholar]
- 17.Tranoudis I, Efron N. Water properties of soft contact lens materials. Cont. Lens Anterior Eye. 2004;27:193–208. doi: 10.1016/j.clae.2004.08.003. [DOI] [PubMed] [Google Scholar]
- 18.Tanaka M, Mochizuki A. Effect of water structure on blood compatibility-thermal analysis of water in poly(meth)acrylate. J. Biomed. Mater. Res. A. 2004;68:684–695. doi: 10.1002/jbm.a.20088. [DOI] [PubMed] [Google Scholar]
- 19.Abasi S, Davis R, Podstawczyk DA, Guiseppi-Elie A. Distribution of water states within poly(HEMA-co-HPMA)-based hydrogels. Polymer. 2019;185:121978. doi: 10.1016/j.polymer.2019.121978. [DOI] [PubMed] [Google Scholar]
- 20.Tahmasebi A, Yu J, Su H, Han Y, Lucas J, Zheng H, Wall T. A differential scanning calorimetric (DSC) study on the characteristics and behavior of water in low-rank coals. Fuel. 2014;135:243–252. doi: 10.1016/j.fuel.2014.06.068. [DOI] [Google Scholar]
- 21.Qu X, Wirsén A, Albertsson AC. Novel pH-sensitive chitosan hydrogels: swelling behavior and states of water. Polymer. 2000;41:4589–4598. doi: 10.1016/S0032-3861(99)00685-0. [DOI] [Google Scholar]
- 22.Polaskova J, Pavlackova J, Egner P. Effect of vehicle on the performance of active moisturizing substances. Skin Res. Technol. 2015;21:403–412. doi: 10.1111/srt.12206. [DOI] [PubMed] [Google Scholar]
- 23.Fluhr JW, Bornkessel A, Berardesca E. Glycerol—Just a moisturizer? Biological and biophysical effects. In: Loden M, Maibach HI, editors. Dry skin and moisturizers: chemistry and function. 2. CRC Press; 2005. p. 227. [Google Scholar]
- 24.Kiran M, Mane A, Banerjee B, Mehta H, Yadav P. A comparative study to evaluate the efficacy of carboxy methyl cellulose with glycerin and balanced electrolytes as excipients vs plain carboxy methyl cellulose, for keeping the eye moist. J. Med. Sci. Clin. Res. 2017;5:18316–18322. doi: 10.18535/jmscr/v5i3.190. [DOI] [Google Scholar]
- 25.Faroongsarng D, Sukonrat P. Thermal behavior of water in the selected starch- and cellulose-based polymeric hydrogels. Int. J. Pharm. 2008;352:152–158. doi: 10.1016/j.ijpharm.2007.10.022. [DOI] [PubMed] [Google Scholar]
Associated Data
This section collects any data citations, data availability statements, or supplementary materials included in this article.
Data Availability Statement
All data generated or analysed during this study are included in this published article.


