

Abstract
Half of the critically ill patients with renal replacement therapy (RRT) dependent acute kidney injury (AKI) die within one year despite RRT. General intensive care prediction models perform inadequately in AKI. Predictive models for mortality would be an invaluable complementary tool to aid clinical decision making. We aimed to develop and validate new prediction models for intensive care unit (ICU) and hospital mortality customized for patients with RRT dependent AKI in a retrospective single-center study. The models were first developed in a cohort of 471 critically ill patients with continuous RRT (CRRT) and then validated in a cohort of 193 critically ill patients with intermittent hemodialysis (IHD) as the primary modality for RRT. Forty-two risk factors for mortality were examined at ICU admission and CRRT initiation, respectively, in the first univariate models followed by multivariable model development. Receiver operating characteristics curve analyses were conducted to estimate the area under the curve (AUC), to measure discriminative capacity of the models for mortality. AUCs of the respective models ranged between 0.76 and 0.83 in the CRRT model development cohort, thereby showing acceptable to excellent predictive power for the mortality events (ICU mortality and hospital mortality). The models showed acceptable external validity in a validation cohort of IHD patients. In the IHD validation cohort the AUCs of the MALEDICT RRT initiation model were 0.74 and 0.77 for ICU and hospital mortality, respectively. The MALEDICT model shows promise for mortality prediction in critically ill patients with RRT dependent AKI. After further validation, the model might serve as an additional clinical tool for estimating individual mortality risk at the time of RRT initiation.
Subject terms: Continuous renal replacement therapy, Haemodialysis
Introduction
One-year mortality in critically ill patients with acute kidney injury (AKI) requiring continuous renal replacement therapy (CRRT) exceeds 50% and has not improved in spite of developments in the field of intensive care during the last decade1,2.
Previous studies have indicated that scores used to assess severity of disease in intensive care patients, such as, Acute Physiology and Chronic Health Evaluation (APACHE)3–5, Simplified Acute Physiology Score (SAPS)6 and Sequential Organ Failure assessment score (SOFA)5,7 measured at the time of intensive care unit (ICU) admission or CRRT initiation, are associated with mortality in critically ill AKI patients but nevertheless perform inadequately in predicting mortality8,9.
Renal failure with a need for renal replacement therapy (RRT) substantially increase healthcare resource requirements and lead to increased costs and duration of hospital stay10,11. In spite of RRT half of the dialyzed ICU patients with AKI die within 1 year. More precise predictive models for mortality would be an invaluable complementary tool to aid clinical decision making in this highly morbid patient group and to recognize the patients that are likely to benefit from an increase in the intensity of care by RRT initiation. Previous available data have suggested that a combination of clinical evaluation and a predictive model risk estimate may improve the detection of patients with high or low survival probability compared to mere clinical judgment12.
Several observational studies have aimed to validate prediction models including conventional intensive care scoring systems or new models including machine learning based algorithms and the Mortality Scoring system for AKI with CRRT (MOSAIC) score13 for mortality in critically ill AKI patients requiring RRT. Most studies have examined risk factor effects assessed at a single time point during intensive care and the performance and external validation of the prediction models has been limited.
Therefore, we aimed to develop and validate respective predictive models for ICU and hospital mortality in critically ill patients with AKI requiring CRRT in a retrospective cohort, using data available on ICU admission and at CRRT initiation. Furthermore, the external validity of the models was examined in an independent cohort of critically ill AKI patients with intermittent hemodialysis (IHD) as the primary modality for RRT.
Materials and methods
This retrospective cohort study consecutively included all patients admitted to the ICU of the Turku University Hospital requiring continuous veno-venous hemodialysis (CVVHD) (493 participants) as a primary modality for RRT between January 1 2010 and December 31 2019. As the focus of this pre-specified report was to develop and validate respective predictive models for ICU and hospital mortality in critically ill patients with AKI requiring RRT, all patients on maintenance dialysis (22 patients) were excluded from the study. No power calculations were performed due to the retrospective setting of the study. After model development in CRRT patients, we studied the external validity of the developed models in critically ill AKI patients that were started on IHD (not CRRT) as a primary RRT modality during the same time period at our ICU (240 patients: 47 patients with previous maintenance dialysis dependency were excluded leaving 193 patients for the validation analyses).
All data on patient demographics, disease history and medications at baseline were manually collected from the electronic patient records of the research hospital. Biochemical data at ICU admission as well as cumulative data on RRT and ICU clinical parameters were extracted from the clinical information software of the research ICU. All patients were followed-up from the electronic patient records to collect outcome data on ICU and hospital mortality.
Immunosuppression was defined as ongoing use of immunosuppressive medication: corticosteroids (methylprednisolone dose (or equivalent dose) exceeding 10 mg/day), calcineurin inhibitors, mycophenolate mofetil, azathioprine, immunosuppressive monoclonal antibodies used for active autoimmune disorders or cytotoxic chemotherapy agents administered within 1 year.
CVVHD and IHD
CVVHD for all patients receiving CRRT was performed according to a standard protocol employed in our centre using Fresenius Multifiltrate CRRT monitors and 1.80 m2 polysulfone hemofilter Ultraflux AV1000 or Ultraflux EMiC2 membranes with the CiCa® dialysate K2 and 4% trisodium citrate to achieve regional citrate anticoagulation (Fresenius Medical Care, Bad Hamburg, Germany). Blood and dialysate flow rates were prescribed according to the weight of the patient and by the caring ICU physician to target a dialysis dose of 30 ml/kg/h. The methodology for CRRT remained unaltered for the entire study period and CVVHD was the modality for each patient in the study.
IHD was performed using Fresenius Cordiax 5008 dialysis monitors with 2.5–5 h treatment duration, blood flow rates 170–300 ml/min, dialysate flow rate of 500 ml/min, and low-molecular-weight heparin (LMWH) anticoagulation dependent on the clinical condition of the patient and the running number of IHD treatment.
In Finland CRRT is the primary modality in approximately 70% of all RRT initiations in ICUs as CRRT is considered the modality of choice for hemodynamically unstable patients with the highest severity of illness14.
Ethics
The study protocol was approved by the Turku University Clinical Research Center scientific review board (Turku CRC) and the Hospital district of Southwest Finland (Reference number: T143/2019). The patient identity numbers were removed and the hospital software data combined before the statistical analyses. For this retrospective, register-based, non-interventional study the Turku CRC and Hospital district of Southwest Finland joint review board waived the need for informed consent in terms of data collection and analysis and publication of results. All experiments were performed in accordance with relevant (STROBE) guidelines and regulations and all methods were carried out in accordance with relevant guidelines and regulations including the Helsinki declaration.
Statistics
Results are reported as mean ± standard deviation (SD) for normally distributed covariates and as median (inter-quartile range (IQR)) for skewed covariates unless stated otherwise. Categorical variables are presented with absolute and relative (percentage) frequencies. For the skewed variables, we examined different transformations (loge-transformation, square root transformation and square transformation) to normalize distributions, and the best transformation for each variable was chosen according to visual examination or tests for normality (Shapiro–Wilk, Kolmogorov–Smirnov). Student’s t-test was used to compare continuous normally distributed covariates and Chi-square test for categorical covariates in the study subgroups. For skewed variables without suitable transformations the comparisons between groups were done using a non-parametric Kruskall–Wallis test.
The univariate associations between the dependent variables and tested covariates were initially explored by entering the covariates separately into logistic regression models. A total of 42 different covariates were first examined using respective univariate models during model development. Risk factors included in the first univariate models are listed in Supplementary Table 1. All continuous variables included in the models were measured at both ICU admission and CRRT initiation. Covariates with univariate associations with the dependent variable at p ≤ 0.05 significance level were included in the multivariable logistic regression models. Multiple imputation with 25 imputations was performed for each response (ICU mortality and hospital mortality, respectively) and at both measurement time points (ICU admission and CRRT initiation, respectively) for those variables with p < 0.05 in the univariate models. Then, in each imputed data set, these variables were entered in a multivariable model with stepwise selection. Prior to using the stepwise selection procedure, we removed variables that described the same phenomena and caused multicollinearity. Multicollinearity was assessed by examining variance inflation factors at several stages of the analyses.
A variable was chosen in the final model if the selection procedure chose the variable to the models in over 50%, i.e. ≥ 13 imputations. The results of the final model were combined over the multiple imputed data sets. Hosmer–Lemeshow goodness-of-fit test was performed for the multivariable models to assess the goodness of fit of the models.
Receiver operating characteristics (ROC) curve analyses were conducted to estimate the area under the curve (AUC) as a measure of discriminative capacity of the multivariable models for different mortality events, respectively. The ROCCONTRAST function of SAS was employed to compare AUCs (discriminative capacity) between the generated final multivariable models and traditional intensive care scoring systems (APACHE, SAPS and SOFA) at ICU admission and CRRT initiation, respectively, for the mortality events. Generally, we consider an AUC > 0.90 outstanding, an AUC 0.80–0.90 excellent, an AUC 0.70–0.80 acceptable and an AUC < 0.70 poor discrimination.
Finally, the external validity of the models developed in the CRRT population was examined in an independent cohort of 193 critically ill AKI patients with IHD as the first modality for RRT. Using the same selected variables of the models developed in the CRRT cohort, respective risk assessment equations for the IHD cohort were developed for further validation. However, as the mortality was significantly lower in the IHD population compared to the CRRT population the coefficients in these IHD specific equations differed from the CRRT cohort equations. Furthermore, we also aimed to validate the use of the equations developed in the CRRT cohort directly in the IHD cohort, without altering the models.
All statistical analyses were performed using statistical analysis system, SAS version 9.3 (SAS Institute Inc., Cary NC). p < 0.05 was considered statistically significant and all tests were two-sided.
Results
The CRRT study population included 471 CRRT patients (138/29% women) with a mean age of 64.8 ± 13.1 years. ICU mortality was 34.2% and hospital mortality 42.3%. The characteristics of the CRRT study population and comparisons between hospital survivors and non-survivors are shown in Table 1. In the CRRT cohort 396 / 471 patients (84.1%) had data on baseline eGFR (within one year of admission). A total of 149 patients had prior CKD (eGFR < 60 ml/min/1.73 m2). CKD was not significantly associated with ICU (OR 1.251, 95% CI 0.839–1.867, p = 0.27) or hospital (OR 1.348, 95% CI 0.916–1.984, p = 0.13) mortality and therefore not included in the final models. The median time to dialysis initiation from ICU admission was 11 (3–31) h in the CRRT patients and, significantly longer, 19 (5–50) h in the IHD cohort (p = 0.001). At the time of RRT initiation 83 (18%) patients had hyperkalemia > 5.5 mmol/l, 173 (37%) patients Urea ≥ 20 mmol/l, 182 (39%) patients pH < 7.20 and 130 (28%) patients a cumulative fluid balance exceeding 5% of their body weight in the CRRT cohort. In the IHD cohort 38 (20%) patients had hyperkalemia > 5.5 mmol/l, 96 (50%) patients had Urea ≥ 20 mmol/l, 27 (14%) patients had pH < 7.20 and 32 (17%) patients had fluid overload.
Table 1.
Characteristics of the study patients.
| All | Hospital survivors | Non-survivors | P-value | |
|---|---|---|---|---|
| Number of subjects | 471 | 272 | 199 | – |
| Women [n, (%)] | 138 (29) | 79 (29) | 59 (30) | 0.89 |
| Age (years) | 66.4 (58.1–73.9) | 64.9 (55.4–71.6) | 68.6 (61.3–76.4) | 0.0003 |
| Surgical patients [n, (%)] | 175 (37) | 88 (32) | 87 (44) | 0.01 |
| Hypertension [n, (%)] | 304 (65) | 173 (64) | 131 (66) | 0.62 |
| Diabetes [n, (%)] | 189 (40) | 111 (41) | 78 (39) | 0.72 |
| Heart failure [n, (%)] | 113 (24) | 64 (24) | 49 (25) | 0.78 |
| Coronary artery disease [n, (%)] | 134 (28) | 63 (23) | 71 (36) | 0.003 |
| Cerebrovascular disease [n, (%)] | 47 (10) | 26 (10) | 21 (11) | 0.72 |
| Peripheral arterial disease [n, (%)] | 60 (13) | 29 (11) | 31 (16) | 0.11 |
| Solid malignancy [n, (%)] | 35 (7) | 17 (6) | 18 (9) | 0.25 |
| Pulmonary disease [n, (%)] | 69 (15) | 39 (14) | 30 (15) | 0.82 |
| Liver cirrhosis [n, (%)] | 15 (3) | 6 (2) | 9 (5) | 0.16 |
| Immunosuppression [n, (%)] | 61 (13) | 27 (10) | 34 (17) | 0.02 |
| Sepsis [n, (%)] | 245 (52) | 132 (49) | 113 (57) | 0.08 |
| Mechanical ventilation [n, (%)] | 348 (74) | 173 (64) | 175 (88) | < 0.0001 |
| Vasopressor use at ICU admission [n, (%)] | 386 (82) | 217 (80) | 169 (85) | 0.15 |
| SOFA score at ICU admission | 10 (7–12) | 10 (7–12) | 11 (7–13) | 0.004 |
| SOFA score at CRRT initiation | 12 (9–14) | 11 (9–13) | 13 (11–15) | < 0.0001 |
| APACHE score at ICU admission | 25 (21–30) | 24 (20–29) | 27 (22–32) | 0.0002 |
| APACHE score at CRRT initiation | 26 (21–31) | 25 (21–30) | 27 (23–32) | 0.0002 |
| SAPS score at ICU admission | 55 (45–66) | 52 (42–63) | 60 (50–71) | < 0.0001 |
| SAPS score at CRRT initiation | 56 (46–66) | 52 (43–63) | 61 (51–71) | < 0.0001 |
| Noradrenalin at ICU admission (µg/kg/min) | 0.08 (0.02–0.16) | 0.07 (0.02–0.15) | 0.10 (0.03–0.18) | 0.01 |
| Noradrenalin at CRRT initiation (µg/kg/min) | 0.13 (0.04–0.22) | 0.10 (0.02–0.17) | 0.17 (0.08–0.28) | < 0.0001 |
| Hourly diuresis at ICU admission (ml/h) | 14.6 (4.0–44.2) | 18.7 (6.2–45.7) | 8.5 (2.1–42.4) | < 0.0001 |
| Hourly diuresis at CRRT initiation (ml/h) | 10.2 (3.3–31.0) | 14.9 (5.8–38.7) | 5.8 (1.5–20.4) | < 0.0001 |
| Mean arterial pressure at ICU admission (mmHg) | 70 (60–82) | 71 (61–84) | 69 (59–81) | 0.08 |
| Mean arterial pressure at CRRT initiation (mmHg) | 71 (63–81) | 73 (64–84) | 69 (62–77) | 0.0006 |
| Hemoglobin at ICU admission (g/l) n = 452 | 104 (93–120) | 105 (95–121) | 104 (91–119) | 0.24 |
| Hemoglobin at CRRT initiation (g/l) n = 460 | 103 (91–120) | 104 (91–122) | 102 (92–118) | 0.37 |
| Thrombocytes at ICU admission (109/l) n = 452 | 134 (87–202) | 144 (95–205) | 122 (76–194) | 0.005 |
| Thrombocytes at CRRT initiation (109/l) n = 459 | 135 (80–212) | 160 (93–243) | 103 (66–178) | < 0.0001 |
| Bilirubin at ICU admission (µmol/l) n = 331 | 14 (8–32) | 12 (7–26) | 19 (9–43) | 0.0006 |
| Bilirubin at CRRT initiation (µmol/l) n = 357 | 14 (8–32) | 11 (7–23) | 20 (10–42) | < 0.0001 |
| Creatinine at ICU admission (µmol/l) n = 421 | 216 (143–339) | 243 (153–378) | 190 (137–291) | 0.02 |
| Creatinine at CRRT initiation (µmol/l) n = 456 | 295 (190–415) | 335 (217–490) | 248 (171–357) | < 0.0001 |
| Urea at ICU admission (mmol/l) n = 340 | 14.0 (8.5–23.1) | 13.7 (8.9–22.1) | 14.7 (8.3–23.5) | 0.91 |
| Urea at CRRT initiation (mmol/l) n = 371 | 19.0 (11.9–27.6) | 20.0 (12.6–27.8) | 17.6 (10.5–27.1) | 0.13 |
| Potassium at ICU admission (mmol/l) n = 464 | 4.4 (3.9–4.9) | 4.3 (3.9–4.9) | 4.4 (3.9–5.0) | 0.41 |
| Potassium at CRRT initiation (mmol/l) n = 392 | 4.2 (3.8–4.6) | 4.1 (3.7–4.5) | 4.3 (3.9–4.8) | 0.0004 |
| pH at ICU admission n = 465 | 7.27 (7.19–7.34) | 7.28 (7.20–7.35) | 7.26 (7.18–7.33) | 0.01 |
| pH at CRRT initiation n = 391 | 7.28 (7.19–7.36) | 7.31 (7.22–7.37) | 7.26 (7.12–7.34) | < 0.0001 |
| Bicarbonate at ICU admission (mmol/l) n = 464 | 17.2 ± 4.8 | 17.6 ± 4.8 | 16.7 ± 4.7 | 0.02 |
| Bicarbonate at CRRT initiation (mmol/l) n = 390 | 17.7 (14.4–20.8) | 19.0 (15.4–21.2) | 16.6 (12.9–19.4) | < 0.0001 |
| Lactate at ICU admission (mmol/l) n = 463 | 3.2 (1.7–7.1) | 2.4 (1.3–5.7) | 4.8 (2.2–9.3) | < 0.0001 |
| Lactate at CRRT initiation (mmol/l) n = 388 | 2.4 (1.2–7.3) | 1.7 (1.0–4.3) | 4.7 (2.0–9.2) | < 0.0001 |
Categorical values in parentheses are % unless stated otherwise. Continuous variables are expressed as mean (± SD) or median (IQR) for normally distributed and skewed covariates, respectively.
Hypertension was defined as a clinical diagnosis of hypertension and cerebrovascular disease as a diagnosis of ischemic or hemorrhagic stroke or transient ischemic attack observed in the patient records, respectively. Heart failure was defined as a clinical diagnosis of congestive heart failure observed in the patient records or ejection fraction < 50% or diastolic heart failure observed in echocardiography. Pulmonary disease was denoted as a prior diagnosis of asthma, chronic obstructive pulmonary disease or chronic interstitial lung disease. Coronary artery disease and peripheral arterial disease were defined as previously diagnosed conditions.
ICU intensive care unit, SOFA-score Sequential Organ Failure Assessment score, CRRT continuous renal replacement therapy, APACHE Acute Physiology and Chronic Health Evaluation II score, SAPS Simplified Acute Physiology II score.
Significant values are in bold.
In the CRRT population a total of 191 patients were dialysis dependent at the time of death (n = 168) or hospital discharge (n = 23). During the study period a total of 17,316 patients were admitted to the research ICU leading to an observed incidence of RRT of 3.8%.
The final best ICU admission and RRT initiation (later MALEDICT) multivariable models for ICU and hospital mortality, respectively, are shown in Table 2. The AUCs of the respective models ranged between 0.76 and 0.83, thereby showing acceptable to excellent predictive power for the mortality events (ICU mortality and hospital mortality). The AUCs were somewhat higher for RRT initiation models for predicting both ICU and hospital mortality, respectively, compared to ICU admission models. All the final multivariable models showed significantly higher predictive power compared to SOFA, APACHE-II and SAPS-II scores (p < 0.0001 for all comparisons) (Fig. 1). The performance of SOFA, APACHE-II and SAPS-II scores measured at both ICU admission and CRRT initiation and MOSAIC score measured at CRRT initiation was poor for mortality risk prediction with AUCs for discrimination of patients deceased in the ICU or during hospital care, respectively, ranging between 0.57 and 0.68. The comparisons between the predictive power of the new developed risk estimate models versus APACHE-II, SAPS-II, SOFA and MOSAIC scores in the complete case CRRT population are shown in Table 3.
Table 2.
Final multivariable models for ICU mortality and hospital mortality developed in the CRRT patient cohort.
| ICU mortality | Hospital mortality | ||
|---|---|---|---|
| ICU admission model | The MALEDICT RRT initiation model | ICU admission model | The MALEDICT RRT initiation model |
| AUC | |||
| 0.79 (range 0.78–0.79) | 0.83 (range 0.81–0.84) | 0.76 (range 0.75–0.77) | 0.79 (range 0.78–0.80) |
| Sensitivity | |||
| 0.51 | 0.61 | 0.57 | 0.63 |
| Specificity | |||
| 0.87 | 0.88 | 0.78 | 0.80 |
| Negative predictive value | |||
| 0.77 | 0.81 | 0.71 | 0.75 |
| Positive predictive value | |||
| 0.67 | 0.72 | 0.65 | 0.70 |
| Hosmer–Lemeshow | |||
| GOF 2.98, p = 0.92 | GOF 9.70, p = 0.35 | GOF 5.18, p = 0.73 | GOF 6.42, p = 0.61 |
| Brier score | |||
| 0.171 | 0.155 | 0.197 | 0.182 |
| Adjusted R square | |||
| 0.31 | 0.39 | 0.26 | 0.33 |
| Misclassification rate | |||
| 0.25 | 0.22 | 0.31 | 0.27 |
| Variables in model | |||
| Surgical patient | Age | Age | Age |
| Coronary artery disease | Coronary artery disease | Coronary artery disease | Coronary artery disease |
| Immunosuppression | Immunosuppression | Immunosuppression | Immunosuppression |
| Mechanical ventilation | Mechanical ventilation | Mechanical ventilation | Mechanical ventilation |
| Hourly diuresis at admission* | Hourly diuresis at CRRT start* | Hourly diuresis at admission* | Hourly diuresis at CRRT start* |
| Thrombocytes at admission* | Thrombocytes at CRRT start* | Bilirubin at admission* | Thrombocytes at CRRT start* |
| Lactate at admission* | Lactate at CRRT start* | Lactate at admission* | Lactate at CRRT start* |
| Equations for risk assessment | |||
| Logit (ICU mortality risk) = − 1.324 + 0.603(Surgical patient) + 0.986(Immunosuppression) + 0.790 (Coronary artery disease) + 1.461(Mechanical ventilation)–0.348[loge (Hourly diuresis)] − 0.435[loge (Thrombocytes)] + 0.778[loge (Lactate)] | Logit (ICU mortality risk) = − 1.473 + 1.565 (Mechanical ventilation) + 0.025 (Age) + 0.976 [loge (Lactate)] − 0.375 [loge (Hourly diuresis)] + 0.864 (Immunosuppression) + 0.683 (Coronary artery disease) − 0.639 [loge (Thrombocytes)] | Logit (Hospital mortality risk) = − 4.350 + 0.027(Age) + 0.737 (Immunosuppression) + 0.503 (Coronary artery disease) + 1.442(Mechanical ventilation) − 0.265[loge(Hourly diuresis)] + 0.289[loge (Bilirubin)] + 0.495[loge (Lactate)] | Logit (Hospital mortality risk) = − 1.000 + 1.287 (Mechanical ventilation) + 0.031 (Age) + 0.711 [loge (Lactate)] − 0.336 [loge (Hourly diuresis)] + 0.678 (Immunosuppression) + 0.550 (Coronary artery disease) − 0.585 [loge (Thrombocytes)] |
ICU intensive care unit, CRRT continuous renal replacement therapy.
*loge-transformed.
Figure 1.

Receiver operating characteristics (ROC) curves for the final multivariable models for ICU and hospital mortality in the CRRT model development cohort. (A) ICU admission model for ICU mortality; (B) the MALEDICT RRT initiation model for ICU mortality; (C) ICU admission model for hospital mortality and (D) the MALEDICT RRT initiation model for hospital mortality.
Table 3.
Comparisons between the predictive power of the new developed risk estimate models versus APACHE-II, SAPS-II, SOFA and MOSAIC scores in the complete case CRRT population.
| ICU mortality | Hospital mortality | ||||||
|---|---|---|---|---|---|---|---|
| Prediction model | AUC | Contrast estimate (95% CL) | P-value | Prediction model | AUC | Contrast estimate (95% CL) | P-value |
| CRRT patients n = 462 | |||||||
| ICU admission model | 0.79 | ICU admission model | 0.76 | ||||
| SOFA admission | 0.57 | − 0.22 (− 0.29 to − 0.16) | < 0.0001 | SOFA admission | 0.57 | − 0.18 (− 0.25 to − 0.12) | < 0.0001 |
| APACHE-II admission | 0.62 | − 0.17 (− 0.23 to − 0.11) | < 0.0001 | APACHE-II admission | 0.60 | − 0.15 (− 0.22 to − 0.09) | < 0.0001 |
| SAPS-II admission | 0.65 | − 0.14 (− 0.20 to − 0.09) | < 0.0001 | SAPS-II admission | 0.65 | − 0.11 (− 0.16 to − 0.06) | < 0.0001 |
| CRRT patients n = 408 | |||||||
| The MALEDICT RRT initiation model | 0.82 | The MALEDICT RRT initiation model | 0.78 | ||||
| SOFA RRT initiation | 0.69 | − 0.13 (− 0.19 to − 0.06) | 0.0001 | SOFA RRT initiation | 0.67 | − 0.11 (− 0.17 to − 0.05) | 0.0003 |
| APACHE-II RRT initiation | 0.68 | − 0.14 (− 0.19 to − 0.08) | < 0.0001 | APACHE-II RRT initiation | 0.68 | − 0.10 (− 0.16 to − 0.05) | 0.0004 |
| SAPS-II RRT initiation | 0.63 | − 0.19 (− 0.26 to − 0.12) | < 0.0001 | SAPS-II RRT initiation | 0.61 | − 0.17 (− 0.24 to − 0.10) | < 0.0001 |
| MOSAIC RRT initiation | 0.69 | − 0.13 (− 0.19 to − 0.07) | < 0.0001 | MOSAIC RRT initiation | 0.63 | − 0.15 (− 0.21 to − 0.09) | < 0.0001 |
| IHD patients n = 193 | |||||||
| The best IHD ICU Admission model | 0.82 | 0.81 | |||||
| The best IHD initiation model | 0.80 | 0.81 | |||||
| The CRRT ICU Admission model | 0.78 | 0.80 | |||||
| The MALEDICT RRT initiation model | 0.74 | 0.77 | |||||
Values for the ICU admission and RRT initiation models and comparisons between prediction models are mean values for 25 multiple imputations.
CL confidence limit, ICU intensive care unit, SOFA-score Sequential Organ Failure Assessment score, APACHE Acute Physiology and Chronic Health Evaluation II score, SAPS Simplified Acute Physiology II score, CRRT continuous renal replacement therapy, RRT renal replacement therapy.
Significant values are in bold.
There was only minor variability in the covariates included in the final best multivariable models. The ICU admission model for ICU mortality included the categorical variable for surgical patient group instead of age compared to the RRT initiation model. The ICU admission model for hospital mortality included bilirubin instead of thrombocytes compared to the respective RRT initiation model. When using the best variables at ICU admission for prediction of hospital mortality risk (Table 2) to predict ICU mortality (instead of hospital mortality) the risk prediction equation for ICU mortality was: Logit (ICU mortality risk) = − 4.796 + 0.021 (Age) + 0.924 (Immunosuppression) + 0.623 (Coronary artery disease) + 1.770 (Mechanical ventilation) − 0.315 [loge (Hourly diuresis)] + 0.256 [loge (Bilirubin)] + 0.694 [loge (Lactate)]. The discriminative performance of this substitute model was similar to the best model shown in Table 2 [AUC 0.79 (0.78–0.80), p = 0.75].
When using the best variables at ICU admission for prediction of ICU mortality risk to predict hospital mortality (instead of ICU mortality) the risk prediction equation for ICU mortality was: Logit (hospital mortality risk) = − 0.082 + 0.394 (Surgical patient) + 0.773 (Immunosuppression) + 0.715 (Coronary artery disease) + 1.194 (Mechanical ventilation) − 0.291 [loge (Hourly diuresis)] − 0.346 [loge (Thrombocytes)] + 0.522 [loge (Lactate)]. The discriminative performance of this substitute model was similar to the best model shown in Table 2 [AUC 0.75 (0.74–0.75), p = 0.29].
The RRT initiation models for predicting ICU and hospital mortality, however, were identical and included the need for Mechanical ventilation (yes/no), Age (years), LactatE (loge-transformed), hourly Diuresis (loge-transformed), Immunosuppression (yes/no), Coronary artery disease (yes/no) and Thrombocytes (loge-transformed) at RRT initiation as covariates (the MALEDICT model). The discrimination of the MALEDICT RRT initiation model for ICU mortality was excellent with a mean AUC in 25 consecutive imputations (range) of 0.83 (0.81–0.84). The model was well calibrated (Hosmer–Lemeshow goodness of fit 8.00, p = 0.35) and the Brier score was 0.15 (range 0.15–0.16). The model yielded a risk prediction equation for ICU mortality: Logit (ICU mortality risk) = − 1.473 + 1.565 (Mechanical ventilation) + 0.025 (Age) + 0.976 [loge (Lactate)] − 0.375 [loge (Hourly diuresis)] + 0.864 (Immunosuppression) + 0.683 (Coronary artery disease) − 0.639 [loge (Thrombocytes)] (Table 2).
The discrimination of the MALEDICT model for hospital mortality was acceptable with a mean AUC in 25 consecutive imputations (range) of 0.79 (0.78–0.80). The model was well calibrated (Hosmer–Lemeshow goodness of fit 8.00, p = 0.61) and the Brier score was 0.18 (range 0.18–0.19). The MALEDICT model yielded a risk prediction equation for hospital mortality: Logit (Hospital mortality risk) = − 1.000 + 1.287 (Mechanical ventilation) + 0.031 (Age) + 0.711 [loge (Lactate)] − 0.336 [loge (Hourly diuresis)] + 0.678 (Immunosuppression) + 0.550 (Coronary artery disease) − 0.585 [loge (Thrombocytes)]. Figure 2 shows the calibration of the MALEDICT model for ICU and hospital mortality.
Figure 2.

Calibration of the MALEDICT model for ICU and hospital mortality in the CRRT cohort. Average predicted probabilities of death and observed mortality according to decile of predicted probability of death.
The characteristics of the IHD patient validation cohort are shown in Supplemental Table 2. Patients with IHD as the primary modality had significantly lower ICU and hospital mortality, severity of illness scores, lactate, bilirubin, vasopressor requirement and incidence of invasive mechanical ventilation and prevalence of coronary artery disease compared to the CRRT cohort whereas creatinine, thrombocytes and hourly diuresis were higher in IHD patients both at ICU admission and at the start of IHD. In spite of significant differences between the CRRT and the IHD cohorts, the predictive power of the models developed in CRRT patients and the best IHD models developed using the most significant variables in CRRT patients were, however, acceptable to excellent in both cohorts (Table 3).
The best IHD initiation model risk prediction equation for ICU mortality in IHD patients using the same variables as in the CRRT models was: Logit (ICU mortality risk) = − 0.33 + 0.75 (Mechanical ventilation) − 0.01 (Age) + 0.69 [loge (Lactate)] − 0.34 [loge (Hourly diuresis)] + 0.63 (Immunosuppression) + 0.27 (Coronary artery disease) − 0.57 [loge (Thrombocytes)]. Correspondingly, the best IHD initiation model risk prediction equation for hospital mortality in IHD patients was: Logit (Hospital mortality risk) = − 1.89 + 0.80 (Mechanical ventilation) + 0.04 (Age) + 0.38 [loge (Lactate)] − 0.08 [loge (Hourly diuresis)] + 0.678 (Immunosuppression) + 0.550 (Coronary artery disease) − 0.585 [loge (Thrombocytes)].
The AUCs of the best IHD ICU admission models (applying the same variables used in the CRRT models) were 0.82 (0.72–0.92) and 0.81 (0.72–0.91) and the AUCs of the best IHD initiation models were 0.80 (0.68–0.92) and 0.81 (0.71–0.91) for ICU and hospital mortality, respectively in the IHD validation cohort. The discrimination performances of the original CRRT ICU admission models in the IHD validation cohort were also acceptable and similar compared to the best IHD ICU admission model for ICU mortality [AUC 0.78 (0.66–0.90), p = 0.31] and hospital mortality [AUC 0.80 (0.70–0.89), p = 0.37]. The discrimination performance of the MALEDICT model in the IHD validation cohort was acceptable and similar compared to the best IHD initiation model for ICU mortality [AUC 0.74 (0.59–0.89, p = 0.24], and hospital mortality [AUC 0.77 (0.68–0.87), p = 0.20] (Fig. 3).
Figure 3.
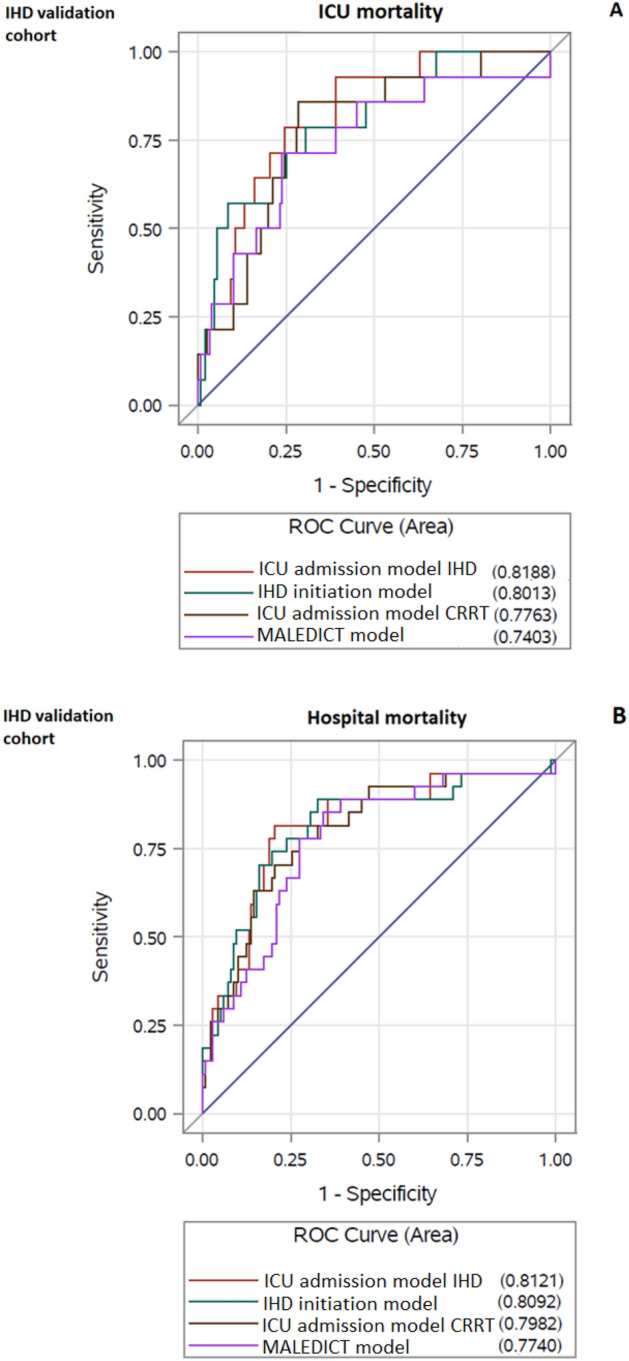
Receiver operating characteristics (ROC) curves for the final multivariable models for ICU and hospital mortality in the intermittent hemodialysis (IHD) validation cohort. (A) The best ICU admission and RRT initiation models for ICU mortality in IHD patients and the CRRT ICU admission and CRRT RRT initiation (MALEDICT) models in the IHD validation cohort; (B) the best ICU admission and RRT initiation models for hospital mortality in IHD patients and the CRRT ICU admission and CRRT RRT initiation (MALEDICT) models in the IHD validation cohort.
Discussion
Our current results implicate that the novel predictive models developed in the present study using multiple laboratory, clinical and demographic data at both ICU admission and CRRT initiation, exceed the predictive power of traditional intensive care prognostic scores such as APACHE, SAPS and SOFA even when these scores, are recorded at both ICU admission and CRRT initiation, respectively. The predictive power of our new models for ICU mortality had higher AUCs compared to that recently reported using a machine learning algorithm13. Furthermore, our models showed acceptable external validity when applied to the ICU patients started on IHD as the primary modality for RRT during the same time period between 2010 and 2019.
It has been conclusively shown, that traditional intensive care prognostic scoring systems such as APACHE, SAPS and SOFA are of insufficient accuracy for predicting mortality in patients with AKI, especially in patients requiring RRT15. In critically ill patients AKI even without the need for RRT indisputably increases mortality as well as treatment costs and the length of hospital stay in survivors10,11,16. Furthermore, even the ICU survivors with AKI show an increased risk for developing chronic kidney disease (CKD) leading to a continuous increased need for medical services and costs. The incidence of RRT dependent AKI and associated mortality has remained high and unaffected by advances in intensive care medicine during recent years potentially due to increasing age and comorbidity of the ICU patient population17. Therefore, it would be invaluable to be able to assess patients’ individual mortality risk more reliably to target treatment to those more likely to survive past ICU and hospital care and to avoid futile treatment efforts and individual unwarranted suffering related to continued high intensity care when prognosis is dismal. Some previous studies have suggested that combining physicians’ clinical estimates and a predictive model for mortality risk assessment may increase detection of patients with high or low survival probability compared to mere clinical judgment12.
During recent years some observational studies have assessed the validity and predictive power of prediction models for early mortality in critically ill AKI patients requiring CRRT including conventional intensive care scoring systems such as APACHE, SAPS and SOFA or new models including machine learning based algorithms13,15,18. Most studies have examined the significance of risk factors assessed at a single time point during intensive care and the performance and external validation of the prediction models has been limited. In a recent study Kim et al. developed a Mortality Scoring system for AKI with CRRT (MOSAIC) for one-week mortality in 828 critically ill patients undergoing CRRT. All model data was gathered at CRRT initiation and the model development was based on modifying the APACHE and SOFA scores and then combining seven of the variables with the highest predictive power to yield the MOSAIC score. The model was validated using an independent cohort of CRRT patients and yielded AUCs of 0.77 (0.74–0.81) and 0.77 (0.73–0.82) for the original and the validation cohort, respectively18. The MOSAIC score was also examined in a later study in addition to machine learning models and showed acceptable predictive power for ICU mortality although the AUC was somewhat lower 0.72 (0.68–0.77) compared to the original MOSAIC cohort. The machine learning models showed slightly higher AUCs ranging between 0.75 and 0.78 compared to the MOSAIC score13. In the present study cohort, the performance of the MOSAIC score was poor and comparable to SOFA, APACHE and SAPS scores. In another previous study da Hora Passos and coworkers developed the Hepatic failure, LactatE, NorepInephrine, medical Condition and Creatinine (HELENICC) score for 7-day mortality prediction in 186 septic AKI patients on CRRT, which, outperformed the general ICU scores with an AUC of 0.82 (0.76–0.88) but has not been validated in an independent cohort15. As opposed to these previous studies, we aimed to develop models for predicting hospital mortality in addition to short-term ICU mortality. Furthermore, we examined over forty different risk factors for mortality in the primary univariate models measured both at ICU admission and at CRRT initiation, and the final models included only significant multivariable predictors of mortality. Continuous variables were used in the models without classification. The AUC of the MALEDICT model for ICU mortality exceeded and the AUC for hospital mortality was similar to the AUCs of previously reported mortality prediction models for one-week mortality13,15,18.
Not surprisingly the models developed for clinical and laboratory parameters examined at CRRT initiation were more accurate in predicting incident mortality compared to models constructed using parameters measured on ICU admission. Models using data at the time of CRRT initiation are especially of clinical relevance in affected patients as they may aid the clinician in estimating whether or not the patient is likely to benefit from CRRT initiation. Surprisingly the AUC of the ICU admission model slightly exceeded the AUC of the MALEDICT model in the IHD validation cohort. The predictive power of the models for hospital mortality, showed acceptable predictive value although AUCs were inferior compared to models for ICU mortality. It is easy to comprehend that the models predicted ICU mortality more accurately than hospital mortality, as when the patient survives through ICU care and is discharged to the ward it is likely that long term medical conditions and overall health and fitness prior to ICU admission become more important for future prognosis compared to variables measured during intensive care. The models constructed in the current study therefore apply best for short to medium term mortality risk prediction in critically ill patients with RRT dependent AKI. All of the models had, significantly higher predictive value compared to the APACHE, SAPS and SOFA scores.
We aimed to validate the developed MALEDICT model in an independent patient cohort of critically AKI patients receiving IHD as the first RRT modality. Furthermore, we developed individual specific equations for mortality prediction in IHD patients using the same variables that were included in the CRRT models. The IHD patients differed markedly and significantly from the CRRT patients in terms of disease severity as well as ICU and hospital mortality. This selection of patients to different modalities of RRT in critical care is natural as CRRT is considered the modality of choice for hemodynamically unstable patients with the highest severity of illness. The number of patients in the IHD validation cohort was somewhat limited as CRRT is the primary modality in approximately 70% of all RRT initiations in ICUs in Finland14. Nevertheless, the predictive value of the models for mortality was acceptable to excellent in both the CRRT and the IHD cohorts.
The current study has all the limitations of an observational study. The retrospective single center study design may increase the possibility of residual confounders and limit the generalizability of the findings. However, the patients were extensively studied and we examined over forty variables in the primary univariate models for each mortality event, and time point respectively. The quality of data was good due to the electronic patients records used at our center and the missingness in the entire data set was low. Furthermore, we employed multiple imputation with 25 consecutive imputations for each model and the resulting models are based on a summary of all the imputations. Both internal and external validity of the models was assessed and found to be acceptable. As our models are however, based on retrospective data from a single center the new models need to be validated in a prospective study in other centers in the future.
Although the predictive value of the models was between acceptable and excellent according to AUCs of the models, it is worth to notice that even the in the MALEDICT model with the highest AUC of 0.83 for ICU mortality, the rate of misclassification was still considerable 22%. This emphasizes the additive role of the prediction models/equations and scores for clinical decision-making which should not be blindly based on mere prediction modelling as no model will exactly predict whether a single patient will decease or not.
In conclusion, the models developed in the present study, show promise for mortality prediction in critically ill patients with RRT dependent AKI. After further validation in another independent cohort the MALEDICT model might serve as an additional clinical tool for estimating individual mortality risk of affected patients at the time of CRRT initiation.
Supplementary Information
Author contributions
M.J.J., N.K., T.H. and P.U. designed the study and were responsible for the data collection. N.K. and M.J.J. performed the statistical analyses. M.J.J. drafted the manuscript. N.K., T.H. and P.U. revised the manuscript.
Competing interests
The authors declare no competing interests.
Footnotes
Publisher's note
Springer Nature remains neutral with regard to jurisdictional claims in published maps and institutional affiliations.
Supplementary Information
The online version contains supplementary material available at 10.1038/s41598-022-14497-z.
References
- 1.Vaara ST, Pettilä V, Reinikainen M, Kaukonen K-M, Finnish Intensive Care Consortium Population-based incidence, mortality and quality of life in critically ill patients treated with renal replacement therapy: A nationwide retrospective cohort study in Finnish intensive care units. Crit. Care. 2012;16(1):R13. doi: 10.1186/cc11158. [DOI] [PMC free article] [PubMed] [Google Scholar]
- 2.Bellomo R, et al. Intensity of continuous renal-replacement therapy in critically ill patients. N. Engl. J. Med. 2009;361(17):1627–1638. doi: 10.1056/NEJMoa0902413. [DOI] [PubMed] [Google Scholar]
- 3.Bagshaw SM, Laupland KB, Doig CJ, Mortis G, Fick GH, Mucenski M, Godinez-Luna T, Svenson LW, Rosenal T. Prognosis for long-term survival and renal recovery in critically ill patients with severe acute renal failure: A population-based study. Crit. Care. 2005;9(6):R700–R709. doi: 10.1186/cc3879. [DOI] [PMC free article] [PubMed] [Google Scholar]
- 4.Herrera-Gutiérrez ME, Seller-Pérez G, Lebrón-Gallardo M, Muñoz-Bono J, Banderas-Bravo E, Cordón-López A. Early hemodynamic improvement is a prognostic marker in patients treated with continuous CVVHDF for acute renal failure. ASAIO J. 2006;52(6):670–676. doi: 10.1097/01.mat.0000242162.35929.bc. [DOI] [PubMed] [Google Scholar]
- 5.Lin YF, Ko WJ, Chu TS, Chen YS, Wu VC, et al. The 90-day mortality and the subsequent renal recovery in critically ill surgical patients requiring acute renal replacement therapy. Am. J. Surg. 2009;198(3):325–332. doi: 10.1016/j.amjsurg.2008.10.021. [DOI] [PubMed] [Google Scholar]
- 6.Maccariello E, Valente C, Nogueira L, Bonomo H, Ismael M, Machado JE, Baldotto F, Godinho M, Valença R, Rocha E, Soares M. SAPS 3 scores at the start of renal replacement therapy predict mortality in critically ill patients with acute kidney injury. Kidney Int. 2010;77(1):51–56. doi: 10.1038/ki.2009.385. [DOI] [PubMed] [Google Scholar]
- 7.Kümpers P, Hafer C, Lukasz A, Lichtinghagen R, Brand K, Fliser D, Faulhaber-Walter R, Kielstein JT. Serum neutrophil gelatinase-associated lipocalin at inception of renal replacement therapy predicts survival in critically ill patients with acute kidney injury. Crit. Care. 2010;14(1):R9. doi: 10.1186/cc8861. [DOI] [PMC free article] [PubMed] [Google Scholar]
- 8.Uchino S, Bellomo R, Morimatsu H, Morgera S, Schetz M, Tan I, et al. External validation of severity scoring systems for acute renal failure using a multinational database. Crit. Care Med. 2005;33:1961–1967. doi: 10.1097/01.CCM.0000172279.66229.07. [DOI] [PubMed] [Google Scholar]
- 9.Douma CE, Redekop WK, van der Meulen JH, van Olden RW, Haeck J, Struijk DG, et al. Predicting mortality in intensive care patients with acute renal failure treated with dialysis. J. Am. Soc. Nephrol. 1997;8:111–117. doi: 10.1681/ASN.V81111. [DOI] [PubMed] [Google Scholar]
- 10.Dasta JF, Kane-Gill SL, Durtschi AJ, Pathak DS, Kellum JA. Costs and outcomes of acute kidney injury (AKI) following cardiac surgery. Nephrol. Dial. Transplant. 2008;23(6):1970–1974. doi: 10.1093/ndt/gfm908. [DOI] [PubMed] [Google Scholar]
- 11.Korkeila M, Ruokonen E, Takala J. Costs of care, long-term prognosis and quality of life in patients requiring renal replacement therapy during intensive care. Intens. Care Med. 2000;26(12):1824–1831. doi: 10.1007/s001340000726. [DOI] [PubMed] [Google Scholar]
- 12.Knaus WA, et al. The SUPPORT prognostic model. Objective estimates of survival for seriously ill hospitalized adults. Study to understand prognoses and preferences for outcomes and risks of treatments. Ann. Intern. Med. 1995;122(3):191–203. doi: 10.7326/0003-4819-122-3-199502010-00007. [DOI] [PubMed] [Google Scholar]
- 13.Kang MW, Kim J, Kim DK, Oh KH, Joo KW, Kim YS, Han SS. Machine learning algorithm to predict mortality in patients undergoing continuous renal replacement therapy. Crit. Care. 2020;24(1):42. doi: 10.1186/s13054-020-2752-7. [DOI] [PMC free article] [PubMed] [Google Scholar]
- 14.Vaara ST, Korhonen AM, Kaukonen KM, Nisula S, Inkinen O, et al. Fluid overload is associated with an increased risk for 90-day mortality in critically ill patients with renal replacement therapy: Data from the prospective FINNAKI study. Crit. Care. 2012;16(5):R197. doi: 10.1186/cc11682. [DOI] [PMC free article] [PubMed] [Google Scholar]
- 15.da Hora PR, Ramos JG, Mendonça EJ, Miranda EA, Dutra FR, Coelho MF, Pedroza AC, Correia LC, Batista PB, Macedo E, Dutra MM. A clinical score to predict mortality in septic acute kidney injury patients requiring continuous renal replacement therapy: The HELENICC score. BMC Anesthesiol. 2017;17(1):21. doi: 10.1186/s12871-017-0312-8. [DOI] [PMC free article] [PubMed] [Google Scholar]
- 16.Medve L, Antek C, Paloczi B, Kocsi S, Gartner B, Marjanek Z, Bencsik G, Kanizsai P, Gondos T. Epidemiology of acute kidney injury in Hungarian intensive care units: A multicenter, prospective, observational study. BMC Nephrol. 2011;12:43. doi: 10.1186/1471-2369-12-43. [DOI] [PMC free article] [PubMed] [Google Scholar]
- 17.Mehta RL, Pascual MT, Soroko S, Savage BR, Himmelfarb J, Ikizler TA, Paganini EP, Chertow GM. Spectrum of acute renal failure in the intensive care unit: The PICARD experience. Kidney Int. 2004;66(4):1613–1621. doi: 10.1111/j.1523-1755.2004.00927.x. [DOI] [PubMed] [Google Scholar]
- 18.Kim Y, Park N, Kim J, Kim DK, Chin HJ, Na KY, Joo KW, Kim YS, Kim S, Han SS. Development of a new mortality scoring system for acute kidney injury with continuous renal replacement therapy. Nephrology (Carlton) 2019;24(12):1233–1240. doi: 10.1111/nep.13661. [DOI] [PubMed] [Google Scholar]
Associated Data
This section collects any data citations, data availability statements, or supplementary materials included in this article.