

Abstract
Abnormal synchronous neuronal activity has been widely detected by brain imaging of autistic patients, but its underlying neural mechanism remains unclear. Compared with wild-type mice, our in vivo two-photon imaging showed that transgenic (Tg1) mice over-expressing human autism risk gene MeCP2 exhibited higher neuronal synchrony in the young but lower synchrony in the adult stage. Whole-cell recording of neuronal pairs in brain slices revealed that higher neuronal synchrony in young postnatal Tg1 mice was attributed mainly to more prevalent giant slow inward currents (SICs). Both in vivo and slice imaging further demonstrated more dynamic activity and higher synchrony in astrocytes from young Tg1 mice. Blocking astrocytic gap junctions markedly decreased the generation of SICs and overall cell synchrony in the Tg1 brain. Furthermore, the expression level of Cx43 protein and the coupling efficiency of astrocyte gap junctions remained unchanged in Tg1 mice. Thus, astrocytic gap junctions facilitate but do not act as a direct trigger for the abnormal neuronal synchrony in young Tg1 mice, revealing the potential role of the astrocyte network in the pathogenesis of MeCP2 duplication syndrome.
Supplementary Information
The online version contains supplementary material available at 10.1007/s12264-022-00824-x.
Keywords: Autism spectrum disorder, Astrocyte, Gap junction, Neuronal synchrony, MeCP2, Slow inward current, Neuronal development
Introduction
Autism Spectrum Disorder (ASD) affects 0.2%–2% of children worldwide [1–4]. Mounting evidence suggests that dysfunctional integrative mechanisms in ASD may result from aberrant neuronal synchrony [5, 6]. Structural brain imaging studies have indicated that the connectivity among some brain regions is compromised in ASD [7, 8], although the detailed abnormality remains to be clarified. Functional MRI and PET imaging studies have also shown that correlated activity among brain regions is higher in young [9–12] but lower in adolescent and adult ASD patients [13–19], as compared with healthy subjects. Calcium imaging of neuronal activity in several mouse models of ASD has revealed a higher correlation of activity among hippocampal neurons [20]. The synchrony of activity could be controlled by synapse-related factors such as the architecture of local neural circuits [21] and shared synaptic inputs [22, 23], and modulated by global brain states [22] as well as by background noise [24]. Thus, the abnormal neuronal synchrony could originate from diverse mechanisms, and the precise cause of the aberrant synchronization associated with ASD remains to be clarified.
Astrocytes, a major type of glial cell, are crucial regulators of neuronal functions [25–27]. They can be activated by the activity of adjacent neurons [28] and provide feedback signals to synchronize neuronal activity via releasing factors such as glutamate [29]. Previous immunocytochemical studies of autopsy samples from autistic patients have implicated astrocytes in the pathogenesis of ASD [30], a notion further supported by mouse model studies [31–35]. However, the precise role of astrocytes in the abnormal neuronal synchronization associated with ASD remains unclear. Transgenic mice overexpressing human Methyl-CpG binding protein 2 (MeCP2), a widely-used model of MeCP2 duplication syndrome, recapitulate many features of ASD [36, 37]. To investigate the underlying mechanism of defective neural synchronization in ASD, we applied in vivo two-photon Ca2+ imaging and multiple whole-cell patch-clamp recordings in cortical slices from mice across various developmental ages. We discovered that gap junction-dependent communication among astrocytes provides a mechanism to facilitate but does not function as a trigger to cause the hypersynchrony of neuronal activity through increasing synchronized SICs in the brain of young Tg1 mice.
Materials and Methods
Animals
Tg1 mice with MeCP2 duplication were obtained from Dr. Zilong Qiu [37] and maintained on the FVB background. Male Tg1 mice were crossed with female C57BL/6J (Shanghai SLAC Laboratory Animal Co., Ltd) wild-type (WT) mice to get experimental F1 mice. All data were acquired from male F1 littermate Tg1 and WT mice. Experimental protocols were approved by the Animal Care and Use Committee of the Center for Excellence in Brain Science and Intelligence Technology/ Institute of Neuroscience, Chinese Academy of Sciences. Mice were housed in a facility under a 12/12-h light/dark cycle with free access to water and food pellets.
Brain Slice Preparation and Electrophysiological Recording
Coronal slices with the somatosensory cortex (300 µm) from postnatal days 5–21 (P5–21) mice were cut on a Vibratome (VS-120, Leica) in oxygenated cutting artificial cerebrospinal fluid (ACSF) containing (in mmol/L): Choline chloride 120, KCl 2.6, NaHCO3 26, NaH2PO4 1.25, D-glucose 15, ascorbic acid 1.3, CaCl2 0.5, MgCl2 7 (~300 mOsm). After incubation in the cutting ACSF at 34°C for 30 min, slices were transferred to and then maintained in recording ACSF at room temperature (25°C) containing (in mmol/L): NaCl 126, KCl 3, NaHCO3 26, NaH2PO4 1.2, D-glucose 10, CaCl2 2.4, MgCl2 1.3 (pH 7.3–7.4, ~300mOsm) for at least 45 min before electrophysiological recording or Ca2+ imaging. All whole-cell patch-clamp recordings were made from pyramidal neurons under infrared differential interference contrast visualization at 32–34°C. To record spontaneous excitatory postsynaptic currents (sEPSCs) at –70 mV and spontaneous inhibitory postsynaptic currents (sIPSCs) at 0 mV from the same pyramidal neuron, the internal solution contained (in mmol/L): CsMeSO3 130, HEPES 10, EGTA 11, MgCl2 1, CaCl2 1, Mg-ATP 2, Na3-GTP 0.3, QX314-Cl2 (~290 mOsm, pH adjusted to 7.3–7.4 by CsOH) was used. To record chemical synaptic connections between neurons, currents were injected into one recorded neuron to trigger a series of action potentials under current-clamp mode while other neurons were under voltage-clamp mode to test their postsynaptic responses. The electrode solution contained (in mmol/L): potassium gluconate 126, KCl 2, MgCl2 2, HEPES 10, EGTA 0.2, Na2-ATP 4, Na3-GTP 0.4, creatine phosphate 10 (pH 7.4, ~290 mOsm). Electrode resistances used were ~3–6 MΩ. The series resistances were continuously monitored throughout the recording process. Whole-cell patch-clamp recordings were made with an amplifier (MultiClamp 700B, Molecular Devices) and recorded with a digitizer (DigiData 1440, Molecular Devices) and Axon Clampex 10.6 (Molecular Devices). Spontaneous EPSCs and IPSCs were analyzed with pCLAMP software (Molecular Devices). The frequency and amplitude of sEPSCs and sIPSCs were calculated by ~3 min of recording from the same neuron. The synaptic driving force as the charge was calculated as the product of the mean area of synaptic events and the event frequency in each neuron. The excitation/inhibition ratio was calculated as division of the mean excitatory charge by inhibitory charge.
Pharmacological tests were applied to verify the origin of slow inward currents (SICs) in pyramidal neurons. All drugs were initially dissolved at their maximum solubility, aliquoted into small portions in micro-centrifuge tubes, and then stocked at –80°C. Electrical recordings from pyramidal neurons with a high frequency of SICs were used for pharmacological tests. After 5 min of recording for sEPSCs and sIPSCs, drugs were added to the recording ACSF to their working concentrations. The NMDA receptor NR2B subtype antagonist Ro25–6981 (Sigma-Aldrich, Cat. No. R7150) was dissolved in dimethyl sulfoxide (DMSO) and its working concentration was 10 µmol/L. Gap 27 powder (APExBIO, Catalog No. A1045) was dissolved in anhydrous DMSO (Thermo Fisher Scientific, Cat. No. D12345) to 46 mmol/L as a stock solution, and its working concentration in vitro was 50 µmol/L.
To identify the effect of SICs on the correlation of activity between neurons, we made dual-patch recordings from pyramidal neurons that lasted for 5 min (30 sweeps, 10 s/sweep). To calculate the cross-correlation coefficient between neurons, we filtered the raw data in two ways to obtain the EPSC+SIC trace (Fig. 5D, green upper panel) and the SIC only trace. The raw sweeps were first baseline-corrected by subtracting the 8th percentile value for each time point within a 2-s window, then the median of all subtracted values was added to the corrected trace. For the EPSC+SIC trace, the corrected trace was low-pass filtered with a cut-off frequency of 400 Hz. We obtained the SIC only trace by filtering the corrected trace with a cut-off frequency of 10 Hz. For the EPSC only trace (Fig. 5D, blue lower panel), we first detected the onset and offset times of each SIC event using the SIC only trace, then SIC signals were subtracted from the EPSC+SIC trace to get obtain the EPSC only trace. To subtract SIC values from each ‘EPSC+SIC’ trace, we first smoothed the detected SIC time window in each EPSC+SIC trace in MatLab using the ‘rloess’ method with a time window of 0.07 s, which was much wider than usual EPSC events (0.01–0.02 s). The EPSC only trace was then created by subtracting the smoothed trace from the EPSC+SIC trace. The correlation coefficient of SICout in Fig. 5 was calculated from EPSC only traces; the correlation coefficient of post-gap 27 was calculated from filtered traces (EPSC+SIC) after the application of gap 27.
Fig. 5.
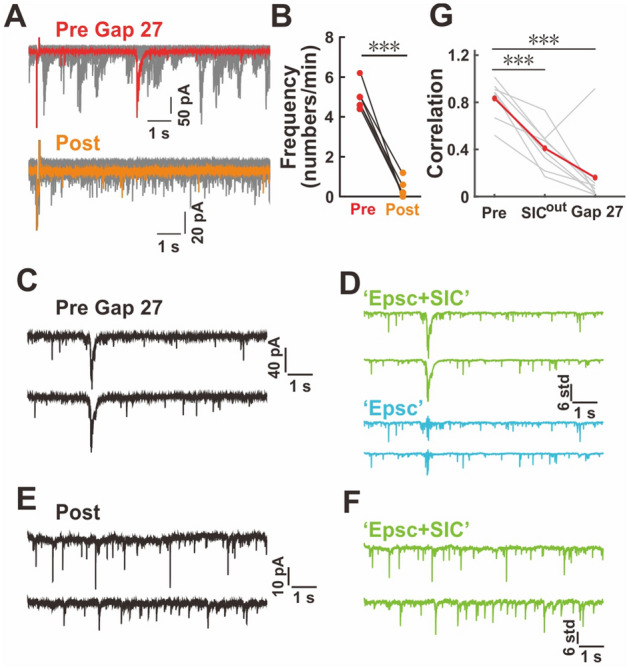
More prevalent SICs contribute to higher neuronal synchrony in young Tg1 mice. A Effect of gap 27 on the occurrence of SICs. B Summary of SIC frequency changes after gap 27 application (pre, red; post-application, orange; n = 6 neurons from 6 mice; paired t-test). C–G Impact of removing SICs (see Methods) on the synchrony of neuronal activity. Raw traces of a pair-recording sweep (C) contain one SIC from a Tg1 mouse at P-2W. The EPSC+SIC traces (D) (upper green) and the EPSC only traces (lower, blue) filtered from C. Raw trace of a pair-recording (E) from the same pair as in C after application of gap 27. The EPSC+SIC traces (F) are filtered from E. The correlation coefficient of neuronal signals (G) from pair-recorded neurons from Tg1 mice with or without SICs (n = 8 neuronal pairs from 8 Tg1 mice; paired t-test, FDR corrected).
Western Blot
Neocortex samples from Tg1 mice and their littermates in each age group was collected for western blot. The samples were first treated with lysis solution (Beyotime, P0013B) to obtain protein samples. Proteins were separated on 12% SDS-polyacrylamide gel, then blotted onto PVDF membrane (0.45 μm, Millipore). The primary antibodies used were rabbit anti-connexin43 (Cx43) (1:800, Abcam, ab11370) and mouse anti-GAPDH (1:10,000, Proteintech, 60004). The secondary antibodies used were HRP-conjugated goat anti-rabbit (1:10,000, Abcam, ab97051) and HRP-conjugated goat anti-mouse (1:10,000, Abcam, ab205179). The optical densities of bands were measured with ImageJ software (NIH). Protein levels were quantified as the ratio between the optical density for each Cx43 immunoreactive band and its corresponding GAPDH band. All ratios were then normalized against the expression level of the WT at P-2W.
Adeno-Associated Virus (AAV) Injection into Neonatal Mice
For in vitro astrocyte Ca2+ imaging, male P0 pups were anesthetized on ice and remained so throughout the injection process. A small opening on the scalp was made by a sharp needle, with the skull left intact. AAV2/8-gfaABC1D-Gcamp6s virus or AAV2/9-CamkII-Gcamp6s with a titer of × 1012 GC/mL was slowly injected onto the right somatosensory cortex (~300 nL/site, 2–3 sites for gfaABC1D-Gcamp6s virus and ~400 nL/site, 3–4 sites for CamkII-Gcamp6s virus). The injection system included an oil-based syringe pump (~50 nL/min, Stoelting, Cat. No. 53311) and a glass pipette pulled on a puller (P-97, Sutter Instrument) and further polished with a beveller (BV-10, Sutter Instrument). During the injection process, an ACSF-soaked sponge was used to keep the craniotomy moist. After injection, pups were allowed to recover on a heating blanket for ~1 h and then returned to the mother's cage.
Calcium Imaging of Astrocytes in Brain Slices
Slices from P10–14 mice injected with AAV2/8-gfaABC1D-Gcamp6s virus at P0 were transferred to the imaging chamber with oxygenated recording ACSF at 30–32°C. In vitro Ca2+ imaging for astrocytes was performed on a two-photon imaging stage (Ultima-IV, Prairie) with a 40× water immersion lens. Gcamp6s-positive astrocytes in layers 2/3 of barrel cortex were selected, typically ~40 µm below the slice surface, for time series imaging. The imaging fields were 2× digitally zoomed to visualize the detailed structure of astrocytic processes, corresponding to a scale of 0.287µm per pixel. Data were acquired at 1 frame per second for 5 min with an image size of 512 × 512, and image sessions with a detectable shift in the z-plane were abandoned. Acquired images were first aligned to the reference image using a previously published algorithm [38] to correct subtle shifts in the xy-plane, after which images were applied in ImageJ to create a mask of the astrocyte soma, which was saved as the region of interest (ROI) of the soma in each astrocyte. We further classified ROIs in astrocytes containing Ca2+ fluctuations into three types similar to the previous description [39, 40]: (1) soma; (2) broad domain (BD), in which signals occur in major branches displaying repeated wave-like Ca2+ dynamics; and (3) microdomain (MD), in which Ca2+ fluctuations are limited to restricted areas of astrocyte processes. We deleted the soma mask from image stacks using the clear selection feature in ImageJ to prepare for the detection of wave and microdomain ROIs using the GECIquant plugin of ImageJ. We used an area range of 5 to 1700 μm2 for detecting BDs and an area of 0.5 to 4 μm2 for MDs. Finally, we obtained the contour position information of the soma, BD, and MD ROIs in each astrocyte, which was next used to analyze the Ca2+ signal in each astrocyte.
In Vivo Calcium Imaging in Neurons and Astrocytes
For in vivo Ca2+ imaging of neurons and astrocytes simultaneously in young and adult mice at P10–14 (P-2W), P18–21 (P-3W), and 4 months (P-4M), Cal-520 AM (AAT Bioquest, Cat. No. 21130) was loaded by a bolus procedure. The reason we chose these three stages was that they were critical developmental stages for Tg1 mice. P-2W and P-3W are vital for the development of synapse formation [41], and P-4M is the time when Tg1 mice start to show behavior defects [36]. For surgery, mice were anesthetized with isoflurane and fixed on a stereotaxic frame (RWD, Cat. No. R510–22–16). The isoflurane concentration (0.5%–1.5%) was adjusted according to the respiratory status and body temperature was kept at 37 °C with a feedback-controlled heating pad. After the mouse was fully anesthetized, the scalp was removed and connective tissue on the skull were cleared. A craniotomy (~2.5 mm in diameter) was made over the right somatosensory cortex where the dura was left intact. Gel sponge soaked in filtered ACSF was used to cover the craniotomy. Cal-520 AM was dissolved in DMSO supplemented with 20% Pluronic F-127 (Tocris Bioscience, Cat. No. 6253), and then diluted in ACSF. To specifically label astrocytes, sulforhodamine 101 (SR101, Sigma-Aldrich, Cat. No. S7635) was added to the diluted Cal-520 AM solution. After ultrasonication (SK2200H, Kudos, Shanghai, China) and centrifugation with a 0.45 μm filter (Merck, Millipore, Cat. No. UFC30HV00), Cal-520 AM solution was ready for in vivo injection. The final concentration of gap 27 in the injected solution was ~1300 µmol/L, with DMSO at ~4.5%. Gap27 was applied together with Cal-520 AM. Cal-520 AM with the same concentration of DMSO was used as the control DMSO group. The Cal-520 AM working solution was transferred to the injection pipette by micropipette with a microloader (Eppendorf, Catalog No. 5242956003). The injection was carried out with a Picospritzer injection system (Parker Hannifn, Picospritzer III) and a pulled glass pipette (Sutter Instruments, Cat. No. BF 120–69–10). Three or four closely distributed injection sites over each craniotomy were used to label an area of ~1000 × 1000 μm2 in the xy-plane under the glass window. After injection, the craniotomy was covered with a glass coverslip (~4 mm diameter), and the edges of the coverslip were sealed with low-melting agarose (1%–1.5%) and further fixed with cyanoacrylate glue and dental cement. Afterward, the head plate was placed on top and also fixed with cyanoacrylate glue and dental cement. We applied Ca2+ imaging ~1 h after dye injection, and the acquisition was completed in 4 h. The body temperature was maintained with a heating pad set at 37°C throughout the surgery and imaging process. Cells labeled by Cal-520 AM and SR101 were excited by a 920-nm laser (chameleon vision-S, Coherent, Santa Clara, CA, USA) and imaged with a custom-built two-photon microscope (Bruker, Billerica, MA, USA) equipped with a 16× water immersion objective. During the whole imaging process, an infrared camera was used to monitor the activity of the imaged mice. All imaging fields were located at ~200 µm below the dura in layers 2/3, and each field was imaged in two continuous sessions (3000 frames/session, 512 × 512, 2.2× zoom, 30 Hz).
Calcium Imaging Data Analysis
Ca2+ imaging data were analyzed with MatLab (MathWorks). The raw frames were visually checked. The average from 20–40 consecutive frames of static images was used as a reference image. Acquired images were also first aligned according to the established algorithm [38] to minimize the shift in the xy-plane. Raw frames with large shifts were excluded from further analysis. The aligned frames were then averaged, and all the ROIs were manually drawn using a custom MatLab script. For each ROI, the averaged pixel values within the ROI mask were used as the fluorescence value at that frame time. The F0 of the raw fluorescence trace for each ROI was defined as the 8th percentile value of all data values according to the established method [42], and the ∆F/F0 trace was calculated as (Fraw – F0)/F0. The ∆F/F0 trace was used for all analyses. The correlation coefficient refers to Pearson’s correlation and was calculate using the “corrcoef” function in MatLab.
To detect events, the ∆F/F0 trace was first bandpass filtered with the Kaiser windowing algorithm in MatLab (frequency range 0.005–1 Hz). The criteria for defining a Ca2+ event were as follows: (1) peak amplitude >3×STD above baseline, and a the slope-to peak threshold of 0.2; (2) half peak width >1.5 s; and (3) onset slope significantly higher than the STD of all slope values. The event peak onset time was defined as the first time point at which the ∆F/F0 value was >baseline +1×STD, and the offset time was marked as the time point when the event ∆F/F0 value was last >baseline +1×STD. The detection threshold was selected after manual revision of ROIs from WT and Tg1 mice.
The population synchrony index was calculated by the following equation [43, 44]:
where N is the number of neurons within an imaging field, is the variance of the ∆F/F0 trace for ROI , and is the variance of the averaged trace across all ROIs within the same imaging field. To reduce other artifacts, only detected events were used for synchrony index calculation, and other non-event time points were replaced with values sampled from a Gaussian distribution , where and are the mean and standard deviation of baseline values. We use ∆F/F0 values within the 10th and 90th percentiles of the overall distribution to calculate the baseline mean and standard deviation.
Dye Coupling in Astrocytes
To verify the effect of gap 27 on astrocytic gap junctions, we did neurobiotin tracing in astrocytes from two littermates of Tg1 mice at P-2W. We injected SR101 into the cortex to specifically label astrocytes, and gap 27 (~1300 μmol/L) was simultaneously injected into one mouse with another mouse as control. About 2 h after in vivo injection, the mice were sacrificed to obtain acute brain slices. Slices from the gap 27-treated mouse were continually incubated in ACSF with gap 27 (40 μmol/L). Neurobiotin tracer (0.03%, Vector laboratories, SP-1120) and lectin conjugated with Dylight 488 (5 μg/mL) were added into K-gluconate pipette internal solution. Astrocytes labeled by SR101 in cortical layers 2/3 were targeted for patching. We selected cells with initial seal resistance >2 GΩ with a holding potential at –80 mV to reduce potential leakage. We only patched one astrocyte from each slice. The dye loading lasted for 12 min and only astrocytes without re-sealing were kept for follow-up steps, and slices without successful patching were discarded. After the dye loading process, the patch pipette was slowly removed from the astrocyte, and quickly taken from the slice. Brain slices were removed from the recording chamber and quickly rinsed in phosphate-buffered saline (PBS), and immediately fixed in 4% phosphate-buffered formaldehyde for 2 h at room temperature (RT) with gentle shaking. These slices were washed 3 times in PBS, and then blocked by PBS with 5% bovine serum albumin and 0.3% Triton X-100 at RT for 5 h with shaking. To visualize neurobiotin-coupled astrocytes, slices were treated with AF-647-conjugated streptavidin (1:1000, Yeasen, 35104ES60) at 4 °C overnight with gentle shaking. After washing twice in PBS, the slices were immersed in PBS with DAPI for 30 min at RT with shaking. After 3 more washes in PBS, the slices were ready for confocal imaging. The number of neurobiotin-positive cells were counted in ImageJ software (NIH).
Statistical Analysis
The threshold for all significant differences was set at 0.05 (*P <0.05, **P <0.01, ***P <0.001). To test statistical significance, we used paired or unpaired two-tailed Student’s t-tests, unpaired two-tailed Welch’s t-tests (for SIC frequency across different ages), the Wilcoxon rank-sum test, and Fisher’s exact test. The false discovery rate (FDR) was used to correct multiple comparisons. Boxplots show median values (middle vertical bar), 25th (lower line of box), and 75th percentiles (upper line of box), with whiskers indicating the range, and red crosses represent outliers.
Results
Age-Dependent Abnormal Neuronal Synchrony in the Tg1 Brain
To investigate the neural mechanism underlying the abnormal neuronal synchronization in ASD, we first examined the neuronal activity in the barrel cortex of awake WT mice (Fig. 1). The fluorescent Ca2+-sensitive dye Cal-520 AM [45, 46] was delivered into layers 2/3 of the somatosensory cortex across different developmental stages. The astrocyte-specific red dye sulforhodamine 101 (Fig. 1A) was used to distinguish astrocytes from neurons [47, 48], and changes of intracellular Ca2+ signals in neurons were monitored (Fig. 1C–E). We found an increase in the frequency of Ca2+ transients in neurons from the second (P-2W) to the third postnatal week (P-3W), but the frequency decreased back to a lower level by the fourth postnatal month (P-4M) (Fig. S1A). The peak amplitude of Ca2+ transients in neurons remained similar at all three developmental stages (Fig. S1B). Meanwhile, we also found that the proportion of active neurons was lower in adult brains than in young brains (Fig. S1C). The pair-wise correlation of Ca2+ signals for all recorded cells was further analyzed to assess the overall synchrony of cell activity. We found that neuronal synchrony among cortical neurons sharply declined from P-2W to P-3W (Fig. 1F, G) as previously reported [49], and we further demonstrated that it stabilized from P-3W to P-4M (P <0.001 for P-2W and P-3W, P = 0.02 for P-2W and P-4M, and P = 0.30 for P-3W and P-4M, Wilcoxon rank-sum test, FDR corrected; Fig. 1F, G). These results suggest that the mechanisms underlying neuronal synchrony at different developmental stages might be different.
Fig. 1.

Age-dependent abnormality of neuronal synchrony in the Tg1 brain. A Typical field view of in vivo two-photon imaging from layers 2/3 of somatosensory cortex, in which neurons stained by Cal-520 AM (green), and astrocytes are also labeled by sulforhodamine 101 (red) (scale bar, 50 μm). B Regions of interest for neurons and astrocytes drawn according to the visible cell bodies shown in A. C–E Representative ΔF/F0 Ca2+ signals of 5 closely distributed neurons from WT (black) and Tg1 mice (red) at different ages: P-2W (C), P-3W (D), and P-4M (E) (black dashed lines, Ca2+ transients synchronized among all cells; gray dashed lines, Ca2+ transients synchronized among 2–4 cells. F, H Cumulative distribution of all neuronal pairwise correlation coefficients from WT (F) and Tg1 (H) mice (gray area, range of half SEM; dashed line, correlation coefficient is zero). Inserted boxplots show the average pairwise correlation for each imaging field to test their statistical difference (red line, median; Wilcoxon rank-sum test, FDR corrected). G, I Mean correlation for all neuronal pairs versus their distance for each imaging field from WT (G) and Tg1 (I) mice across different ages (n = 8, 7, and 3 for WT and n = 9, 3, and 3 for Tg1 at P-2W, P-3W, and P-4M respectively). J Cumulative fraction of pairwise neuronal correlation within 100 µm from WT and Tg1 mice at three developmental stages. K Boxplots showing the distribution of average neuronal correlation within 100 µm from WT and Tg1 mice across different ages (Wilcoxon rank-sum test).
After we detected a desynchronization trend in neurons during development, we focused on the potential difference between WT and Tg1 mice. We found that in Tg1 neurons, the frequency of Ca2+ transients was slightly higher at P-2W (Fig. S1A). No significant differences in the amplitude of transients were found between Tg1 and WT mice (Fig. S1B) at all three stages. Meanwhile, we also found more active neurons at P-2W but fewer at P-4M in Tg1 mice comparing to WT mice (Fig. S1C). A higher event frequency and more active neurons indicated that neurons were more active in Tg1 at P-2W. Similar to WT mice, an age-dependent desynchrony of neuronal activity also occurred in Tg1 mice (P <0.001 for all three comparisons: P-2W and P-3W, P-2W and P-4M, and P-3W and P-4M, Wilcoxon rank-sum test, FDR corrected; Fig. 1H, I). Neuronal synchrony significantly decreased from P-2W to P-3W in both WT and Tg1 mice (Fig. 1F–I). There was no further reduction from P-3W to P-4M in WT mice (Fig. 1F, G). By contrast, neuronal synchrony in Tg1 mice further declined from P-3W to P-4M (Fig. 1H, I). The synchrony of activity in neuronal pairs within 100 μm in Tg1 mice was significantly higher than that in WT mice at P-2W (mean ± SEM, 0.558 ± 0.034 in Tg1 and 0.416 ± 0.043 in WT mice, P = 0.01, Wilcoxon rank-sum test; Fig. 1C, J, K). To avoid the potential influence of inhibitory neurons, we infected excitatory neurons with AAV carrying CamkII-GCamp6s as a Ca2+ indicator to assess activity synchronization among them, and found that the excitatory neuronal network also showed higher synchrony in Tg1 brains at P-2W (Fig. S2). The difference in neuronal synchrony between Tg1 and WT mice diminished at P-3W (0.105 ± 0.012 in Tg1 and 0.129 ± 0.012 in WT mice, P = 0.24, Wilcoxon rank-sum test; Fig. 1D, J, K). The prolonged reduction of neuronal synchrony in Tg1 mice resulted in lower neural synchronicity comparing to WT mice at P-4M (0.162 ± 0.059 in WT and 0.032 ± 0.011 in Tg1 mice, P = 0.045, Wilcoxon rank-sum test; Fig. 1E, J, K). Consistent with previous clinical studies [50], our imaging results demonstrated that neuronal synchronization was higher in the younger at the second postnatal week (Fig. 1K), but lower in the adult Tg1 mice at the fourth postnatal months (Fig. 1K), as compared with WT mice.
Impact of Excitation-Inhibition (E–I) Balance and Synaptic Connectivity on the Higher Neuronal Synchrony in the Young Tg1 Brain
To explore potential underlying neural mechanisms, we performed multiple-electrode whole-cell patch-clamp recordings in acute brain slices from postnatal mice 1–3 weeks old. Previous studies have revealed that both the shift of excitatory/inhibitory (E-I) balance and the architecture of local neural circuits have significant impact on neuronal synchrony [22, 23, 51]. Besides, the overexpression of MeCP2 increases the number of glutamatergic synapses and excitatory neurotransmission [52, 53] in hippocampal neurons. To validate the roles of these synapse-related contributors to higher neural synchrony in young Tg1 mice, we analyzed the sEPSCs and sIPSCs from the same group of neurons in layers 2/3 of the barrel cortex from WT and Tg1 mice. No differences were found in the frequency, amplitude, and synaptic drive for both currents and E-I ratio at the second postnatal week (P = 0.45, 0.11, and 0.85 for excitatory frequency, amplitude, and charge, respectively; P = 0.54, 0.56, and 0.61 for inhibitory events; P = 0.79 for E–I ratio; two-sample t-test; Fig. 2A–D) when neuronal synchrony was significantly higher in Tg1 mice. We noted that the E-I ratio was slightly higher in Tg1 mice at P-3W (P = 0.34, 0.35, and 0.05 for excitatory frequency, amplitude, and charge, respectively; P = 0.55, 0.54, and 0.49 for inhibitory events; P <0.05 for E-I ratio; two-sample t-test; Fig. 2D–G) when neuronal synchrony was comparable in WT and Tg1 mice. Furthermore, multiple whole-cell recordings revealed no significant difference in the synaptic connection rate among local pyramidal cells in the barrel cortex between Tg1 and WT mice (P = 0.07 at P-2W and P = 0.59 at P-3W; Fig. 2H, I). These findings suggest that synapse-related elements might not be crucial determining factors for the higher neuronal synchrony in the young Tg1 brain at P2W.
Fig. 2.

No significant differences in E-I ratio and synaptic connection rate between young Tg1 mice and WT mice. A Representative sEPSC (upper) and sIPSC (lower) recordings from a pyramidal neuron in the barrel cortex of a WT (black) and a Tg1 mouse (red) at P-2W. B, C The frequency (left), amplitude (middle), and charge of excitatory synaptic driving force (right) from sEPSC (B) and sIPSC (C) recordings in WT (n = 13 neurons from 3 mice) and Tg1 mice (n = 18 neurons from 4 mice) at P-2W (two-sample t-test). D Ratios of excitatory and inhibitory synaptic drive in pyramidal neurons from WT and Tg1 mice at P-2W and P-3W (two-sample t-test). E–G Data from P-3W are presented as P-2W in A–C. H Representative quadruple whole-cell patch-clamp recordings from pyramidal neurons in layers 2/3 of barrel cortex. I Connection rate of chemical synapses in WT and Tg1 mice around P-2W and P-3W (Fisher’s exact test, FDR corrected).
A higher frequency of neuronal activity is one of the factors that might lead to higher neuronal synchrony [54]. To understand this potential contribution in Tg1 mice, we computed the pairwise mean firing rates and correlation coefficients for all neuronal pairs as a previous study suggested [55]. Overall, in WT mice there was a linear dependence of rate and correlation at P-3W and P-4M (linear fit; regression slope = 0.029 for P-3W and 0.033 for P-4M; P = 0.01 for P-3W and 0.05 for P-4M, linear regression F-test), but not at P-2W (linear fit; regression slope = –0.0095; P = 0.50, linear regression F-test). In Tg1 mice, the correlation/rate relationship was relatively flat except that at P-3W with a correlation/rate relationship: linear fit; regression slope = –0.0081, 0.024, and 0.018 for P-2W, P-3W, and P-4M, respectively; P = 0.68, 0.01, and 0.22 for P-2W, P-3W, and P-4M, respectively, linear regression F-test (Fig. S3). This result suggested that higher neuronal synchrony at P-2W could not be simply due to the higher frequency of neuronal activity. Moreover, compared with WT mice, the correlation coefficients for neuronal pairs with same activity level were significantly higher in Tg1 mice at P-2W, which further suggested that the higher frequency in Tg1 neurons could not be a direct factor for its higher neuronal synchrony.
More Prevalent Synchronized Slow Inward Currents in Young Tg1 Mice
While we were recording spontaneous neuronal activity for the E–I analysis, many spontaneous giant slow inward currents (SICs) were detected (Fig. 3A). The proportions of neurons with SICs were similar in WT and Tg1 mice (Fig. S4). We found that the frequency of SICs was associated with the developmental age (Fig. 3B). Similar numbers of SICs were detected around the first postnatal week (recorded at P5-P9) in both Tg1 and WT mice. However, they became more frequent in Tg1 mice at P-2W (0.098 ± 0.026/min in WT and 0.337 ± 0.060/min in Tg1 mice, P <0.01, Welch’s t-test, FDR corrected; Fig. 3B). The probability of detecting SICs in neurons was relatively low in both WT and Tg1 mice at P-3W (Fig. 3B and S4). More interestingly, SICs tended to synchronize between neurons based on paired recordings (Fig. 3C–K). There was only a few milliseconds of difference in the cross-correlation peak time for SICs between nearby neurons (Fig. 3C–F). The differences in the peak time correlated positively with the distance between the two neurons under pair-recording (Fig. 3G–K). Our paired whole-cell recordings revealed that there were more prevalent synchronized SICs in Tg1 neurons at P2W when the Tg1 brain was hyper-synchronized.
Fig. 3.

More synchronized slow inward currents in young Tg1 mice. A Representative traces of sEPSC recording (1 out of 30 consecutive traces shown in red and 29 others in gray) in a pyramidal neuron from a Tg1 mouse at P12. a1, amplified fragment containing multiple normal sEPSCs (one indicated by star); a2, amplified fragment containing a typical slow inward current (SIC) with a long rise and decay time (arrow, artefact due to temporarily switching the clamped voltage to ensure the consistency of patching). B Developmental profile of the frequency of SICs recorded from WT and Tg1 mice (P-1W: n = 82 neurons from 15 WT mice and 144 neurons from 26 Tg1 mice; P-2W: n = 55 neurons from 11 WT mice and 181 neurons from 28 Tg1 mice; P-3W: n = 7 neurons from 3 WT mice and 23 neurons from 7 Tg1 mice; Welch’s t-test; error bars represent SEM). C Typical SICs recorded from a pair of neurons 30.75 µm apart in a Tg1 mouse at P-2W (gray, raw traces; purple and dark green, filtered traces). D Merged filtered traces from C. E Amplified SICs from D (green box) to show the difference of SIC peak time (arrows) between cell 1 and cell 2. F Corresponding cross-correlation of SICs recorded from the pair of neurons in C [vertical gray dashed line, correlation at lag time zero; vertical blue dashed line (almost overlapping the gray line); peak correlation; horizontal gray dashed line, shuffled correlation threshold]. G–J Typical SICs from another pair of neurons 524.93 µm apart from a Tg1 mouse at P-2W and the lag of their SICs peak correlation time. K Scatter plot showing the correlation of distance between neuronal pair and lag time of cross-correlation peak (each point represents one pair of neurons; red line, linear fit of all data; Student's t-test; n = 37 pairs).
Higher Astrocyte Activity and Synchronization in Young Tg1 Mice
Our recordings suggested that synapse-related elements might not be crucial factors for the aberrant neuronal synchrony in the young Tg1 brain. However, we found that the time window with more synchronized SICs matched with the window for higher neuronal synchrony in the Tg1 brain. Subsequently, we investigated the potential role of SICs in neuronal synchrony, and to address this question, we needed to understand their source. SICs are widely considered to be caused by astrocytes through the extra-synaptic NR2B-NMDA receptors on neurons [56]. In line with previous reports [56–58], we found that the frequency of SICs markedly declined after the application of Ro25–6981, a specific blocker of NR2B [59] (Fig. S5). Next, we sought to identify the potential changes of astrocytic activity in Tg1 mice. Overall, the dynamic changes of astrocytic activity we detected from in vivo imaging were slightly different when comparing neurons at different stages of development (Fig. S6). In astrocytes of WT mice, the frequency of Ca2+ transients was similarly high at P-2W and P-3W, but decreased by P-4M (Fig. S6A), while the amplitude was the highest in astrocytes at P-4M (Fig. S6B). In astrocytes from Tg1 mice, the frequency of Ca2+ transients was highest at P-2W, lower at P-3M, and lowest at P-4M (Fig. S6A). The frequency of astrocytic Ca2+ events was higher at P-2W but lower at P-4M in Tg1 mice as compared to WT mice (Fig. S6A, insert). No significant differences were found in the amplitude of Ca2+ transients in astrocytes at all three stages between Tg1 and WT mice (Fig. S6B). Furthermore, like neurons, the proportion of active astrocytes also declined in adult brains comparing to young brains (Fig. S6C). However, the reduction of the fraction of active astrocytes in Tg1 mice progressed faster than in neurons. There were still similar numbers of active neurons in WT and Tg1 mice (Fig. S1C) at the P-3W stage, but much fewer active astrocytes at that time in Tg1 brains (Fig. S6C). More interestingly, the developmental changes in synchronous activity among WT astrocytes were paralleled with those found in neurons at all three postnatal stages examined: a sharp decline from P-2W to P-3W, and then stabilization from P-3W to P-4M (P <0.01 for P-2W and P-3W, P = 0.04 for P-2W and P-4M, and P = 0.13 for P-3W and P-4M, Wilcoxon rank-sum test, FDR corrected; Fig. 4A, C). Astrocytes had similar age-dependent changes of synchrony in the Tg1 brain (P <0.001 for P-2W and P-3W, P <0.001 for P-2W and P-4M, and P = 0.016 for P-3W and P-4M, Wilcoxon rank-sum test, FDR corrected; Fig. 4B, D). More importantly, analysis of the synchrony of neuronal pairs within 100 μm revealed that the synchrony in Tg1 mice at P-3W was already lower than that in WT mice (Fig. 4E, F). Earlier switching of astrocytic activity and their synchrony suggests that alteration in astrocytes may precede that in neurons in the autistic brain, which could also be an indication that higher activity of astrocytes plays a critical role for higher neuronal synchrony during the early development of neural circuits in the Tg1 brain.
Fig. 4.

Higher astrocyte activity synchrony in early postnatal Tg1 mice. A, B Cumulative distribution of the pairwise correlation coefficients of all astrocytes in WT (A) and Tg1 (B) mice (gray area, range of half SEM; vertical dotted line, a correlation coefficient of zero). Inserted boxplots show the average pairwise correlation for each imaging field to test their statistical difference (red line, median, Wilcoxon rank-sum test, FDR corrected). C, D Mean correlation for all astrocyte pairs versus their distance for each imaging field from WT (C) and Tg1 (D) mice across different ages (n = 8, 7, and 3 for WT mice and n = 9, 3, and 3 for Tg1 mice at P-2W, P-3W, and P-4M, respectively). E Cumulative fraction of pairwise correlation for all astrocyte pairs within 100 µm from WT and Tg1 mice at three developmental stages. F Boxplots showing the distribution of average correlation for all astrocyte pairs within 100 µm from WT and Tg1 mice across different ages (Wilcoxon rank-sum test).
Astrocytes have many processes that wrap around synapses to interact with neurons [60, 61]. Ca2+ signals in those processes reflect synaptic activity and also influence neuronal activity in return [62, 63]. Previous studies have shown that astrocytic processes are active and independent of cell body activity [63, 64]. To further confirm the differences of Ca2+ signals in astrocytes between Tg1 and WT mouse brains, we performed Ca2+ imaging on astrocytes in acute slices, from which we could perceive fine processes of astrocytes. Astrocytes from the early postnatal Tg1 brains were significantly more active (Fig. S7). Each astrocyte tended to have many isolated dynamic domains. We defined three domains as the soma, microdomains (MD, micro active regions), and broad domains (BD, broad active regions) [39] (Fig. S7A, B), and found no difference in either the number or the average size of all these domains between Tg1 and WT mice (Fig. S7C, D). However, there was a significantly higher frequency (P <0.001 for MD, P <0.001 for BD and P <0.05 for soma, Wilcoxon rank-sum test; Fig. S7E) and amplitude (P <0.01 for MD, P <0.001 for BD and P <0.001 for soma, Wilcoxon rank-sum test; Fig. S7F) of Ca2+ transients at all three types of domains in Tg1 astrocytes. Taken together, our results from both in vivo and in vitro observations revealed that there was more astrocyte activity and synchronization in young Tg1 mice than in WT mice.
More Prevalent SICs Contribute to Higher Neuronal Synchrony in Young Tg1 Mice
Since synchronized SICs are tightly associated with astrocytic activity and gap junctions are critical for the synchrony of cell activity [29, 34, 65–68], we examined the effect of gap 27, a specific blocker for Cx43 [69] that is a dominant isoform for astrocytic gap junction [70], on SICs. To confirm the specificity of gap 27, we examined its effect of on the electrical coupling between interneurons in cortical slices from P-2W mice, the most prominent coupling in the nervous system at that stage besides that among astrocytes. We found that the application of gap 27 did not affect the electrical coupling between interneurons, which was blocked by carbenoxolone, a non-selective gap junction blocker (Fig. S8A, B). We loaded an astrocyte with neurobiotin, which propagates into other astrocytes through the gap junctions among them. We found that gap 27 significantly reduced the number of tracer-coupled cells in the astrocytic network (Fig. S8C, D), indicating that it can effectively block gap junctions among astrocytes. These results further verified the specific effect of gap 27 on astrocytic gap junction. We found that the application of gap 27 indeed reduced the frequency of SICs (Fig. 5A, B). This finding suggests that the inter-connections in the astrocytic network through gap junction contribute to the occurrence of SICs in neurons. Next, we examined the contribution of SICs to the synchrony of neuronal activity. To achieve this goal, we analyzed the correlation coefficients of excitatory current flow between neurons and compared them in the presence or absence of SICs. We eliminated SICs by digitally removing them or applying gap 27. The correlation coefficient of cell activity between neurons significantly declined after removing SICs through both approaches (Pre: 0.833 ± 0.057, SICout: 0.410 ± 0.063, Gap 27: 0.161 ± 0.109, P <0.001 for comparisons between Pre and the two other conditions, paired t-test, FDR corrected; Fig. 5C–G). To directly evaluate the difference in astrocytic gap junctions between WT and Tg1, we first applied Western blot to assess the expression level of Cx43 in both WT and Tg1 at different developmental stages. However, no differences were found between the two genotypes at all three stages (Fig. S9A). We further directly characterized the coupling efficiency of astrocytes in TG1 and WT mice by counting the number of astrocytes after we loaded neurobiotin into one astrocyte, and found a subtle increase but no significant difference in the numbers of tracer-coupled cells between them (WT: 74.91 ± 8.298, Tg1: 98.6 ± 11.71, P = 0.14) (Fig. S9B, C). Since there were no significant differences in the expression level of Cx43 protein and the coupling efficiency of astrocyte gap junction in Tg1 mice, our results suggest that astrocytes inter-connected via gap junctions probably increase neuronal synchrony in the Tg1 brain by increasing the frequency of synchronized SICs in neurons as a facilitator, but not as a direct trigger at the early postnatal stage.
Blocking Astrocytic Gap Junctions Abolishes Hypersynchrony in Young Tg1 Mice
Thus far, we found that young Tg1 mice exhibited higher synchrony of activity in both neurons and astrocytes. We also showed that Tg1 neurons from young mice had more prevalent synchronized SICs that were reduced by blocking astrocyte-specific gap junctions. Next, we directly assessed the role of astrocytic gap junctions in regulating neuronal synchrony in the Tg1 brain. We delivered gap 27 into the somatosensory cortex of P-2W mice and examined its effect on the neuronal synchrony under two-photon microscopy (Fig. 6A, B). Quantifying Ca2+ fluctuations in neurons and astrocytes from both WT and Tg1 mice, we found that gap 27 increased the frequency (Fig. 6C, F) and amplitude of Ca2+ transients in both neurons (Fig. S10A) and astrocytes (Fig. S10B) from WT mice. Conversely, in Tg1 mice, the amplitude of Ca2+ transients in both neurons (Fig. S10A) and astrocytes (Fig. S10B) were reduced by the application of gap 27, but no change was found in the frequency of both cell types (Fig. 6C, F). More importantly, gap 27 markedly reduced the synchrony in both astrocytes (P <0.001, two-sample ANOVA) (Fig. 6D, E) and neurons (P <0.001, two-sample ANOVA) (Fig. 6G, H) in Tg1 mice. Analysis of the synchrony index at the population level further revealed that the application of gap 27 in Tg1 mice reduced their neuronal synchrony to the level of WT mice (P = 0.52 for WT gap 27 group and TG1 gap 27 group; Fig. 6I). Gap 27 also slightly increased the neuronal synchrony in WT mice (Fig. 6G, H), which might arise from elevated but isolated neuronal activity. These findings indicate that dysfunctional astrocyte activity facilitates hypersynchrony in the autistic mouse brain during early neural development in a manner that depends on astrocyte gap junctions.
Fig. 6.

Blocking astrocytic gap junctions abolishes the hypersynchrony in young Tg1 mice. A, B Representative ΔF/F0 of Ca2+ signals from 5 astrocytes from WT (A) and Tg1 mice (B) with the application of gap 27 (right, gray in WT and orange in Tg1 mice) or DMSO (left, dark blue in WT and purple in Tg1 mice) (vertical black dashed lines, synchronized Ca2+ transients among 5 astrocytes; gray dashed lines, synchronization among 2–4 cells). C Cumulative distributions of Ca2+ event rates for all astrocytes in each imaging field, with administration of gap 27 (dotted line, WT in gray and Tg1 in orange) or DMSO (solid line, WT in blue and Tg1 in purple) from WT and Tg1 mice at P-2W. Inserted boxplot shows the distribution of average frequency of Ca2+ fluctuations for all astrocytes in each imaging field. D Cumulative distribution of pairwise correlations for all astrocyte pairs for each imaging field from WT and Tg1 mice at P-2W, with application of gap 27 or DMSO. Inserted boxplot shows the distribution of average correlation for all astrocyte pairs in each imaging field (gray area, range of half SEM). E Mean correlation for all astrocyte pairs in each imaging field versus their distance for WT and Tg1 mice at P-2W. F–H Data from neuronal activity are presented as for astrocytes in C–E. I Synchrony index for populated neurons in each imaging field from WT (black) and Tg1 (red) mice with gap 27 (dotted line) or DMSO (solid line) [Wilcoxon rank-sum test for inserted boxplots in C–D, F–G, and (I); two-sample ANOVA for E and H, FDR corrected].
Discussion
Here we discovered opposing abnormalities of synchrony in Tg1 mice at different developmental stages in both neurons and astrocytes: hypersynchrony in the younger but hyposynchrony in the adult stage, as compared with WT mice. We further demonstrated that the higher neuronal synchrony in the young Tg1 mice was attributed mainly to the more prevalent giant SICs facilitated by inter-connected astrocytes. Finally, we revealed that application of a specific blocker for astrocytic gap junctions abolished the difference in neuronal synchrony between young Tg1 and WT mice.
Previous clinical studies have revealed that correlated activity among brain regions is higher in young [9–12] but lower in adolescent and adult ASD patients [13–19]. Consistent with this, our Ca2+ imaging results demonstrated that neuronal synchronization was higher at P-2W, but lower in the later stages of Tg1 mice. Thus, Tg1 mice can be used as a good model to address the neural mechanism underlying this age-dependent difference. We found more SICs at P-2W but significantly fewer SICs at P-3W in both WT and Tg1 mice. We also demonstrated more SICs in Tg1 mice at P-2W than in WT mice, but no difference between them at P-3W. Blocking the appearance of SICs at P-2W markedly abolished the difference in neuronal synchrony between WT and Tg1 mice. These results strongly suggested that a higher frequency of SIC is one of the main reasons for the higher synchrony in Tg1 at P-2W. By contrast, the mechanism underlying lower synchrony at P-4M remains unclear. Since many factors contribute to the synchrony of neuronal activity [21–24], different factors might carry different weights for the neuronal synchrony at different ages. Due to the low incidence of SICs after P-2W, other factors such as shared synaptic input could play more critical roles in regulating neuronal synchrony at the later stage. Previous studies have reported that long-range neural circuits might be compromised in adult ASD [50]. Thus, the lower synchrony at the adult stage of Tg1 mice may result from defective long-range shared input.
Although MeCP2 overexpression and MeCP2 null show many opposing effects on neurons from gene expression [71], synapse strength and number [52], and synaptic plasticity [72], to dendritic arborization [73], they both lead to same behavioral deficits in mice including impairments in social interaction and repetitive behaviors, which are the core symptoms of ASD. Previous studies have already shown that both increasing and decreasing MeCP2 expression in mice cause hypersynchrony in hippocampal CA1, an impaired homeostatic response to perturbations of excitatory-inhibitory balance, and also a weakened excitatory synaptic response in oriens-layer interneurons [20]. Now, we add more SICs in cortical neurons and aberrant high Ca2+ signals in cortical astrocytes to the list of common abnormalities. The expansion of this “common” list will be beneficial for understanding the neural mechanisms underlying the core symptoms of ASD.
Aberrant neural synchronization in the autistic brain is very common [9–19]. What could be the underlying neural mechanism? Activity correlation between neurons is mainly affected by the architecture of local circuits [21], shared synaptic input [74], global activity [22], and background input [24]. Based on multiple whole-cell recordings from the somatosensory cortex, we found that synaptic connectivity in Tg1 mice was slightly higher among local neurons at P-2W, but at P-3W was at a level similar to WT mice. In addition to that, E-I balance was not well-associated with the changes of neuronal synchrony between young Tg1 and WT mice. These results suggest that synapse-related factors might play only a dispensable role in the higher neuronal synchronization at P-2W in Tg1 mice. By contrast, we found that blocking astrocyte gap junctions abolished the neuronal hypersynchrony in young Tg1 mice. There were more active astrocytes in the second postnatal week but fewer active astrocytes after the third postnatal week in the Tg1 neocortex compared with WT mice. Astrocytes are able to take up extracellular glutamate [75] and release gliotransmitters to communicate with adjacent neurons [29, 75–78], which makes astrocytes a key player in the dynamic neuron-astrocyte feedback loop to influence the activity of nearby neurons. Without astrocytic gap junctions, the neuronal excitatory transmission is enhanced, partially due to increased synaptic glutamate release and spillover [79]. Consistently, we found that gap 27 increased the frequency and amplitude of Ca2+ events in WT mice. By contrast, there were significantly more SICs in Tg1 neurons, suggesting that gliotransmission was a more important factor in the regulation of Ca2+ activity in Tg1 neurons. Since the astrocytic gap junction is a powerful amplifier of its activity [61], blocking the gap junctions among astrocytes tended to decrease glial transmission in Tg1 mice. This blockade led to a decrease in the amplitude of Ca2+ events in both astrocytes and neurons. With gap junctions, astrocytes can enhance neuronal synchronization in a broader region. Our finding that blocking astrocytic gap junctions significantly interrupts the correlation of activity between neurons in the Tg1 brain indicates that increased astrocyte activity facilitated by their gap junctions might be one of the key mechanisms underlying aberrant synchronization in the early development of the autistic brain. On the other hand, we also found that application of the Na+ channel blocker TTX to decrease neuronal activity abolished the difference in the activity of astrocytes of acute brain slices between WT and Tg1 mice at P-2W (Fig. S11). Combined with other findings that there were no differences in the expression of Cx43 and the coupling efficiency of astrocytic gap junctions between WT and Tg1 mice (Fig. S9), our results revealed that there were no significant differences in the intrinsic activity and gap junction of astrocytes themselves in the Tg1 brain. These conclusions support a working model in which a hyperactive dynamic feedback loop is composed of astrocytes and neurons in the Tg1 brain. In this loop, higher neuronal activity in P-2W Tg1 mice led to higher activity in astrocytes which was further amplified by their gap junctions, and this enhanced activity of astrocytes resulted in more frequent SICs in neurons and higher neuronal synchrony. Therefore, the higher neuronal activity could be the original driving force for the higher neuronal synchrony in the Tg1 brain. During the process of neuronal synchronization, astrocytes facilitated but did not function as a direct cause for the transition from higher activity to higher synchrony of Tg1 neurons.
Astrocytes actively control neuronal functions in many developmental processes, such as dendritic growth, from synapse formation to synapse function, and synaptic plasticity [25, 26]. Many lines of evidence have implicated astrocytes in the pathogenesis of ASD. Immunocytochemical studies had already shown neuroinflammation and glial activation in the brain of autistic patients [30]. Studies of mouse models of autism have further strengthened this point. MeCP2 is a well-studied ASD risk gene. Although the absence of MeCP2 in neurons is essential for the neuropathology of ASD, MeCP2 in astrocytes is also involved in many processes because MeCP2-null astrocytes cannot support normal neuronal growth [31, 32]. Additional study demonstrated that some of the neuroanatomical abnormalities and behavior deficits in MeCP2-deficient mice can be partially rescued by re-expression of MeCP2 in astrocytes [33]. Increased spontaneous Ca2+ activity in MeCP2-null astrocytes and SICs from nearby neurons has been reported in the RTT mouse model (MECP2+/-) [34]. More interestingly, impaired Ca2+ signaling in astrocytes has also been recently associated with ASD-like behaviors in IP3R2-null mutant mice [35]. In this study, we found more dynamic astrocyte activity and substantially more SICs in pyramidal cells from Tg1 mice at P-2W when we found higher neuronal synchronization. It was well-documented that SICs in neurons are tightly associated with increased Ca2+ signals in nearby astrocytes from both mouse and human brain tissue [29, 34, 65–68]. Since SICs in neurons were highly synchronized, the physiological consequences of more dynamic Ca2+ signals in astrocytes might be to promote higher synchronization of adjacent neurons. Astrocytes are inter-connected into an extensive network via gap junctions and this is fundamental for synchronization in the brain [80–82]. To reconcile with this idea, we found that the astrocyte-specific blockade of gap junctions dramatically decreased the generation of SICs and further abolished the higher neuronal synchrony in the early developmental stage of the Tg1 cortex. Since aberrant neuronal synchrony is crucial for the etiology of ASD [5, 6], revealing the role of astrocytic gap junctions in this complex process is an important step to understand the pathogenesis of ASD. From a longitudinal study of in vivo Ca2+ imaging, we further discovered the age-dependent abnormalities of glial activation and neuronal synchronization in Tg1 mice. The intriguing question is whether the hypersynchrony in the early developmental stage contributes to the later hyposynchrony in the autistic brain. Although we found no differences between WT and Tg1 mice in the protein level of Cx43 and the strength of astrocytic gap junctions, suggesting that no significant differences in the intrinsic activity and gap junctions of astrocytes themselves in the Tg1 brain, the limitation of our work is that we could not exclude the function of overexpressed astrocytic MeCP2 in the aberrant neuronal synchrony of Tg1 mice. The best way to clarify that is to selectively manipulate MeCP2 in astrocytes at the neonatal stage of WT/Tg1 mice to follow their effects on neuronal synchrony. More work from neonatal transgenic mice with overexpression of MeCP2 specifically in astrocytes or effectively knocking down the expression of hMeCP2 in astrocytes in Tg1 mice are needed to establish causality.
In summary, we demonstrated age-dependent abnormalities of neural synchronization in the Tg1 brain and further uncovered more activated astrocytes and synchronized SICs in neurons from young postnatal Tg1 mice. Blocking astrocyte-specific gap junctions markedly decreased the generation of SICs and overall synchrony in the Tg1 brain. Identifying the role of astrocytic gap junctions in the abnormal neuronal synchronization in autism during early neural development may provide a new therapeutic target for intervening in the pathogenesis of autism.
Supplementary Information
Below is the link to the electronic supplementary material.
Acknowledgements
We thank Dr. Zilong Qiu for providing the Tg1 mouse line, and Dr. Yu Xin for assistance with statistical analysis. We are grateful to Prof. Mu-ming Poo and Dr. Zilong Qiu for critical reading of the manuscript. This work was supported by the Strategic Priority Research Program of the Chinese Academy of Sciences (XDB32010100), a National Natural Science Foundation of China project (31671113), a Shanghai Municipal Science and Technology Major Project (2018SHZDZX05), and the State Key Laboratory of Neuroscience.
Conflict of Interest
The authors declare no potential conflict of interest.
References
- 1.Christensen DL, Maenner MJ, Bilder D, Constantino JN, Daniels J, Durkin MS, et al. Prevalence and characteristics of autism spectrum disorder among children aged 4 years: early autism and developmental disabilities monitoring network, seven sites, United States, 2010, 2012, and 2014. MMWR Surveill Summ. 2019;68:1–19. doi: 10.15585/mmwr.ss6802a1. [DOI] [PMC free article] [PubMed] [Google Scholar]
- 2.Maenner MJ, Shaw KA, Baio J, Washington A, Patrick M, DiRienzo M, et al. Prevalence of autism spectrum disorder among children aged 8 years: autism and developmental disabilities monitoring network, 11 sites, United States, 2016. MMWR Surveill Summ. 2020;69:1–12. doi: 10.15585/mmwr.ss6904a1. [DOI] [PMC free article] [PubMed] [Google Scholar]
- 3.Kim YS, Leventhal BL, Koh YJ, Fombonne E, Laska E, Lim EC, et al. Prevalence of autism spectrum disorders in a total population sample. Am J Psych. 2011;168:904–912. doi: 10.1176/appi.ajp.2011.10101532. [DOI] [PubMed] [Google Scholar]
- 4.Zhou H, Xu X, Yan W, Zou X, Wu L, Luo X, et al. Prevalence of autism spectrum disorder in China: a nationwide multi-center population-based study among children aged 6 to 12 years. Neurosci Bull. 2020;36:961–971. doi: 10.1007/s12264-020-00530-6. [DOI] [PMC free article] [PubMed] [Google Scholar]
- 5.Happé F, Frith U. The weak coherence account: detail-focused cognitive style in autism spectrum disorders. J Autism Dev Disord. 2006;36:5–25. doi: 10.1007/s10803-005-0039-0. [DOI] [PubMed] [Google Scholar]
- 6.Uhlhaas PJ, Singer W. Neural synchrony in brain disorders: relevance for cognitive dysfunctions and pathophysiology. Neuron. 2006;52:155–168. doi: 10.1016/j.neuron.2006.09.020. [DOI] [PubMed] [Google Scholar]
- 7.Belmonte MK, Allen G, Beckel-Mitchener A, Boulanger LM, Carper RA, Webb SJ. Autism and abnormal development of brain connectivity. J Neurosci. 2004;24:9228–9231. doi: 10.1523/JNEUROSCI.3340-04.2004. [DOI] [PMC free article] [PubMed] [Google Scholar]
- 8.Ameis SH, Catani M. Altered white matter connectivity as a neural substrate for social impairment in Autism spectrum disorder. Cortex. 2015;62:158–181. doi: 10.1016/j.cortex.2014.10.014. [DOI] [PubMed] [Google Scholar]
- 9.Keehn B, Wagner JB, Tager-Flusberg H, Nelson CA. Functional connectivity in the first year of life in infants at-risk for autism: a preliminary near-infrared spectroscopy study. Front Hum Neurosci. 2013;7:444. doi: 10.3389/fnhum.2013.00444. [DOI] [PMC free article] [PubMed] [Google Scholar]
- 10.Uddin LQ, Supekar K, Lynch CJ, Khouzam A, Phillips J, Feinstein C, et al. Salience network-based classification and prediction of symptom severity in children with autism. JAMA Psych. 2013;70:869–879. doi: 10.1001/jamapsychiatry.2013.104. [DOI] [PMC free article] [PubMed] [Google Scholar]
- 11.Keown CL, Shih P, Nair A, Peterson N, Mulvey ME, Müller RA. Local functional overconnectivity in posterior brain regions is associated with symptom severity in autism spectrum disorders. Cell Rep. 2013;5:567–572. doi: 10.1016/j.celrep.2013.10.003. [DOI] [PMC free article] [PubMed] [Google Scholar]
- 12.Supekar K, Uddin LQ, Khouzam A, Phillips J, Gaillard WD, Kenworthy LE, et al. Brain hyperconnectivity in children with autism and its links to social deficits. Cell Rep. 2013;5:738–747. doi: 10.1016/j.celrep.2013.10.001. [DOI] [PMC free article] [PubMed] [Google Scholar]
- 13.Castelli F, Frith C, Happé F, Frith U. Autism, Asperger syndrome and brain mechanisms for the attribution of mental states to animated shapes. Brain. 2002;125:1839–1849. doi: 10.1093/brain/awf189. [DOI] [PubMed] [Google Scholar]
- 14.Horwitz B, Rumsey JM, Grady CL, Rapoport SI. The cerebral metabolic landscape in autism. Intercorrelations of regional glucose utilization. Arch Neurol. 1988;45:749–755. doi: 10.1001/archneur.1988.00520310055018. [DOI] [PubMed] [Google Scholar]
- 15.d'Albis MA, Guevara P, Guevara M, Laidi C, Boisgontier J, Sarrazin S, et al. Local structural connectivity is associated with social cognition in autism spectrum disorder. Brain. 2018;141:3472–3481. doi: 10.1093/brain/awy275. [DOI] [PubMed] [Google Scholar]
- 16.Courchesne E, Pierce K. Why the frontal cortex in autism might be talking only to itself: local over-connectivity but long-distance disconnection. Curr Opin Neurobiol. 2005;15:225–230. doi: 10.1016/j.conb.2005.03.001. [DOI] [PubMed] [Google Scholar]
- 17.Geschwind DH, Levitt P. Autism spectrum disorders: developmental disconnection syndromes. Curr Opin Neurobiol. 2007;17:103–111. doi: 10.1016/j.conb.2007.01.009. [DOI] [PubMed] [Google Scholar]
- 18.Schipul SE, Keller TA, Just MA. Inter-regional brain communication and its disturbance in autism. Front Syst Neurosci. 2011;5:10. doi: 10.3389/fnsys.2011.00010. [DOI] [PMC free article] [PubMed] [Google Scholar]
- 19.Just MA, Keller TA, Malave VL, Kana RK, Varma S. Autism as a neural systems disorder: a theory of frontal-posterior underconnectivity. Neurosci Biobehav Rev. 2012;36:1292–1313. doi: 10.1016/j.neubiorev.2012.02.007. [DOI] [PMC free article] [PubMed] [Google Scholar]
- 20.Lu H, Ash RT, He LJ, Kee SE, Wang W, Yu DH, et al. Loss and gain of MeCP2 cause similar hippocampal circuit dysfunction that is rescued by deep brain stimulation in a rett syndrome mouse model. Neuron. 2016;91:739–747. doi: 10.1016/j.neuron.2016.07.018. [DOI] [PMC free article] [PubMed] [Google Scholar]
- 21.Ko H, Hofer SB, Pichler B, Buchanan KA, Sjöström PJ, Mrsic-Flogel TD. Functional specificity of local synaptic connections in neocortical networks. Nature. 2011;473:87–91. doi: 10.1038/nature09880. [DOI] [PMC free article] [PubMed] [Google Scholar]
- 22.Renart A, de la Rocha J, Bartho P, Hollender L, Parga N, Reyes A, et al. The asynchronous state in cortical circuits. Science. 2010;327:587–590. doi: 10.1126/science.1179850. [DOI] [PMC free article] [PubMed] [Google Scholar]
- 23.Maheswaranathan N, Ferrari S, Vandongen AM, Henriquez CS. Emergent bursting and synchrony in computer simulations of neuronal cultures. Front Comput Neurosci. 2012;6:15. doi: 10.3389/fncom.2012.00015. [DOI] [PMC free article] [PubMed] [Google Scholar]
- 24.Ostojic S, Brunel N, Hakim V. How connectivity, background activity, and synaptic properties shape the cross-correlation between spike trains. J Neurosci. 2009;29:10234–10253. doi: 10.1523/JNEUROSCI.1275-09.2009. [DOI] [PMC free article] [PubMed] [Google Scholar]
- 25.Barres BA. The mystery and magic of glia: a perspective on their roles in health and disease. Neuron. 2008;60:430–440. doi: 10.1016/j.neuron.2008.10.013. [DOI] [PubMed] [Google Scholar]
- 26.Wilton DK, Dissing-Olesen L, Stevens B. Neuron-glia signaling in synapse elimination. Annu Rev Neurosci. 2019;42:107–127. doi: 10.1146/annurev-neuro-070918-050306. [DOI] [PubMed] [Google Scholar]
- 27.Nimmerjahn A, Bergles DE. Large-scale recording of astrocyte activity. Curr Opin Neurobiol. 2015;32:95–106. doi: 10.1016/j.conb.2015.01.015. [DOI] [PMC free article] [PubMed] [Google Scholar]
- 28.Zonta M, Carmignoto G. Calcium oscillations encoding neuron-to-astrocyte communication. J Physiol Paris. 2002;96:193–198. doi: 10.1016/S0928-4257(02)00006-2. [DOI] [PubMed] [Google Scholar]
- 29.Fellin T, Pascual O, Gobbo S, Pozzan T, Haydon PG, Carmignoto G. Neuronal synchrony mediated by astrocytic glutamate through activation of extrasynaptic NMDA receptors. Neuron. 2004;43:729–743. doi: 10.1016/j.neuron.2004.08.011. [DOI] [PubMed] [Google Scholar]
- 30.Vargas DL, Nascimbene C, Krishnan C, Zimmerman AW, Pardo CA. Neuroglial activation and neuroinflammation in the brain of patients with autism. Ann Neurol. 2005;57:67–81. doi: 10.1002/ana.20315. [DOI] [PubMed] [Google Scholar]
- 31.Ballas N, Lioy DT, Grunseich C, Mandel G. Non-cell autonomous influence of MeCP2-deficient glia on neuronal dendritic morphology. Nat Neurosci. 2009;12:311–317. doi: 10.1038/nn.2275. [DOI] [PMC free article] [PubMed] [Google Scholar]
- 32.Maezawa I, Swanberg S, Harvey D, LaSalle JM, Jin LW. Rett syndrome astrocytes are abnormal and spread MeCP2 deficiency through gap junctions. J Neurosci. 2009;29:5051–5061. doi: 10.1523/JNEUROSCI.0324-09.2009. [DOI] [PMC free article] [PubMed] [Google Scholar]
- 33.Lioy DT, Garg SK, Monaghan CE, Raber J, Foust KD, Kaspar BK, et al. A role for glia in the progression of Rett's syndrome. Nature. 2011;475:497–500. doi: 10.1038/nature10214. [DOI] [PMC free article] [PubMed] [Google Scholar]
- 34.Dong QP, Liu Q, Li RH, Wang AX, Bu Q, Wang KH, et al. Mechanism and consequence of abnormal calcium homeostasis in Rett syndrome astrocytes. Elife. 2018;7:e33417. doi: 10.7554/eLife.33417. [DOI] [PMC free article] [PubMed] [Google Scholar]
- 35.Wang Q, Kong Y, Wu DY, Liu JH, Jie W, You QL, et al. Impaired calcium signaling in astrocytes modulates autism spectrum disorder-like behaviors in mice. Nat Commun. 2021;12:3321. doi: 10.1038/s41467-021-23843-0. [DOI] [PMC free article] [PubMed] [Google Scholar]
- 36.Collins AL, Levenson JM, Vilaythong AP, Richman R, Armstrong DL, Noebels JL, et al. Mild overexpression of MeCP2 causes a progressive neurological disorder in mice. Hum Mol Genet. 2004;13:2679–2689. doi: 10.1093/hmg/ddh282. [DOI] [PubMed] [Google Scholar]
- 37.Yu B, Yuan B, Dai JK, Cheng TL, Xia SN, He LJ, et al. Reversal of social recognition deficit in adult mice with MECP2 duplication via normalization of MeCP2 in the medial prefrontal cortex. Neurosci Bull. 2020;36:570–584. doi: 10.1007/s12264-020-00467-w. [DOI] [PMC free article] [PubMed] [Google Scholar]
- 38.Guizar-Sicairos M, Thurman ST, Fienup JR. Efficient subpixel image registration algorithms. Opt Lett. 2008;33:156–158. doi: 10.1364/OL.33.000156. [DOI] [PubMed] [Google Scholar]
- 39.Srinivasan R, Huang BS, Venugopal S, Johnston AD, Chai H, Zeng HK, et al. Ca2+ signaling in astrocytes from Ip3r2(-/-) mice in brain slices and during startle responses in vivo. Nat Neurosci. 2015;18:708–717. doi: 10.1038/nn.4001. [DOI] [PMC free article] [PubMed] [Google Scholar]
- 40.Tong XP, Shigetomi E, Looger LL, Khakh BS. Genetically encoded calcium indicators and astrocyte calcium microdomains. Neuroscientist. 2013;19:274–291. doi: 10.1177/1073858412468794. [DOI] [PubMed] [Google Scholar]
- 41.Leighton AH, Lohmann C. The wiring of developing sensory circuits-from patterned spontaneous activity to synaptic plasticity mechanisms. Front Neural Circuits. 2016;10:71. doi: 10.3389/fncir.2016.00071. [DOI] [PMC free article] [PubMed] [Google Scholar]
- 42.Dombeck DA, Harvey CD, Tian L, Looger LL, Tank DW. Functional imaging of hippocampal place cells at cellular resolution during virtual navigation. Nat Neurosci. 2010;13:1433–1440. doi: 10.1038/nn.2648. [DOI] [PMC free article] [PubMed] [Google Scholar]
- 43.Golomb D. Neuronal synchrony measures. Scholarpedia. 2007;2:1347. doi: 10.4249/scholarpedia.1347. [DOI] [Google Scholar]
- 44.Golomb D, Shedmi A, Curtu R, Ermentrout GB. Persistent synchronized bursting activity in cortical tissues with low magnesium concentration: a modeling study. J Neurophysiol. 2006;95:1049–1067. doi: 10.1152/jn.00932.2005. [DOI] [PubMed] [Google Scholar]
- 45.Tischbirek CH, Noda T, Tohmi M, Birkner A, Nelken I, Konnerth A. In vivo functional mapping of a cortical column at single-neuron resolution. Cell Rep. 2019;27:1319–1326.e5. doi: 10.1016/j.celrep.2019.04.007. [DOI] [PubMed] [Google Scholar]
- 46.Tada M, Takeuchi A, Hashizume M, Kitamura K, Kano M. A highly sensitive fluorescent indicator dye for calcium imaging of neural activity in vitro and in vivo. Eur J Neurosci. 2014;39:1720–1728. doi: 10.1111/ejn.12476. [DOI] [PMC free article] [PubMed] [Google Scholar]
- 47.Schnell C, Hagos Y, Hülsmann S. Active sulforhodamine 101 uptake into hippocampal astrocytes. PLoS ONE. 2012;7:e49398. doi: 10.1371/journal.pone.0049398. [DOI] [PMC free article] [PubMed] [Google Scholar]
- 48.Nimmerjahn A, Kirchhoff F, Kerr JN, Helmchen F. Sulforhodamine 101 as a specific marker of astroglia in the neocortex in vivo. Nat Methods. 2004;1:31–37. doi: 10.1038/nmeth706. [DOI] [PubMed] [Google Scholar]
- 49.Gonçalves JT, Anstey JE, Golshani P, Portera-Cailliau C. Circuit level defects in the developing neocortex of Fragile X mice. Nat Neurosci. 2013;16:903–909. doi: 10.1038/nn.3415. [DOI] [PMC free article] [PubMed] [Google Scholar]
- 50.Uddin LQ, Supekar K, Menon V. Reconceptualizing functional brain connectivity in autism from a developmental perspective. Front Hum Neurosci. 2013;7:458. doi: 10.3389/fnhum.2013.00458. [DOI] [PMC free article] [PubMed] [Google Scholar]
- 51.Doiron B, Litwin-Kumar A, Rosenbaum R, Ocker GK, Josić K. The mechanics of state-dependent neural correlations. Nat Neurosci. 2016;19:383–393. doi: 10.1038/nn.4242. [DOI] [PMC free article] [PubMed] [Google Scholar]
- 52.Chao HT, Zoghbi HY, Rosenmund C. MeCP2 controls excitatory synaptic strength by regulating glutamatergic synapse number. Neuron. 2007;56:58–65. doi: 10.1016/j.neuron.2007.08.018. [DOI] [PMC free article] [PubMed] [Google Scholar]
- 53.Na ES, Nelson ED, Adachi M, Autry AE, Mahgoub MA, Kavalali ET, et al. A mouse model for MeCP2 duplication syndrome: MeCP2 overexpression impairs learning and memory and synaptic transmission. J Neurosci. 2012;32:3109–3117. doi: 10.1523/JNEUROSCI.6000-11.2012. [DOI] [PMC free article] [PubMed] [Google Scholar]
- 54.de la Rocha J, Doiron B, Shea-Brown E, Josić K, Reyes A. Correlation between neural spike trains increases with firing rate. Nature. 2007;448:802–806. doi: 10.1038/nature06028. [DOI] [PubMed] [Google Scholar]
- 55.Chen Q, Deister CA, Gao X, Guo BL, Lynn-Jones T, Chen NY, et al. Dysfunction of cortical GABAergic neurons leads to sensory hyper-reactivity in a Shank3 mouse model of ASD. Nat Neurosci. 2020;23:520–532. doi: 10.1038/s41593-020-0598-6. [DOI] [PMC free article] [PubMed] [Google Scholar]
- 56.Haydon PG, Carmignoto G. Astrocyte control of synaptic transmission and neurovascular coupling. Physiol Rev. 2006;86:1009–1031. doi: 10.1152/physrev.00049.2005. [DOI] [PubMed] [Google Scholar]
- 57.Fellin T, Pascual O, Haydon PG. Astrocytes coordinate synaptic networks: balanced excitation and inhibition. Physiol (Bethesda) 2006;21:208–215. doi: 10.1152/physiol.00161.2005. [DOI] [PubMed] [Google Scholar]
- 58.Pál B. Astrocytic actions on extrasynaptic neuronal currents. Front Cell Neurosci. 2015;9:474. doi: 10.3389/fncel.2015.00474. [DOI] [PMC free article] [PubMed] [Google Scholar]
- 59.Fischer G, Mutel V, Trube G, Malherbe P, Kew JN, Mohacsi E, et al. Ro 25–6981, a highly potent and selective blocker of N-methyl-D-aspartate receptors containing the NR2B subunit. Characterization in vitro. J Pharmacol Exp Ther. 1997;283:1285–1292. [PubMed] [Google Scholar]
- 60.Perea G, Navarrete M, Araque A. Tripartite synapses: astrocytes process and control synaptic information. Trends Neurosci. 2009;32:421–431. doi: 10.1016/j.tins.2009.05.001. [DOI] [PubMed] [Google Scholar]
- 61.Verkhratsky A, Nedergaard M. Physiology of astroglia. Physiol Rev. 2018;98:239–389. doi: 10.1152/physrev.00042.2016. [DOI] [PMC free article] [PubMed] [Google Scholar]
- 62.Araque A, Carmignoto G, Haydon PG, Oliet SH, Robitaille R, Volterra A. Gliotransmitters travel in time and space. Neuron. 2014;81:728–739. doi: 10.1016/j.neuron.2014.02.007. [DOI] [PMC free article] [PubMed] [Google Scholar]
- 63.Volterra A, Liaudet N, Savtchouk I. Astrocyte Ca2+ signalling: An unexpected complexity. Nat Rev Neurosci. 2014;15:327–335. doi: 10.1038/nrn3725. [DOI] [PubMed] [Google Scholar]
- 64.Bindocci E, Savtchouk I, Liaudet N, Becker D, Carriero G, Volterra A. Three-dimensional Ca2+ imaging advances understanding of astrocyte biology. Science. 2017;356:eaai8185. doi: 10.1126/science.aai8185. [DOI] [PubMed] [Google Scholar]
- 65.Parri HR, Gould TM, Crunelli V. Spontaneous astrocytic Ca2+ oscillations in situ drive NMDAR-mediated neuronal excitation. Nat Neurosci. 2001;4:803–812. doi: 10.1038/90507. [DOI] [PubMed] [Google Scholar]
- 66.Kovács A, Pál B. Astrocyte-dependent slow inward currents (SICs) participate in neuromodulatory mechanisms in the pedunculopontine nucleus (PPN) Front Cell Neurosci. 2017;11:16. doi: 10.3389/fncel.2017.00016. [DOI] [PMC free article] [PubMed] [Google Scholar]
- 67.Navarrete M, Perea G, Maglio L, Pastor J, García de Sola R, Araque A. Astrocyte calcium signal and gliotransmission in human brain tissue. Cereb Cortex. 2013;23:1240–1246. doi: 10.1093/cercor/bhs122. [DOI] [PubMed] [Google Scholar]
- 68.Mariotti L, Losi G, Sessolo M, Marcon I, Carmignoto G. The inhibitory neurotransmitter GABA evokes long-lasting Ca(2+) oscillations in cortical astrocytes. Glia. 2016;64:363–373. doi: 10.1002/glia.22933. [DOI] [PMC free article] [PubMed] [Google Scholar]
- 69.Martin PE, Wall C, Griffith TM. Effects of connexin-mimetic peptides on gap junction functionality and connexin expression in cultured vascular cells. Br J Pharmacol. 2005;144:617–627. doi: 10.1038/sj.bjp.0706102. [DOI] [PMC free article] [PubMed] [Google Scholar]
- 70.Nagy JI, Yamamoto T, Sawchuk MA, Nance DM, Hertzberg EL. Quantitative immunohistochemical and biochemical correlates of connexin43 localization in rat brain. Glia. 1992;5:1–9. doi: 10.1002/glia.440050102. [DOI] [PubMed] [Google Scholar]
- 71.Chahrour M, Jung SY, Shaw C, Zhou XB, Wong ST, Qin J, et al. MeCP2, a key contributor to neurological disease, activates and represses transcription. Science. 2008;320:1224–1229. doi: 10.1126/science.1153252. [DOI] [PMC free article] [PubMed] [Google Scholar]
- 72.Chahrour M, Zoghbi HY. The story of Rett syndrome: from clinic to neurobiology. Neuron. 2007;56:422–437. doi: 10.1016/j.neuron.2007.10.001. [DOI] [PubMed] [Google Scholar]
- 73.Jiang MH, Ash RT, Baker SA, Suter B, Ferguson A, Park J, et al. Dendritic arborization and spine dynamics are abnormal in the mouse model of MECP2 duplication syndrome. J Neurosci. 2013;33:19518–19533. doi: 10.1523/JNEUROSCI.1745-13.2013. [DOI] [PMC free article] [PubMed] [Google Scholar]
- 74.Shadlen MN, Newsome WT. The variable discharge of cortical neurons: implications for connectivity, computation, and information coding. J Neurosci. 1998;18:3870–3896. doi: 10.1523/JNEUROSCI.18-10-03870.1998. [DOI] [PMC free article] [PubMed] [Google Scholar]
- 75.Anderson CM, Swanson RA. Astrocyte glutamate transport: review of properties, regulation, and physiological functions. Glia. 2000;32:1–14. doi: 10.1002/1098-1136(200010)32:1<1::AID-GLIA10>3.0.CO;2-W. [DOI] [PubMed] [Google Scholar]
- 76.Pirttimaki TM, Sims RE, Saunders G, Antonio SA, Codadu NK, Parri HR. Astrocyte-mediated neuronal synchronization properties revealed by false gliotransmitter release. J Neurosci. 2017;37:9859–9870. doi: 10.1523/JNEUROSCI.2761-16.2017. [DOI] [PMC free article] [PubMed] [Google Scholar]
- 77.Yu XZ, Taylor AMW, Nagai NG, Golshani P, Evans CJ, Coppola G, et al. Reducing astrocyte calcium signaling in vivo alters striatal microcircuits and causes repetitive behavior. Neuron. 2018;99:1170–1187.e9. doi: 10.1016/j.neuron.2018.08.015. [DOI] [PMC free article] [PubMed] [Google Scholar]
- 78.Ma ZG, Stork T, Bergles DE, Freeman MR. Neuromodulators signal through astrocytes to alter neural circuit activity and behaviour. Nature. 2016;539:428–432. doi: 10.1038/nature20145. [DOI] [PMC free article] [PubMed] [Google Scholar]
- 79.Pannasch U, Vargová L, Reingruber J, Ezan P, Holcman D, Giaume C, et al. Astroglial networks scale synaptic activity and plasticity. Proc Natl Acad Sci U S A. 2011;108:8467–8472. doi: 10.1073/pnas.1016650108. [DOI] [PMC free article] [PubMed] [Google Scholar]
- 80.Tani E, Nishiura M, Higashi N. Freeze-fracture studies of gap junctions of normal and neoplastic astrocytes. Acta Neuropathol. 1973;26:127–138. doi: 10.1007/BF00697748. [DOI] [PubMed] [Google Scholar]
- 81.Buskila Y, Bellot-Saez A, Morley JW. Generating brain waves, the power of astrocytes. Front Neurosci. 2019;13:1125. doi: 10.3389/fnins.2019.01125. [DOI] [PMC free article] [PubMed] [Google Scholar]
- 82.Houades V, Koulakoff A, Ezan P, Seif I, Giaume C. Gap junction-mediated astrocytic networks in the mouse barrel cortex. J Neurosci. 2008;28:5207–5217. doi: 10.1523/JNEUROSCI.5100-07.2008. [DOI] [PMC free article] [PubMed] [Google Scholar]
Associated Data
This section collects any data citations, data availability statements, or supplementary materials included in this article.