Abstract
Population size has made disease monitoring a major concern in the healthcare system, due to which auto-detection has become a top priority. Intelligent disease detection frameworks enable doctors to recognize illnesses, provide stable and accurate results, and lower mortality rates. An acute and severe disease known as Coronavirus (COVID19) has suddenly become a global health crisis. The fastest way to avoid the spreading of Covid19 is to implement an automated detection approach. In this study, an explainable COVID19 detection in CT scan and chest X-ray is established using a combination of deep learning and machine learning classification algorithms. A Convolutional Neural Network (CNN) collects deep features from collected images, and these features are then fed into a machine learning ensemble for COVID19 assessment. To identify COVID19 disease from images, an ensemble model is developed which includes, Gaussian Naive Bayes (GNB), Support Vector Machine (SVM), Decision Tree (DT), Logistic Regression (LR), K-Nearest Neighbor (KNN), and Random Forest (RF). The overall performance of the proposed method is interpreted using Gradient-weighted Class Activation Mapping (Grad-CAM), and t-distributed Stochastic Neighbor Embedding (t-SNE). The proposed method is evaluated using two datasets containing 1,646 and 2,481 CT scan images gathered from COVID19 patients, respectively. Various performance comparisons with state-of-the-art approaches were also shown. The proposed approach beats existing models, with scores of 98.5% accuracy, 99% precision, and 99% recall, respectively. Further, the t-SNE and explainable Artificial Intelligence (AI) experiments are conducted to validate the proposed approach.
Keywords: COVID19, Explainable AI, Features selection, Ensemble learning, IoT, Covid Severity
Introduction
All enterprises have been put on lockdown as a result of the coronavirus epidemic. Since about July 9, 2020, the World Health Organization (WHO) forecasts that over 12 million individuals are infected, with 552,050 causalities [1]. In addition, health systems in developed countries have deteriorated, resulting in a scarcity of intensive-care units. The strain was found to be infected with two distinct coronaviruses, severe acute respiratory syndrome (SARS) and middle east respiratory syndrome (MERS) [2]. Covid-19 symptoms can range from cold to fever, shortness of breath, and severe respiratory disease [3]. In comparison to SARS, both coronavirus and the respiratory system have been shown to cause kidney and liver damage [4]. There is no specific vaccine available to protect against Covid-19 and other potentially fatal diseases. The only way to prevent the virus from spreading to healthy people is to isolate the infected person. The technique of RT-PCR is used to detect Covid-19 in a respiration sample [5]. It has been difficult to avoid corona infectious disease due to a lack of supplies and the constraints of RT-PCR. By combining clinical indications of infected individuals with lab results, radiographic imaging techniques are used to identify SARS-CoV2 [6]. To quickly eliminate infectious persons and manage the epidemic, radiographic imaging, such as lung radiation and chest CT, is useful [6]. The radiographic characteristics of the coronavirus can be quickly identified using such methods. Covid-19 disease necessitates an immediate diagnosis and adequate intervention due to its significant influence on mobility in patients. The medical community has embraced Computerized Diagnostics (CAD), which makes use of Internet of Things (IoT) technology. They are justified by their rapid response and improved accuracy in medical diagnoses. These aspects are crucial, particularly in areas with vulnerable medical conditions. It has been shown that real-time IoT systems can help doctors to provide smart facilities in remote areas [7, 8]. As a result, the use of a real-time IoT system that doctors can access from anywhere ensures that more people will be medicated quickly and without regard for personal or physical factors [9].
Radiologists prefer to use chest X-rays because most healthcare institutions have X-ray machines. Nevertheless, distinguishing between soft tissues from X-ray images can be difficult. To address this issue, a chest CT scan is commonly used. Radiologists are required to review chest CT scans [10, 11]. However, it is time-consuming and prone to errors. To achieve accurate results with better performance, Covid-19 must be detected automatically in CT scans and chest X-rays. As a result, the use of machine learning has increased in recent years in the diagnosis of coronary abnormalities [12, 13], diabetic eye disease detection [14], cornel symptoms classification [15], etc. These techniques show promise in terms of reducing medical errors, identifying and tracking asymptomatic carriers early, and providing people with adequate medical initiatives to support their health care. Recently, computer vision[16], machine learning, and deep learning [17] have been used to identify various types of diseases automatically, resulting in fast and intelligent health care systems [18, 19]. As a featured mining, deep learning tends to boost classification performance [20]. For instance, deep learning can identify lung tumors, bone inhibition by diagnostic radiology, diabetic nephropathy, and bladder segmentation as well as the intervention of the cardiac muscle in coronary CT scans [21].
The purpose of this study is to identify and classify Covid-19 in CT and X-ray images. To accomplish this, the following major challenges in Artificial Intelligence (AI) and Covid-19 detection must be acknowledged. Most current systems focus on Covid-19 identification, which helps doctors to distinguish Covid19 patients from other bacterial meningitis patients. They are unable to detect how severe Covid-19 is. So, radiologists and doctors need more time and effort to interpret the symptoms. The most difficult part of automating Covid-19 detection is gathering large labeled training data. According to recent Covid-19 literary works, the number of non-severe instances is much bigger than the number of severe cases. As a result, the Covid-19 dataset suffers from overfitting, which decreases detection performance [22]. CNN networks can extract features from large image datasets with high dimensions. The training process for these networks, however, is more complicated, time-consuming, and resource-intensive due to the high dimensionality of the data. As a result, such networks are no longer needed, especially in IoT-based treatment modalities where computational resources are limited in comparison to CNN computational costs.
The goal of this research is to develop an explainable COVID19 detection approach for CT scans and chest X-rays by combining deep learning and machine learning classification algorithms. This study employs deep learning and machine learning classification techniques to detect COVID19 in CT scans and chest X-rays. The CNN model is designed to retrieve 350 important features. These features are then used in GNB, SVM, DT, LR, and RF classification algorithms. Finally, a voting-based ensemble model is designed for COVID19 CT image classification. t-SNE and explainable AI tests are used to validate the proposed research. Following are the main contributions of this study.
CNN is designed to capture deep information from CT scans and chest X-rays and feed them to an ensemble of machine learning algorithms for COVID19 detection. Such deep features are really helpful in monitoring real-time COVID19 infections.
Deep learning and machine learning are combined to detect COVID19 infections. The soft voting system is designed to increase the rate of detection. CNN is used to extract the most effective features and then pass them to the state-of-the-art methods and their ensemble. The comprehensive experiments are conducted to show the effectiveness of the proposed method.
An explainable AI using Grad-CAM is designed to interpret and validate the proposed approach. Moreover, the t-SNE visualization experiment is conducted to analyze the distribution of features with different perplexity values. This can help us to study the outliers and noisy features.
The first section covers the introduction, the second section the literature review, the third section the proposed approach, and the fourth section the experimental results. Finally, part 5 concludes the whole study.
Literature review
More research has been done on deep learning-based methods for improving Covid-19 detection and severity classification accuracy. For instance, Sarkar et al. [23] developed a transfer learning approach to classify Covid-19 using DenseNet 121. They built a system for analyzing radiographic images and expressing the affected regions. The proposed approach achieved 87% classification performance. Shan et al. [24] developed a deep learning method for analyzing and categorizing diseased lung areas. The approach is tested on 300 coronavirus-infected cases and achieved 91% classification accuracy. The proposed method is incapable of determining the severity of Pneumonia. DenseNet is used by Zhang et al. [25] to detect coronavirus disease. Covid-19 had a case identification sensitivity of 96%, while non-Covid-19 had a case identification sensitivity of 70.65%. Wang et al. [26] used pre-trained deep learning methods to identify Covid-19 infections from lung images. The proposed method is tested by more than 1,260 people in six cities and achieved 87% classification accuracy.
The use of the Internet of Things (IoT) to deliver quality healthcare has received a lot of attention in literary works. Implementing IoT reduces healthcare costs and improves the treatment experience. Otoom et al. [27] have used a combination of eight machine learning models to classify Covid-19 patients using an IoT network. After identifying the appropriate symptoms, these eight modes are tested on a real COVID-19 symptom dataset. The results show that five of the eight models are over 90% accurate. Based on these findings, they believe the framework can track each patient's therapeutic efficacy. Ahmed et al. [28] developed an IoT-based classification model for Covid-19 evaluation. It can relieve doctors' workload and help control pandemics. This study used X-ray visuals of the chest to identify Covid-19 using a deep learning method with ResNet-101. The model achieves a 98% classification rate. Rohila et al. [29] This paper describe the ReCOV-101 deep learning approach for COVID-19 infection based on CT scans. The proposed method is based on the residual network, which employs skip connections to deepen the model. The proposed method can correctly classify 94.9% of the cases.
Hemdan et al. [30] present a deep learning-based system for identifying Covid-19 chest X-ray images. Nine pre-trained deep neural networks were used to mine features from Covid-19 X-rays, and SVM was used to classify them. This method achieved a classification accuracy of 95.38%. Aayush et al. [31] used a pre-trained deep learning model to diagnose Covid-19 in patients' chest CT scan images. They used the DenseNet201 deep transfer learning (DTL) model to determine whether a patient was infected with Covid-19. To classify images from Covid-19 CT scans, the proposed CNN network used pre-defined learning weights from the ImageNet database. They also trained the deep learning model with 14 layers of direct image input. In comparison to state-of-the-art approaches, the predictive model produced better classification results. Silva et al. [32] used a voting-based deep learning method to identify Covid-19 positive patients. They used a mix of transfer learning and a voting method. To train the proposed deep learning model, they used direct image input with 18 layers of architecture. The proposed voting system categorizes Covid-19 images into distinct groups. Hassan et al. [33] propose a comparable mechanism for COVID-19 categorization using CT scans. The technique is divided into four steps: creating three distinct databases: COVID-19, pneumonia, and ordinary; modifying three pre-trained deep neural networks: VGG16, ResNet50, and ResNet101 for COVID-19-positive scans; suggesting an input vector and improving evolutionary algorithms for feature selection; and combining the best solution to classify multi-. They demonstrate that this method boosts accuracy to 97.9%.
This research develops an explainable COVID19 detection in CT and chest X-rays using deep learning and machine learning classification algorithms. It uses a CNN to capture deep features from CT scans and chest X-rays, which are then fed into a voting-based ensemble model. To distinguish COVID19 illness samples from normal ones, the ensemble utilizes state-of-the-art models, i.e., GNB, SVM, DT, LR, and RF. The overall performance of the proposed system is interpreted using Grad-CAM combined with t-SNE. The suggested technique is tested on two COVID19 patient datasets with 1,646 and 2,481 CT scan pictures each. It is shown that the proposed approach is outperforming the existing methods in terms of precision, recall, f1-score, and accuracy.
Proposed methodology
The connectivity of a web service with a cloud infrastructure service is the foundation of this IoT platform. The web application is written in Java, which makes it simple to manipulate the data and parameters required to create categorization results. This section of the system is also in charge of interfacing with the computing cloud from portable devices and laptops. The IoT is a well-defined framework of networked computing techniques, and digital, and mechanical equipment capable of transmitting data across a defined network without the intervention of humans. Each device in an IoT network device has a unique personal identification number. IoT has become a well-established and recognized technology that connects a variety of approaches, real-time statistics, machine learning ideas, sensing gadgets, and so on. The number of infected cases is growing by the day in the present outbreak crisis, and there is an urgent need to make use of the well-equipped and well-organized facilities provided by the IoT technique. The IoT is a cutting-edge technology that ensures that all people who have been infected with COVID19 are isolated. It is beneficial to have a robust monitoring system in place during quarantine. All high-risk patients may be easily tracked thanks to the internet-based network [34].
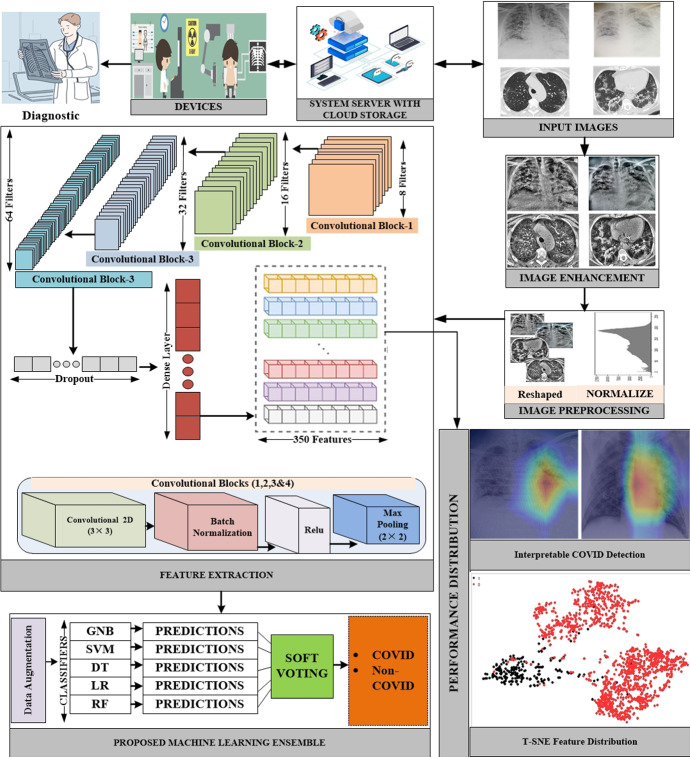
Figure 1 shows the proposed framework for detecting COVID19 in CT scans. Deep learning in medical imaging has been increasingly popular in recent years. In this work, we obtained CT scan images from COVID19 patients for feature representation. We use a variety of features because the images are blurry. We used some well-known machine learning methods to preprocess the retrieved features. After that, a deep CNN model is proposed to distinguish the different visual features. Voting ensemble-based method for making a final forecast is also being studied to reduce categorization error. When a majority of votes are cast in favor of a particular method reduced [35, 36]. Finally, we used this ensemble-based method to improve the efficacy of these methods.
Fig. 1.
The overall system architecture of the proposed interpretable COVID-19 detection system based on a real-time IoT system
Preprocessing and image enhancement
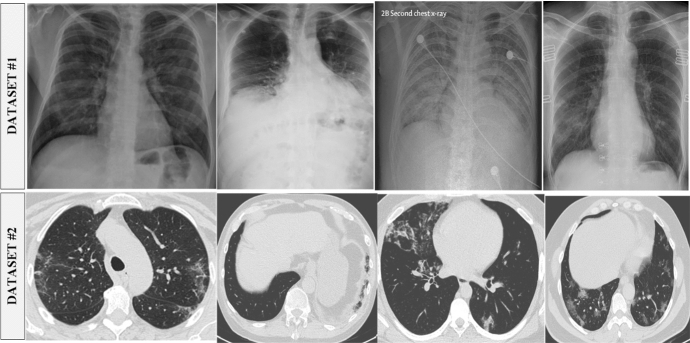
Several X-ray sources are obtained for this study. First, the Github repository is searched for datasets that are related to the medical (c) Italian Society of Medical and Interventional Radiology (imaging and Cohen's1 X-ray images dataset is selected. Furthermore, the websites of the (a) Radiological Society of North America (RSNA), (b) Radiopaedia, and SIRM) are thoroughly investigated. This collection can be seen on the kaggle2 repository. The dataset contains 245 radiographs with verified Covid-19 and 1401 images in normal conditions. Detection and classification of Covid-19 in CT and X-ray images is the goal of the suggested method. We used the Kaggle database to obtain a SARS-CoV-2 CT scan dataset.3 There is a total of 2390 CT scans in the dataset; 1229 of those scans show evidence of disease with SARS-CoV-2, whereas the other 1161 scans are negative. Males made up 34 of the Covid-19 cases, while females made up 28 of them. Figure 2 shows the chunks of images from both datasets.
Fig. 2.
A chunk of lung CT scans and chest X-rays of COVID19 cases
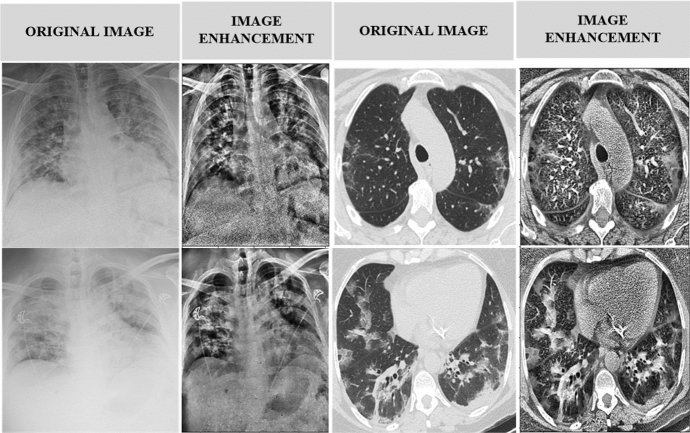
Image preprocessing is essential for producing high-quality results. Various approaches to improving medical images have been developed. The Contrast-Limited Adaptive Histogram Equalization (CLAHE) algorithm is created primarily to improve low-contrast medical images. The amplitude of CLAHE is limited by clipping the histogram at a user-defined value known as clip limit. The clipping level controls how much noise in the histogram is straightened and how much contrast is increased as a result. CLAHE is a color enhancement agent. To do so, we kept a clipping limit of 2.0 and a tile grid size of (8 × 8). First, we made a LAB image out of our RGB image. After that, we used the L channel using the CLAHE approach. The enhanced L channel is combined with the A and B channels to create an improved LAB image. The improved LAB image is then reconverted to the improved RGB image. Following that, because the images in the dataset had different resolutions, all of the images are resampled to (224 × 224 × 3). Normalizing each image is the final step. In Fig. 3, we can see some original CT scan images as well as their enhanced CT scan images using the CLAHE approach.
Fig. 3.
Image enhancement using contrast-limited adaptive histogram equalization
Feature extraction
The extraction of features is crucial in categorization. To extract features from a photograph, inefficient and time-consuming image processing techniques are applied. CNN is a fantastic solution for dealing with high-dimensional data such as photos and movies. However, in the proposed approach, rather than a direct image, we use the matrix formed by the handmade feature vectors as an input to the CNN network. The use of feature vectors of 1 × 1024 length reduces the training complexity of the CNN network significantly. To capture more significant features, the CNN network employs deeper dimension reduction. We employed a deep CNN to extract 350 prominent features from images, which would have been impossible to extract manually. Following four convolution layers, we used batch normalization and maximum pooling layers to achieve our desired results. Our model can correctly classify COVID19 images after about 100 iterations. Python's tensor flow (1.9) module is used to build the CNN network. The convolution layer filters first pass over the extracted features and then extract the best deep features from the convolution layer. The resulting collection of features from each filter is then integrated into a new feature space. To select the appropriate filter length and frequency, hyper-parameter tuning is used. As a result, each component receives the non-linear activation function, ReLU. Two convolution layers in the proposed CNN model use 64 and 128 filters, kernels of size four, and padding numbers equal to post the exact shape of the conclusion as the input shape. Typically, the max-pooling layer reduces the size of the feature space, the diversity of features, and the computation cost. In the proposed CNN layer, max-pooling layers pool two and one strides to build an image representation that incorporates the most essential characteristics from a preceding feature space. In addition, the proposed CNN model includes a classification layer with full connectivity. CNN overfitting is avoided using the Softmax function and dropout layers. Adam is employed as an optimizer and a dropout with a 0.50 probability during training to achieve more generic results. Finally, we applied the trained CNN model to our dataset, and it worked. The 350 most prominent elements of each image were chosen from the second-to-last thick layer, which had 100 neurons. Table 1 summarizes the CNN model that we developed.
Table 1.
Features extraction model summary
| Layer (type) | Output Shape | Parameters |
|---|---|---|
| conv2d_input (InputLayer) | (None, 224, 224, 3) | 0 |
| conv2d (Conv2D) | (None, 222, 222, 8) | 224 |
| batch_normalization | (None, 222, 222, 8) | 32 |
| activation (Activation) | (None, 222, 222, 8) | 0 |
| max_pooling2d (MaxPooling2D) | (None, 111, 111, 8) | 0 |
| conv2d_1 (Conv2D) | (None, 109, 109, 16) | 1168 |
| batch_normalization_1 | (None, 109, 109, 16) | 64 |
| activation_1 (Activation) | (None, 109, 109, 16) | 0 |
| max_pooling2d_1 (MaxPooling2) | (None, 54, 54, 16) | 0 |
| conv2d_2 (Conv2D) | (None, 52, 52, 32) | 4640 |
| batch_normalization_2 | (None, 52, 52, 32) | 128 |
| activation_2 (Activation) | (None, 52, 52, 32) | 0 |
| max_pooling2d_2 (MaxPooling2) | (None, 26, 26, 32) | 0 |
| conv2d_3 (Conv2D) | (None, 24, 24, 64) | 18,496 |
| batch_normalization_3 | (None, 24, 24, 64) | 256 |
| activation_3 (Activation) | (None, 24, 24, 64) | 0 |
| max_pooling2d_3 (MaxPooling2) | (None, 24, 24, 64) | 0 |
| flatten (Flatten) | (None, 9216) | 0 |
| dense (Dense) | (None, 128) | 1,179,776 |
| batch_normalization_4 | (None, 128) | 512 |
| activation_4 (Activation) | (None, 128) | 0 |
| dropout (Dropout) | (None, 128) | 0 |
| feature_dense (Dense) | (None, 100) | 12,900 |
| Total parameters: 1,218,196 | ||
| Trainable parameters: 1,217,700 | ||
| Non-trainable parameters: 496 |
Features mounting
The distinct characteristics of the data are kept within a standardized range by feature mounting. Data pre-processing use this technique to deal with the wide range of dimensions, values, and units that can be encountered. No matter what indicator is used, a machine learning algorithm will interpret larger values as bigger and lower values as fewer if feature scaling is not implemented. Gradient descent can be sped up by having a similar number of occurrences on the same scale. Feature normalization can be accomplished in several ways. Our models perform better because of the standard scaler technique we employed to standardize the features [37, 38].
COVID detection
Naive Bayes (NB) also known as the probabilistic algorithm is used to solve classification tasks. Naive Bayes is an easy-to-understand algorithm that performs well in many situations. According to Eq. 1, the Bayes theorem is used to build the classifier.
| 1 |
y indicates the class variable, while X indicates the characteristics or attributes. The numerator of that proportion is only of concern since the denominator somehow doesn't rely on y and the quantities of the characteristics Xi are specified, therefore the denominator is effectively constant. The numerator corresponds to the joint probabilistic function. Here, X is defined as (x1, x2, …, xn). As demonstrated in Equation 2, the Naive Bayes classifier assumes that attributes are unrelated.
| 2 |
A common assumption is that the continuous variables for each category reflect a Gaussian distribution when working with continual data sets. Consider that the training data contains a continual attribute, x. The data is first subdivided into classes, and then the mean and standard deviation of x is calculated for each of those categories. The conditional probability in Gaussian Naive Bayes derives from a normal distribution, as illustrated in Equation 3.
| 3 |
Support Vector Machine (SVM) is a supervised learning technique that can be used to solve problems like classification and regression. It accomplishes classification by locating the hyper-plane that best distinguishes the groups. By increasing the gap, it locates the hyper-plane. The kernel trick approach changes a non-separable task to a separable solution by transforming a low-dimensional input vector into a higher-dimensional one utilizing the kernel function. It's most useful when dealing with non-linear discrete tasks. As a kernel function, we utilized sigmoid. Calculating the SVM classifier's soft margin entails minimizing an expression of the form provided in Eq. 4.
| 4 |
Decision Tree (DT) is a data flow diagram with a tree structure in which each leaf node represents the decision, a branch reflects a decision rule, and an interior node represents a function or attribute. The root is placed at the very top of the tree. It usually segments based on the value of the attribute. Iterative segmentation is a method of repeatedly splitting the tree. This data flow diagram format may assist you in making judgments. It's a graphic representation of the human mind in the form of a flow chart. As a result, decision trees are easy to learn and understand. Decision Trees evaluate the division based on the purity of the generated nodes using loss functions. Equation 5 We used the entropy function to compute the impurity of the decision node as shown in Fig. 6.
| 5 |
Fig. 6.
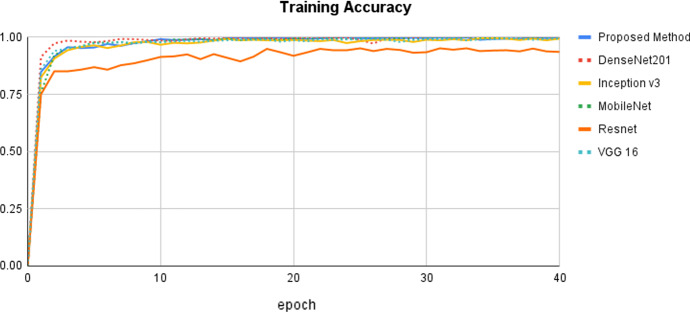
Comparison of the proposed method with state-of-the-art methods using training accuracy
The Entropy value ranges from 0 to 1. The lower the Entropy value, the purer the node. Only if the Entropy of the resulting nodes is less than that of the parent node can a split be made using Entropy as a loss function. Otherwise, the divide is not in the interest of the best local optimal [39].
Logistic Regression (LR) is a powerful technique for assessing binary outcomes (y = 0 or 1). LR is recommended over linear regression for identifying categorical outputs because it predicts continuous-valued outputs better. Equation 6 displays the logistic function in mathematical form.
| 6 |
Random Forest (RF) is an estimator that incorporates several different decision tree classifiers into its model to boost its predicting dominance and influence over-fitting. The "bagging" strategy, which produces a "forest" of trees, is frequently used to teach decision trees. The bagging strategy believes that combining many learning models can provide better results. It can handle the development of many decision trees during training and can generate output in-class mode or by aggregating predictions from each tree [40].
K-Nearest Neighbor (KNN) is a non-parametric, supervised learning classifier that uses proximity to create classifications or predictions about a set of individual observations. It can be used for both regression and classification problems, however, it is most typically utilized as a classification technique, based on the assumption that similar points can be found close together. It looks for the closest points to K and then uses the most votes mechanism in classification.
Ensemble is a robust model that is developed by integrating fundamental algorithms. It is a voting-based model that integrates forecasts from different models. It is a technique for improving predicting accuracy, to outperform any individual model in the group. A voting ensemble is a grouping of forecasts from several models. In classification, the estimates for each category are added together to predict the category with the most votes. Classification and regression issues that cannot be addressed by any of the individual models can be solved by the ensemble model. The suggested study employs the soft polling ensemble technique. To begin, we used training data to build the GNB, SVM, DT, LR, and RF basic models. The efficiency of our models is then evaluated using test data, with each model producing a unique prediction. The ensemble learning uses these algorithms' estimates as an additional insight to produce the final classification results [41]. Voting ensembles work best when many different fits of a model learned through random methods are put together. It also finds multiple models that fit with different hyperparameters. The proposed Covid detection strategy combines deep learning and machine learning-based methods. At first, the most prominent features of input CT scans and X-rays are extracted through the proposed CNN model. Later, these extracted features are classified through state-of-the-art machine learning classifiers (GNB, SVM, RF, LR, DT, and K-NN, etc.) and their learning ensemble. The output of these classifiers is interpreted as Covid or Non- Covid.
Experimental results
Performance indicators
The proposed ensemble learning model is trained on some CT scan images, which are referred to as training data. Following training, a subset of the dataset is used to test the model against unknown CT scan images. This unidentified data is also referred to as test data. As a result of the outcomes of these tests, we can evaluate the efficacy of our model. A total of 2482 CT scan images were prepared for training and testing purposes. We used the random split method to divide the dataset into training and testing sets. We used the standard training and testing ratios, i.e., 80%, and 20%, respectively. To quantify the machine learning algorithms, accuracy, precision, recall, and f1-score are used as a performance measures. If a patient is correctly classified as non-COVID19, the results will be a True Positive (TP), but if a patient is incorrectly classified as COVID19, the result will be a True Negative (TN), and a patient who was not infected with COVID19 is appropriately identified as such (NCOVID19). The equations for accuracy, precision, recall, and f-measure are given in 7, 8, 9, 10, and respectively.
| 7 |
| 8 |
| 9 |
| 10 |
Results analysis
The proposed research is tested with a range of elements employing cutting-edge approaches such as NB, SVM, DT, LR, RF, KNN, and ensemble, as shown in Table 2. We used dataset 1 to execute a feature selection method to get the best optimal features. We adjusted the parameters for 50, 100, 150, 200, 250, 300, 350, 400, 450, and 500 characteristics, in that order. (Table 3) With 350 features, it can be demonstrated that the methods performed well. The NB, SVM, DT, LR, RF, KNN, and our approach have classification accuracy of 0.97, 0.952, 0.956, 0.97, 0.97, 0.972, and 0.97, respectively. We selected 350 features from this research for the next step of COVID19 patient classification. We conducted thorough research by comparing state-of-the-art techniques with pre-trained models using various CNN parameter values. Various settings, such as the number of parameters and layers, are employed with the suggested approach, Inception v3, VGG16, Resnet, Mobilenet, and Densenet201, respectively. The number of parameters and layers for proposed method (1,218,196, 27), Inception v3 (22,007,684, 311), VGG16 (14,765,988, 19), Resnet (23,792,814, 175), Mobilenet (3,331,566, 87), and Densenet201 (18,514,084, 707), respectively. We employed standard performance measures including accuracy, f1-score, precision, recall, and prediction time. The proposed method with KNN worked well, with accuracy, f1-score, precision, recall, and prediction time of 0.972, 0.97, 0.97, 0.97, and 0.077, respectively. Similarly, Inception v3 with RF performs well, with precision, f1-score, precision, recall, and prediction time of 0.849, 0.78, 0.72, 0.85, and 0.017, respectively. The RF outperformed the other state-of-the-art methods tested, including Inception v3, VGG16, Resnet, Mobilenet, and Densenet201, while KNN works well with the proposed approach. This analysis goes into great detail about the best number of parameters, a number of layers, and state-of-the-art method to use in conjunction with the proposed methodology.
Table 2.
Optimum features selection
| DATASET-1 | ||||||||||
|---|---|---|---|---|---|---|---|---|---|---|
| Classifier | Features | |||||||||
| 50 | 100 | 150 | 200 | 250 | 300 | 350 | 400 | 450 | 500 | |
| NB | 0.957 | 0.967 | 0.968 | 0.938 | 0.964 | 0.952 | 0.97 | 0.965 | 0.944 | 0.967 |
| SVM | 0.874 | 0.901 | 0.928 | 0.901 | 0.945 | 0.923 | 0.952 | 0.945 | 0.951 | 0.967 |
| DT | 0.952 | 0.961 | 0.953 | 0.958 | 0.948 | 0.935 | 0.956 | 0.945 | 0.947 | 0.956 |
| LR | 0.958 | 0.965 | 0.974 | 0.965 | 0.965 | 0.967 | 0.97 | 0.957 | 0.962 | 0.965 |
| RF | 0.962 | 0.97 | 0.965 | 0.958 | 0.963 | 0.961 | 0.97 | 0.963 | 0.961 | 0.965 |
| KNN | 0.964 | 0.967 | 0.965 | 0.965 | 0.962 | 0.972 | 0.972 | 0.964 | 0.967 | 0.965 |
| Ensemble | 0.962 | 0.968 | 0.967 | 0.959 | 0.963 | 0.965 | 0.97 | 0.964 | 0.965 | 0.965 |
The bold values denote the most important features chosen for the proposed approach
Table 3.
Comparison with different CNN
| DATASET-1 | ||||||||
|---|---|---|---|---|---|---|---|---|
| Model | Parameters | No. Layers | Classifier | Accuracy | F1-Score | Precision | Recall | Pred: Time |
| Proposed Method | 1,218,196 | 27 | NB | 0.97 | 0.97 | 0.97 | 0.97 | 0.0069 |
| SVM | 0.952 | 0.95 | 0.96 | 0.95 | 0.0069 | |||
| DT | 0.956 | 0.96 | 0.96 | 0.96 | 0.0019 | |||
| LR | 0.97 | 0.97 | 0.97 | 0.97 | 0.00199 | |||
| RF | 0.97 | 0.97 | 0.97 | 0.97 | 0.0189 | |||
| KNN | 0.972 | 0.97 | 0.97 | 0.97 | 0.077 | |||
| Ensemble | 0.97 | 0.97 | 0.97 | 0.97 | 0.0688 | |||
|
Inception v3 (Pre-Trained) |
22,007,684 | 311 | NB | 0.182 | 0.12 | 0.68 | 0.18 | 0.0019 |
| SVM | 0.789 | 0.77 | 0.75 | 0.79 | 0.0109 | |||
| DT | 0.739 | 0.74 | 0.74 | 0.74 | 0.0009 | |||
| LR | 0.848 | 0.78 | 0.72 | 0.85 | 0.00099 | |||
| RF | 0.849 | 0.78 | 0.72 | 0.85 | 0.017 | |||
| KNN | 0.8323 | 0.77 | 0.73 | 0.83 | 0.0747 | |||
| Ensemble | 0.829 | 0.77 | 0.72 | 0.83 | 0.0466 | |||
|
VGG16 (Pre-Trained) |
14,765,988 | 19 | NB | 0.255 | 0.26 | 0.72 | 0.26 | 0.00099 |
| SVM | 0.829 | 0.79 | 0.77 | 0.83 | 0.0109 | |||
| DT | 0.738 | 0.75 | 0.76 | 0.74 | 0.00099 | |||
| LR | 0.8359 | 0.78 | 0.75 | 0.84 | 0.00099 | |||
| RF | 0.85 | 0.78 | 0.8 | 0.85 | 0.0189 | |||
| KNN | 0.828 | 0.77 | 0.74 | 0.83 | 0.075 | |||
| Ensemble | 0.84 | 0.78 | 0.76 | 0.84 | 0.047 | |||
|
ResNet (Pre-Trained) |
23,792,814 | 175 | NB | 0.84 | 0.78 | 0.72 | 0.84 | 0.0019 |
| SVM | 0.809 | 0.78 | 0.75 | 0.81 | 0.0109 | |||
| DT | 0.744 | 0.75 | 0.76 | 0.74 | 0.00099 | |||
| LR | 0.8493 | 0.78 | 0.72 | 0.85 | 0.00099 | |||
| RF | 0.851 | 0.78 | 0.87 | 0.85 | 0.0179 | |||
| KNN | 0.8396 | 0.78 | 0.74 | 0.84 | 0.068 | |||
| Ensemble | 0.85 | 0.78 | 0.72 | 0.85 | 0.045 | |||
|
Mobile Net (Pre-Trained) |
3,331,566 | 87 | NB | 0.15 | 0.05 | 0.51 | 0.15 | 0.00099 |
| SVM | 0.809 | 0.77 | 0.74 | 0.81 | 0.0109 | |||
| DT | 0.701 | 0.72 | 0.75 | 0.7 | 0.0009 | |||
| LR | 0.85 | 0.78 | 0.8 | 0.85 | 0.0009 | |||
| RF | 0.85 | 0.78 | 0.72 | 0.85 | 0.0179 | |||
| KNN | 0.831 | 0.78 | 0.74 | 0.83 | 0.075 | |||
| Ensemble | 0.831 | 0.78 | 0.74 | 0.83 | 0.043 | |||
|
Densenet201 (Pre-Trained) |
18,514,084 | 707 | NB | 0.165 | 0.08 | 0.71 | 0.17 | 0.00199 |
| SVM | 0.818 | 0.77 | 0.73 | 0.82 | 0.0099 | |||
| DT | 0.727 | 0.74 | 0.75 | 0.73 | 0.00099 | |||
| LR | 0.844 | 0.78 | 0.72 | 0.84 | 0.00099 | |||
| RF | 0.85 | 0.78 | 0.72 | 0.85 | 0.017 | |||
| KNN | 0.827 | 0.77 | 0.73 | 0.83 | 0.0708 | |||
| Ensemble | 0.8371 | 0.78 | 0.73 | 0.84 | 0.05 | |||
The bold values indicate that these methods produce the best classification results when compared to other methods
As shown in Table 4, we used two datasets to conduct a thorough investigation of the proposed method and demonstrate its class-wise performance. To show the classification of each class, including COVID and non-COVID, standard performance metrics such as precision, recall, f1-measure, and accuracy are used. The first dataset contains 245 COVID images and 1401 non-COVID images. The second dataset contains 1252 images for COVID patients and 1229 images for non-COVID patients. In dataset 1, the major class, non-COVID, has a higher classification rate than the minor class, non-COVID. As a result, the suggested model learns more training instances for the major class. In dataset 2, however, the classification rates for both classes are strikingly similar. The reason for this is that both classes have about equal numbers of images, and the model learns them equally. The overall performance for both datasets using precision, recall, f1-score, accuracy are (0.97, 0.99), (0.97, 0.99), (0.97, 0.99), and (0.972, 0.985), respectively.
Table 4.
Class wise performance
| Classes | Total | Precision | Recall | F1-measure |
|---|---|---|---|---|
| Dataset-1 | ||||
| COVID | 245 | 0.92 | 0.89 | 0.9 |
| Non-COVID | 1401 | 0.98 | 0.99 | 0.98 |
| Average | 0.97 | 0.97 | 0.97 | |
| Dataset-2 | ||||
| COVID | 1252 | 0.97 | 0.93 | 0.95 |
| Non-COVID | 1229 | 0.99 | 0.99 | 0.99 |
| Average | 0.99 | 0.99 | 0.99 | |
| Dataset | Precision | Recall | F1-Score | Accuracy |
|---|---|---|---|---|
| Overall performance | ||||
| Dataset-1 | 0.97 | 0.97 | 0.97 | 0.972 |
| Dataset-2 | 0.99 | 0.99 | 0.99 | 0.985 |
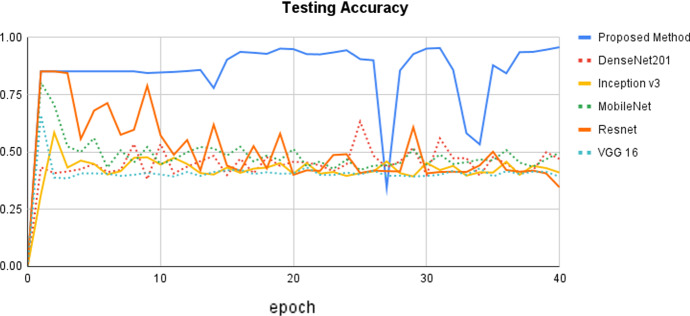
The epoch curve can be used to examine the dynamic behavior of accuracy and loss values. This allows us to readily assess the distinct patterns of the classification values and overfitting. To demonstrate the effectiveness of the proposed approach, the accuracy and loss epoch curves for training and testing data are examined. The proposed method is compared to state-of-the-art methods using various CNN settings, and the testing accuracy epoch curve is depicted in Fig. 4. The epoch values are displayed on the x-axis, while the matching accuracy values are displayed on the y-axis. It can be observed that the accuracy epoch curve begins at 0% and increases to 82% before remaining rather consistent until the 24th epoch. In the 15th epoch, there is a modest increase to 98%. On epoch 27th, there is a reduction in accuracy of up to 30%, followed by an increase. Overall, the proposed method acts within the range of 0% to 99%. Following that, the Resnet model provides better accuracy, with values ranging from 0 to 85%, respectively. The remaining state-of-the-art methods perform similarly within the range of 0% to 80%, respectively. Overall, the proposed outperformed as compared to the other state-of-the-art methods with different settings of hyper-parameters.
Fig. 4.
Comparison of the proposed method with state-of-the-art methods using testing accuracy
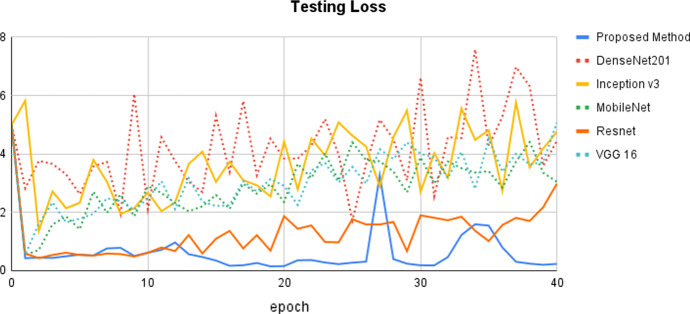
Figure 5 depicts the testing loss epoch curves for the proposed model and state-of-the-art approaches. DenseNet201 exhibits the highest loss, with values ranging from 50 to 70%. To some extent, the curve rises and falls in between. The proposed method has the lowest testing loss, indicating that it produces the best classification results. The testing loss curve begins at 5% and gradually decreases to 5%. After that, it behaved rather consistently until the 26th epoch. In the 27th epoch, there is a dramatic increase of up to 30%, followed by a drop of up to 2%. Overall, it acts within a range of 0% to 30%, which is the best-estimated loss when compared to other state-of-the-art approaches. Resnet is the next better model that provides reduced testing loss, demonstrating that it can deliver better classification results after our proposed method. The remaining methods, including Inception v3, MobileNet, Resnet, and VGG16, produce more or less similar results.
Fig. 5.
Comparison of the proposed method with state-of-the-art methods using testing loss
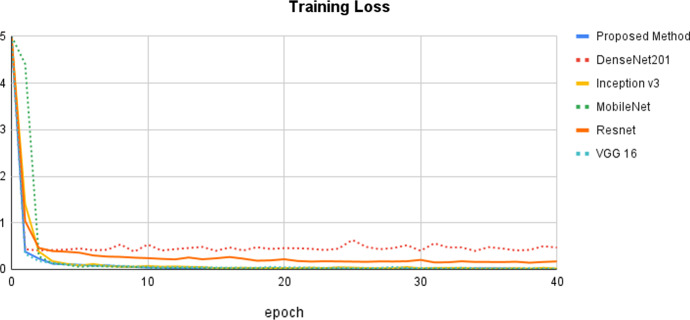
Figure 6 depicts the training accuracy epoch curve for the proposed approach vs state-of-the-art methods. The proposed method's epoch curve begins at 0% and gradually grows to 80% on the 5th epoch. After that, it bends up to a point and then grows to 99% in the 10th epoch. Following that, this curve is more or less stable until the 40th epoch. The DenNet201 approach performs in the 0 to 97%, which is the next best model based on training accuracy. When compared to other methods, the Resnet method performs the worst. Figure 7 depicts the proposed training loss values together with a comparison of the state-of-the-art methods. It has once again been demonstrated that our strategy results in the least amount of training loss when compared to the other methods.
Fig. 7.
Comparison of the proposed method with state-of-the-art methods using training loss
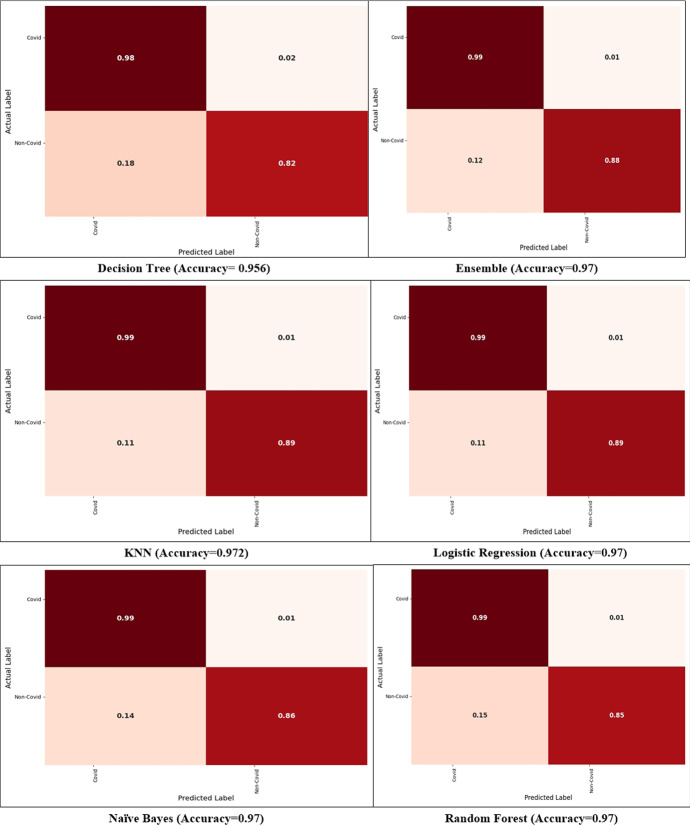
A confusion matrix is a useful tool for showing classification and miss classification for each class. Figure 8 compares the proposed ensemble model's confusion matrices to those of previous approaches that can demonstrate class-wise classification. The diagonal values represent the correct classification, whereas the off-diagonal values represent the incorrect classification. For COVID and non-COVID, the ensemble model provides classification and miss classification values of (99%, 1%), (88%, 12%), respectively. Similarly, the DT method provides the classification and miss classification for COVID and non-COVID classes (98%, 2%), and (82%, 18%), respectively. Next, the LR method provides the classification and miss classification for both classes as (99%, 1%), (89%, 11%), respectively.
Fig. 8.
Confusion matrices for COVID and non-COVID classes
Table 5 demonstrates the classification measures of the proposed approach with two different datasets, including accuracy, f1-score, precision, and recall. As can be observed, the dataset contains a total of 1,646 CT scan images, while dataset2 contains 2481 CT scan images. Using dataset 1, the ensemble with the KNN model delivers the best classification metrics of 0.972, 0.97, 0.97, and 0.97, respectively, for accuracy, f1-score, precision, and recall. With dataset 2, the ensemble approach LR method provides the best performance measures. The accuracy, f1-score, precision, and recall have 0.985, 0.99, 0.99, 0.99, respectively. Dataset 2 has more CT scan images due to which the classifier learns the instances more in training time. Due to this, the proposed approach provides better classification results using dataset 2.
Table 5.
Classification measures with different datasets
| Model | Classifier | Total | Accuracy | F1-Score | Precision | Recall |
|---|---|---|---|---|---|---|
| Dataset-1 | NB | 1,646 | 0.97 | 0.97 | 0.97 | 0.97 |
| SVM | 0.952 | 0.95 | 0.96 | 0.95 | ||
| DT | 0.956 | 0.96 | 0.96 | 0.96 | ||
| LR | 0.97 | 0.97 | 0.97 | 0.97 | ||
| RF | 0.97 | 0.97 | 0.97 | 0.97 | ||
| KNN | 0.972 | 0.97 | 0.97 | 0.97 | ||
| Ensemble | 0.97 | 0.97 | 0.97 | 0.97 | ||
| Dataset-2 | NB | 2,481 | 0.981 | 0.98 | 0.98 | 0.98 |
| SVM | 0.945 | 0.95 | 0.95 | 0.95 | ||
| DT | 0.97 | 0.97 | 0.97 | 0.97 | ||
| LR | 0.985 | 0.99 | 0.99 | 0.99 | ||
| RF | 0.98 | 0.98 | 0.98 | 0.98 | ||
| KNN | 0.981 | 0.98 | 0.98 | 0.98 | ||
| Ensemble | 0.982 | 0.98 | 0.98 | 0.98 |
The bold values indicate that these methods produce the best classification results when compared to other methods
Performance comparison with previous works
Table 6 shows the performance comparison of the proposed approach with previously published works. Jaiswal et al. [31] used DenseNet-121 model to medical image classification and achieved the performance measures values (precision, recall, f1-score, accuracy), (96.29%, 96.29%, 96.29%, 96.25%), respectively. Silva et al. [32] developed the voting-based approach for the COVID and non-COVID classification. The classification accuracy of this approach is 87.68%. Alshazly et al. [42] used a series of different methods such as Deep CNNs, GoogleNet, AlexNet, ResNet, VGG-16, and xDNN, respectively. Using Deep CNNs, it provides performance measures (precision, f1-score, and accuracy) of (99.6%, 66.4%, 96.29%, and 99.4%, respectively). Following that, GoogleNet gives performance measures (precision, recall, f1-score, and accuracy), which are (90.2%, 93.5%, 91.82%, and 91.73%, respectively). This method outperforms the Resnet and VGG-16 approaches. When compared to previously published research, the proposed ensemble method outperforms and achieves the highest performance measures values. For example, using our method, the (precision, recall, f1-score, accuracy) are (99.5%, 99.5%, 99.5%, 98.5%), respectively.
Table 6.
Performance comparison of the proposed approach with previously published works
| Research works | Model | Precision (%) | Recall (%) | F1-measure (%) | Accuracy (%) |
|---|---|---|---|---|---|
| Jaiswal et al. [31] | DenseNet-121 | 96.29 | 96.29 | 96.29 | 96.25 |
| Silva et al. [32] | Voting based Approach | NS | NS | NS | 87.68 |
| Alshazly et al. [42] | Deep CNNs | 99.6 | NS | 66.4 | 99.4 |
| Angelov et al. [43] | GoogleNet | 90.2 | 93.5 | 91.82 | 91.73 |
| Angelov et al. [43] | AlexNet | 94.98 | 92.28 | 93.61 | 93.75 |
| Angelov et al. [43] | ResNet | 93 | 97.15 | 95.03 | 94.96 |
| Angelov et al. [43] | VGG-16 | 94.02 | 95.43 | 94.97 | 94.96 |
| Angelov et al. [43] | xDNN | 99.16 | 95.53 | 97.31 | 97.38 |
| Proposed work | Ensemble method | 99 | 99 | 99 | 98.5 |
Performance validation with explainable artificial intelligence and t-SNE
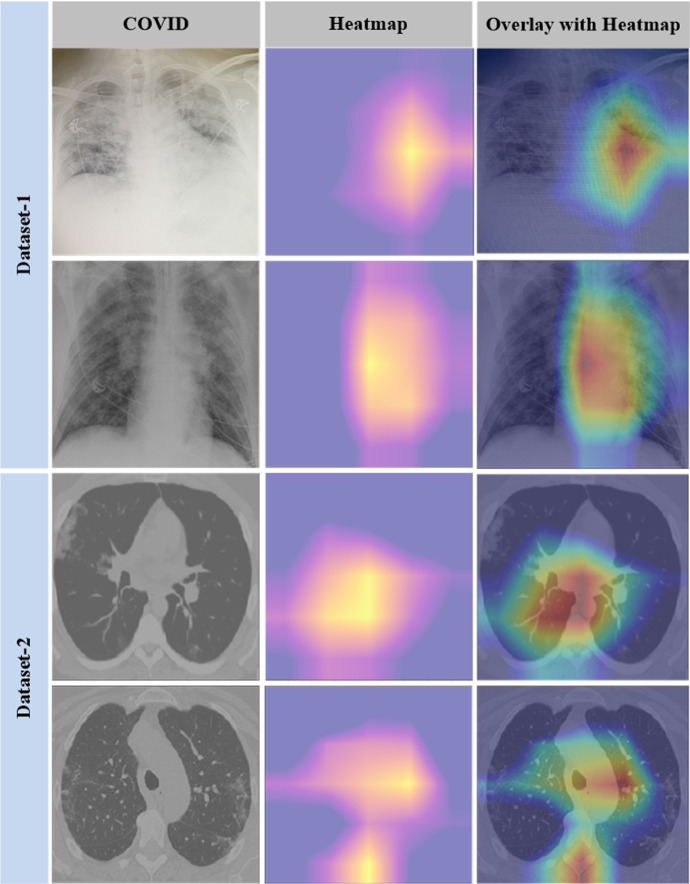
To validate the suggested approach, two important experiments are carried out: explainable AI and t-SNE visualization. To obtain more accurate findings, we used the Gradient-weighted Class Activation Mapping (Grad-CAM) approach to select the model's most valuable portions of the image. As a result, the radiologist can gain insight into areas of the CT scan or X-ray that are symptomatic of a specific diagnosis. We also generated a cumulative heatmap to assist radiologists and other medical professionals in better understanding the classifier's findings. A medical analyst can get rapid insight into the model's performance by using the cumulative heatmap, which provides a visual representation of the model's performance [44]. Medical professionals can debug models using automated heat map analysis without having any prior knowledge of the problem or trends. It allows them to make better use of Grad-CAM. The steps of the suggested COVID detection model's interpretability are as follows:
HEATMAP: The heatmap produced by integrated gradients is a well-known explainable AI approach for deep neural networks. It indicates which pixels are most important for prediction. It would allow an expert to examine the machine's pixels used to determine the exact disease to clinical features. The model identifies a subset of the samples in the test dataset according to their attributes. Grad-CAM is utilized during the inference phase to determine which regions of an image are most competitive for classification. Each sample within this selection is displayed as a heatmap.
CUMULATIVE HEATMAP: The average value for each pixel is calculated to generate cumulative heatmaps. By doing so, we get a single heatmap that symbolizes the "unique characteristics" of that specific group. This can help us to study the huge number of pixels for a specific disease with less time and effort.
Figure 9 contrasts the original images from two distinct COVID datasets, the heatmap created by the Grad-CAM, and the relevance of the regions on the original image as determined by projecting the heatmap. The cumulative heatmaps are created by layering all heatmaps of the same family and averaging each pixel to create a new image. The final output is a single image that contains information regarding the inferences drawn for a whole COVID family.
Fig. 9.
The first column refers to the original image; the second column refers to the heat map and the third column refers superimposed image
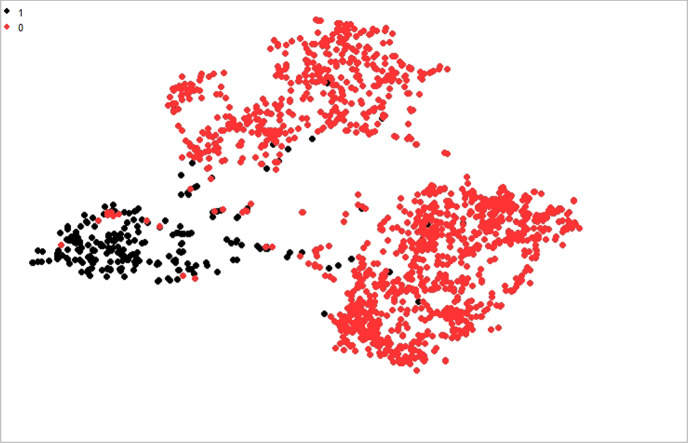
The t-SNE visualization approach is used to determine whether the features have a lot or a little information. Furthermore, the t-SNE algorithm is evaluated to validate the efficacy of the proposed strategy. Figure 10 displays the COVID and non-COVID separation levels in dataset 1 with a perplexity value of 35. COVID19 ( +) is shown by class 1 in red, and COVID19 (−) is indicated by class 0 in black. The experiment is run with numerous perplexity levels, with 35 producing the best visualization results. In the first test, we got close to attaining the lowest achievable perplexity value for distinguishing COVID19 ( +) from non-COVID19 (−) clusters. Iterations are used by t-SNE to discriminate between different sorts of samples. To show the separate clusters of COVID19 ( +) and COVID19 (−), 700 iterations with different perplexity values are used. The COVID (−) cluster is larger than the COVID ( +) cluster, indicating that this class includes more training instances than the other. There are several instances where the red color is nearly identical to the black color. This may signal an outlier that can have an impact on the overall results. Despite this, the majority of the visualization demonstrates the exact separation, proving that the dataset can be simply classified with optimal classification results. The density of the dataset has a substantial effect on the accuracy of predictions. The higher density allows for more precise classifications because it supplies more descriptive training data. The separation between the t-SNE clusters has increased, hence enhancing classifier performance. A dataset can be partitioned and classified using the appropriate perplexity value and hyper-parameters, as shown in Tables 2–5, in the classification results of the proposed ensemble model.
Fig. 10.
Two-dimensional feature visualization of the proposed model on the COVID19 dataset
Conclusion
Because of population growth, disease monitoring has become a big burden in the healthcare system, therefore auto-detection has become a primary priority. Intelligent disease detection frameworks can help doctors to diagnose infections. It can provide robust, and high accuracy, with lower mortality rates. COVID19, a sudden and deadly disease, has burst into a global health disaster. The quickest way to stop Covid19 from spreading is to develop an automatic detection method. An explainable COVID19 detection method is proposed to detect early infections through CT scans and chest X-rays. It uses a combination of deep learning and machine learning classification methods to achieve high classification accuracy. The CNN model is designed to retrieve 350 important features. Following that, these features are fed into several classification methods such as GNB, SVM, DT, LR, and RF. Aft an ensemble method for COVID19 CT image classification is shown. The proposed technique is tested on two datasets containing 1,646 and 2,481 CT scan images from COVID19 patients, respectively. Furthermore, various performance comparisons versus cutting-edge approaches are provided. The proposed strategy is also validated using t-SNE and explainable AI tests.
In the future, different ensemble methods, such as stacking and bagging, can be designed to enhance the importance of the proposed research. Cross-validation using deep neural networks could be employed in future research to achieve multiple folds of training and test data. It can help with issues like overfitting and class imbalance, but it can also raise the cost of computation. Furthermore, while the current work focuses on COVID19 infection, it can be applied to other infections in the future.
Data availability
The proposed research used three standard datasets which are publically available. These datasets are (1) GitHub repository, Italian Society of Medical and Interventional Radiology (imaging and Cohen's X-ray images dataset (https://github.com/ieee8023/covid-chestxray-dataset/). (2) Kaggle repository, Radiological Society of North America (https://www.kaggle.com/datasets/andrewmvd/convid19-x-rays). (3) The SARS-CoV-2 CT scan dataset (https://www.kaggle.com/datasets/plameneduardo/sarscov2-ctscan-dataset).
Footnotes
Publisher's Note
Springer Nature remains neutral with regard to jurisdictional claims in published maps and institutional affiliations.
Farhan Ullah and Hamad Naeem contributed equally to this work.
Contributor Information
Farhan Ullah, Email: farhankhan.cs@yahoo.com.
Jihoon Moon, Email: johnny89@cau.ac.kr.
Hamad Naeem, Email: hamadnaeemh@yahoo.com.
Sohail Jabbar, Email: sjabbar.research@gmail.com.
References
- 1.Ethiopia Coronavirus (2020) 13,968 Cases and 223 Deaths, vol 27. Accessed on https://www.worldometers.info/coronavirus/country/ethiopia
- 2.Ciotti M, Ciccozzi M, Terrinoni A, Jiang W-C, Wang C-B, Bernardini S. The COVID-19 pandemic. Crit Rev Clin Lab Sci. 2020;57:365–388. doi: 10.1080/10408363.2020.1783198. [DOI] [PubMed] [Google Scholar]
- 3.Naeem H, Bin-Salem AA. A CNN-LSTM network with multi-level feature extraction-based approach for automated detection of coronavirus from CT scan and X-ray images. Appl Soft Comput. 2021;113:107918. doi: 10.1016/j.asoc.2021.107918. [DOI] [PMC free article] [PubMed] [Google Scholar]
- 4.Culp W (2020) Coronavirus disease 2019. A & A Practice, 14 (6), e01218," ed, 2020. [DOI] [PMC free article] [PubMed]
- 5.Tahamtan A, Ardebili A. Real-time RT-PCR in COVID-19 detection: issues affecting the results. Expert Rev Mol Diagn. 2020;20:453–454. doi: 10.1080/14737159.2020.1757437. [DOI] [PMC free article] [PubMed] [Google Scholar]
- 6.Chen S-G, Chen J-Y, Yang Y-P, Chien C-S, Wang M-L, Lin L-T. Use of radiographic features in COVID-19 diagnosis: challenges and perspectives. J Chin Med Assoc. 2020;83:644. doi: 10.1097/JCMA.0000000000000336. [DOI] [PMC free article] [PubMed] [Google Scholar]
- 7.Kumar K, Kumar N, Shah R. Role of IoT to avoid spreading of COVID-19. Int J Intell Net. 2020;1:32–35. [Google Scholar]
- 8.Haider KZ, Malik KR, Khalid S, Nawaz T, Jabbar S. Deepgender: real-time gender classification using deep learning for smartphones. J Real-Time Image Proc. 2019;16:15–29. doi: 10.1007/s11554-017-0714-3. [DOI] [Google Scholar]
- 9.Kalsoom A, Maqsood M, Yasmin S, Bukhari M, Shin Z, Rho S (2022) A computer-aided diagnostic system for liver tumor detection using modified U-Net architecture. J Supercomput 78(7):1–23
- 10.Ye Z, Zhang Y, Wang Y, Huang Z, Song B. Chest CT manifestations of new coronavirus disease 2019 (COVID-19): a pictorial review. Eur Radiol. 2020;30:4381–4389. doi: 10.1007/s00330-020-06801-0. [DOI] [PMC free article] [PubMed] [Google Scholar]
- 11.Islam MR, Nahiduzzaman M. Complex features extraction with deep learning model for the detection of COVID19 from CT scan images using ensemble based machine learning approach. Expert Syst Appl. 2022;195:116554. doi: 10.1016/j.eswa.2022.116554. [DOI] [PMC free article] [PubMed] [Google Scholar]
- 12.Saygılı A. A new approach for computer-aided detection of coronavirus (COVID-19) from CT and X-ray images using machine learning methods. Appl Soft Comput. 2021;105:107323. doi: 10.1016/j.asoc.2021.107323. [DOI] [PMC free article] [PubMed] [Google Scholar]
- 13.Kassania SH, Kassanib PH, Wesolowskic MJ, Schneidera KA, Detersa R. Automatic detection of coronavirus disease (COVID-19) in X-ray and CT images: a machine learning based approach. Biocybernetics and Biomedical Engineering. 2021;41:867–879. doi: 10.1016/j.bbe.2021.05.013. [DOI] [PMC free article] [PubMed] [Google Scholar]
- 14.Kassani SH, Kassani PH, Khazaeinezhad R, Wesolowski MJ, Schneider KA, Deters R. "Diabetic retinopathy classification using a modified xception architecture," in. IEEE Int Symposium Sig Process Inform Technol (ISSPIT) 2019;2019:1–6. [Google Scholar]
- 15.Ullah F, Habib MA, Farhan M, Khalid S, Durrani MY, Jabbar S. Semantic interoperability for big-data in heterogeneous IoT infrastructure for healthcare. Sustain Cities Soc. 2017;34:90–96. doi: 10.1016/j.scs.2017.06.010. [DOI] [Google Scholar]
- 16.Esteva A, Chou K, Yeung S, Naik N, Madani A, Mottaghi A, et al. Deep learning-enabled medical computer vision. NPJ Digital Med. 2021;4:1–9. doi: 10.1038/s41746-020-00376-2. [DOI] [PMC free article] [PubMed] [Google Scholar]
- 17.Esteva A, Robicquet A, Ramsundar B, Kuleshov V, DePristo M, Chou K, et al. A guide to deep learning in healthcare. Nat Med. 2019;25:24–29. doi: 10.1038/s41591-018-0316-z. [DOI] [PubMed] [Google Scholar]
- 18.Gandhi DA, Ghosal M (2018) Intelligent healthcare using IoT: a extensive Survey In 2018 Second International Conference On Inventive Communication And Computational Technologies (ICICCT), 2018, pp. 800–802.
- 19.Lan Z-C, Huang G-Y, Li Y-P, Rho S, Vimal S, Chen B-W. Conquering insufficient/imbalanced data learning for the Internet of Medical Things. Neu Comput Appl. 2022;8:1–10. [Google Scholar]
- 20.Shah V, Keniya R, Shridharani A, Punjabi M, Shah J, Mehendale N. Diagnosis of COVID-19 using CT scan images and deep learning techniques. Emerg Radiol. 2021;28:497–505. doi: 10.1007/s10140-020-01886-y. [DOI] [PMC free article] [PubMed] [Google Scholar]
- 21.Guo Y, Gao Y, Shen D. Deformable MR prostate segmentation via deep feature learning and sparse patch matching. IEEE Trans Med Imaging. 2015;35:1077–1089. doi: 10.1109/TMI.2015.2508280. [DOI] [PMC free article] [PubMed] [Google Scholar]
- 22.Basu A, Mullick SS, Das S, Das S. Do Pre-processing and Class Imbalance Matter to the Deep Image Classifiers for COVID-19 Detection An Explainable Analysis. IEEE Trans Artif Intell. 2022;2:1. doi: 10.1109/TAI.2022.3149971. [DOI] [Google Scholar]
- 23.Sarker L, Islam MM, Hannan T, Ahmed Z (2020) COVID-DenseNet: A deep learning architecture to detect COVID-19 from chest radiology images. Preprint, 2020050151
- 24.F Shan, Y Gao, J Wang, W Shi, N Shi, M Han et al (2020) Lung infection quantification of COVID-19 in CT images with deep learning," arXiv preprint arXiv:2003.04655.
- 25.Zhang J, Xie Y, Li Y, Shen C, Xia Y (2020) Covid-19 screening on chest x-ray images using deep learning based anomaly detection. arXiv preprint arXiv:2003.12338, vol. 27, 2020.
- 26.Wang S, Zha Y, Li W, Wu Q, Li X, Niu M, et al. A fully automatic deep learning system for COVID-19 diagnostic and prognostic analysis. European Respiratory J. 2020;56:20600. doi: 10.1183/13993003.00775-2020. [DOI] [PMC free article] [PubMed] [Google Scholar]
- 27.Otoom M, Otoum N, Alzubaidi MA, Etoom Y, Banihani R. An IoT-based framework for early identification and monitoring of COVID-19 cases. Biomed Signal Process Control. 2020;62:102149. doi: 10.1016/j.bspc.2020.102149. [DOI] [PMC free article] [PubMed] [Google Scholar]
- 28.Ahmed I, Ahmad A, Jeon G. An IoT-based deep learning framework for early assessment of COVID-19. IEEE Internet Things J. 2020;8:15855–15862. doi: 10.1109/JIOT.2020.3034074. [DOI] [PMC free article] [PubMed] [Google Scholar]
- 29.Rohila VS, Gupta N, Kaul A, Sharma DK. Deep learning assisted COVID-19 detection using full CT-scans. Internet of Things. 2021;14:100377. doi: 10.1016/j.iot.2021.100377. [DOI] [PMC free article] [PubMed] [Google Scholar]
- 30.Hemdan EED, Shouman MA, Karar ME (2020) "Covidx-net: A framework of deep learning classifiers to diagnose covid-19 in x-ray images." arXiv preprint arXiv:2003.11055.
- 31.Jaiswal A, Gianchandani N, Singh D, Kumar V, Kaur M. Classification of the COVID-19 infected patients using DenseNet201 based deep transfer learning. J Biomol Struct Dyn. 2021;39:5682–5689. doi: 10.1080/07391102.2020.1788642. [DOI] [PubMed] [Google Scholar]
- 32.Silva P, Luz E, Silva G, Moreira G, Silva R, Lucio D, et al. COVID-19 detection in CT images with deep learning: a voting-based scheme and cross-datasets analysis. Inform Med Unlocked. 2020;20:100427. doi: 10.1016/j.imu.2020.100427. [DOI] [PMC free article] [PubMed] [Google Scholar]
- 33.Syed HH, Khan MA, Tariq U, Armghan A, Alenezi F, Khan JA, et al. A Rapid artificial intelligence-based computer-aided diagnosis system for COVID-19 classification from CT images. Behav Neuro. 2021;2021:1. doi: 10.1155/2021/2560388. [DOI] [PMC free article] [PubMed] [Google Scholar] [Retracted]
- 34.Durrani MY, Yasmin S, Rho S. An internet of medical things based liver tumor detection system using semantic segmentation. J Int Technol. 2022;23:163–175. [Google Scholar]
- 35.Guo Z, Li X, Huang H, Guo N, Li Q. Deep learning-based image segmentation on multimodal medical imaging. IEEE Trans Radiation Plasma Med Sci. 2019;3:162–169. doi: 10.1109/TRPMS.2018.2890359. [DOI] [PMC free article] [PubMed] [Google Scholar]
- 36.Khalid S, Sajjad S, Jabbar S, Chang H. Accurate and efficient shape matching approach using vocabularies of multi-feature space representations. J Real-Time Image Proc. 2017;13:449–465. doi: 10.1007/s11554-015-0545-z. [DOI] [Google Scholar]
- 37.Hu Y, Niu D, Yang J, Zhou S (2019) FDML: A collaborative machine learning framework for distributed features in proceedings of the 25th ACM SIGKDD International Conference on Knowledge Discovery & Data Mining, 2019, pp. 2232–2240.
- 38.Nawaz H, Maqsood M, Afzal S, Aadil F, Mehmood I, Rho S. A deep feature-based real-time system for Alzheimer disease stage detection. Multimedia Tool Appl. 2021;80:35789–35807. doi: 10.1007/s11042-020-09087-y. [DOI] [Google Scholar]
- 39.Guermazi R, Chaabane I, Hammami M. AECID: Asymmetric entropy for classifying imbalanced data. Inf Sci. 2018;467:373–397. doi: 10.1016/j.ins.2018.07.076. [DOI] [Google Scholar]
- 40.Khalilia M, Chakraborty S, Popescu M. Predicting disease risks from highly imbalanced data using random forest. BMC Med Inform Decis Mak. 2011;11:1–13. doi: 10.1186/1472-6947-11-51. [DOI] [PMC free article] [PubMed] [Google Scholar]
- 41.Sagi O, Rokach L. Ensemble learning: A survey. Wiley Interdisciplinary Reviews: Data Mining and Knowledge Discovery. 2018;8:e1249. [Google Scholar]
- 42.Alshazly H, Linse C, Barth E, Martinetz T. Explainable COVID-19 detection using chest CT scans and deep learning. Sensors. 2021;21:455. doi: 10.3390/s21020455. [DOI] [PMC free article] [PubMed] [Google Scholar]
- 43.Angelov P, Almeida Soares E (2020) "SARS-CoV-2 CT-scan dataset: A large dataset of real patients CT scans for SARS-CoV-2 identification," MedRxiv
- 44.Hossain MS, Muhammad G, Guizani N. Explainable AI and mass surveillance system-based healthcare framework to combat COVID-I9 like pandemics. IEEE Network. 2020;34:126–132. doi: 10.1109/MNET.011.2000458. [DOI] [Google Scholar]
Associated Data
This section collects any data citations, data availability statements, or supplementary materials included in this article.
Data Availability Statement
The proposed research used three standard datasets which are publically available. These datasets are (1) GitHub repository, Italian Society of Medical and Interventional Radiology (imaging and Cohen's X-ray images dataset (https://github.com/ieee8023/covid-chestxray-dataset/). (2) Kaggle repository, Radiological Society of North America (https://www.kaggle.com/datasets/andrewmvd/convid19-x-rays). (3) The SARS-CoV-2 CT scan dataset (https://www.kaggle.com/datasets/plameneduardo/sarscov2-ctscan-dataset).


