Abstract
Background
18F -fluorodeoxyglucose (FDG) positron emission tomography (PET) plays an important role in the staging and response assessment of lymphoma patients. Our aim was to explore the predictive relevance of metabolic tumor volume (MTV) and total lesion glycolysis (TLG) in patients with early stage Hodgkin lymphoma treated within the German Hodgkin Study Group HD16 trial.
Methods
18F-FDG PET/CT images were available for MTV and TLG analysis in 107 cases from the HD16 trial. We calculated MTV and TLG using three different threshold methods (SUV4.0, SUV41% and SUV140%L), and then performed receiver-operating-characteristic analysis to assess the predictive impact of these parameters in predicting an adequate therapy response with PET negativity after 2 cycles of chemotherapy.
Results
All three threshold methods analyzed for MTV and TLG calculation showed a positive correlation with the PET response after 2 cycles chemotherapy. The largest area under the curve (AUC) was observed using the fixed threshold of SUV4.0 for MTV- calculation (AUC 0.69 [95% CI 0.55–0.83]) and for TLG-calculation (AUC 0.69 [0.55–0.82]). The calculations for MTV and TLG with a relative threshold showed a lower AUC: using SUV140%L AUCs of 0.66 [0.53–0.80] for MTV and 0.67 for TLG [0.54–0.81]) were observed, while with SUV41% an AUC of 0.61 [0.45–0.76] for MTV, and an AUC 0.64 [0.49–0.80]) for TLG were seen.
Conclusions
MTV and TLG do have a predictive value after two cycles ABVD in early stage Hodgkin lymphoma, particularly when using the fixed threshold of SUV4.0 for MTV and TLG calculation.
Trial registration
ClinicalTrials.gov NCT00736320.
Keywords: Hodgkin lymphoma, Metabolic tumor volume, FDG PET, Response prediction
Background
Over the past few decades, Hodgkin lymphoma has become an effectively treatable malignancy with excellent long-term disease-free survival [1]. Nowadays, more than 90% of early-stage patients can be cured through first-line therapy, consisting of brief chemotherapy followed by 20 Gy consolidative irradiation [2–5]. Furthermore, treatment insensitivity in connection with both chemo- and radiotherapy has decreased considerably for patients with Hodgkin lymphoma at different tumor stages [6–8].
Since the introduction of 18F -fluorodeoxglucose (FDG) positron emission tomography (PET) into the management of many oncological diseases, it has taken on a major role in the staging and response assessment of lymphoma patients [9–12]. It has been shown that radiotherapy can safely be omitted in patients with PET-negative residual tissue after effective first-line chemotherapy for advanced-stage Hodgkin lymphoma [13]. Furthermore in advanced Hodgkin lymphoma, chemotherapy can be reduced to a total of 4 cycles eBEACOPP (Bleomycin, Etoposide, Doxorubicin, Cyclophosphamide, Vincristine, Procarbazine and Prednisone in escalated doses) if the PET is negative after 2 cycles [14]. For patients with early-stage unfavorable Hodgkin lymphoma, the HD17 trial has shown that radiotherapy can be omitted for PET-negative patients after effective chemotherapy without any clinically relevant loss of efficacy [15]. However, in early stage favorable Hodgkin lymphoma, three different randomized trials (H10, HD16 and RAPID) have shown that omitting radiotherapy in patients who are PET-negative after ABVD (doxorubicin, bleomycin, vinblastine and dacarbazine) chemotherapy is associated with a relevant loss of tumor control and increased number of relapses [6, 16, 17]. As the role of PET for individual tailoring of treatment is limited after 2 cycles of ABVD in early-stage favorable Hodgkin lymphoma, additional prognostic factors are needed urgently. Accordingly, we performed an analysis of metabolic tumor volume (MTV) and total lesion glycolysis (TLG) derived from PET at staging as potentially useful predictive factors, in early-stage Hodgkin lymphoma.
Methods
Study cohort
From November 2009 through December 2015, the prospective, multicenter phase III trial HD16 recruited a total of 1,150 therapy-naive Hodgkin lymphoma patients, aged 18 to 75 years. HD16 included patients in clinical stage I or II without risk factors such as three or more involved nodal areas, large mediastinal mass (≥ 1/3 of the maximal thoracic diameter as measured on chest X-ray), extra-nodal disease or elevated erythrocyte sedimentation rate (≥ 50 mm/h for patients without B symptoms and ≥ 30 mm/h in case of B symptoms).
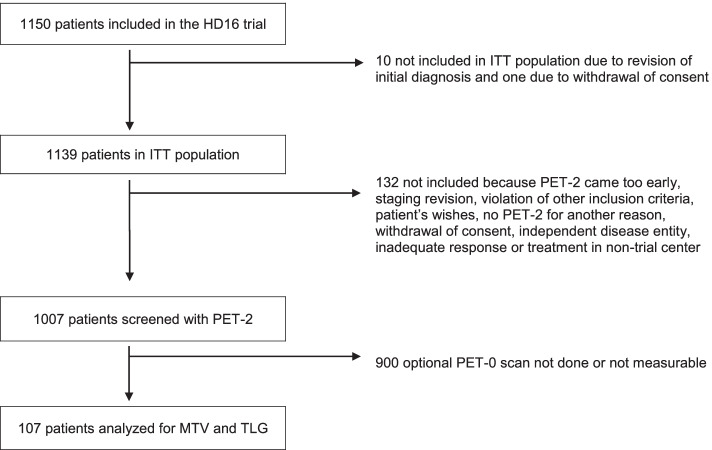
In HD16, individuals were randomly assigned either to standard combined-modality treatment including 2 cycles of ABVD followed by PET (PET-2) and consolidating radiotherapy irrespective of PET-2 result, or to the experimental arm where irradiation was omitted in cases of PET negativity after 2 cycles of ABVD. In HD-16 PET-2 was mandatory for all patients, while a staging PET before start of treatment was not a mandatory part of the protocol. The PET scans were performed according to the respective national guidelines, which did not include SUV harmonization. Accordingly, our analysis set consisted of those 107 individuals with baseline PET (PET-0) images available to the central review panel for quantitative assessment. (Fig. 1).
Fig. 1.
Flow chart. 1150 patients included in the HD16 trial. Baseline 18F-FDG PET was centrally reviewed in 107 patients with quantitative analyses. Abbreviations: ITT, intention to treat. HL, Hodgkin lymphoma. MTV, metabolic tumor volume. TLG, total lesion glycolysis
The HD16 trial was approved by the responsible ethics committees and was conducted according to the Declaration of Helsinki, in compliance with the Good Clinical Practice guidelines of the International Conference on Harmonization. All patients provided written informed consent before participation.
Image analysis
Baseline MTV and TLG were calculated in all baseline PET scans available for quantitative analyses, using the PET/CT Viewer in FIJI (ImageJ). First, maximal standardized uptake value (SUVmax) for the liver was obtained from a spherical 3-cm volume of interest (VOI) in the right liver lobe. Following that, SUVmax was estimated within all tumor sites with increased F-FDG uptake. Manual corrections were performed in cases where non-lymphoma tissue was included in the automatic calculation.
MTV calculations were then performed using the following thresholding methods:
1. 41% of the SUVmax within the respective lymphoma site (MTV41%),
2. a fixed SUV of 4.0 (MTV4.0),
3. 140% of the SUVmax of liver background (MTV140%L).
Within these MTVs, SUVmean was estimated and TLG was calculated as the sum of supra-threshold voxels of all lymphoma lesions multiplied by SUVmean within the respective MTV as follows:
1. Sum of MTV41% multiplied by SUVmean (TLG41%),
2. Sum of MTV4.0 multiplied by SUVmean (TLG4.0),
3. Sum of MTV140%L multiplied by SUVmean (TLG140%L),
Statistical evaluation
Patient characteristics and PET-2 response data were obtained from the study database. All data were analyzed descriptively. MTV and TLG distributions were visualized in histograms. The correlation of the different thresholding methods was assessed by Pearson product moment correlation coefficients. Receiver operating characteristic (ROC) analysis was performed to evaluate baseline MTV and TLG as predictors of PET-2 response, using the liver as cutoff for PET positivity (Deauville score 4) [18, 19]. Additionally, p-values resulting from logistic regressions on log-transformed data are reported to explore and quantify the predictive value of MTV and TLG on PET-2 positivity. All statistical computations were performed using SAS 9.4 (SAS Institute, Cary, NC, USA).
Results
Patients
Of the 1,139 patients from the intention-to-treat population of the HD16 study, 107 with available PET-0 were eligible for the present analysis. Characteristics of eligible and non-eligible patients are shown in Table 1. Among the 4 participating countries, the proportion of patients receiving a PET-0 scan was lowest in Germany. Other characteristics were similar in patients with and without PET-0. In PET-2, 16 (15%) of the patients examined were positive (Deauville Score 4) while 91 (85%) were negative (Deauville Score < 4).
Table 1.
Patient characteristics
| MTV and TLG measured | PET-0 not done or not measurable | ||
|---|---|---|---|
| N = 107 | N = 1032 | ||
| Age | Median (range) | 36 (18–75) | 38 (18–75) |
| Sex | Female | 44 (41%) | 441 (43%) |
| Male | 63 (59%) | 591 (57%) | |
| Country | Germany | 82 (77%) | 935 (91%) |
| Switzerland | 13 (12%) | 49 (5%) | |
| Austria | 7 (7%) | 34 (3%) | |
| Netherlands | 5 (5%) | 14 (1%) | |
| Performance status | ECOG = 0 | 100 (94%) | 948 (92%) |
| ECOG = 1 | 7 (6%) | 82 (8%) | |
| ECOG = 2 | - | 1 (< 1%) | |
| Ann Arbor stage | IA | 31 (29%) | 278 (27%) |
| IB | 4 (4%) | 42 (4%) | |
| IIA | 69 (65%) | 656 (64%) | |
| IIB | 3 (3%) | 56 (5%) | |
| Treatment group | Standard CMT | 59 (55%) | 514 (50%) |
| PET-stratified | 48 (45%) | 518 (50%) | |
| PET-2 result | DS1 | 49 (46%) | 463/932 (50%) |
| DS2 | 13 (12%) | 159/932 (17%) | |
| DS3 | 29 (27%) | 199/932 (21%) | |
| DS4 | 16 (15%) | 111/932 (12%) | |
| Failure in terms of PFS | No | 99 (93%) | 943 (91%) |
| Yes | 8 (7%) | 89 (9%) |
MTV
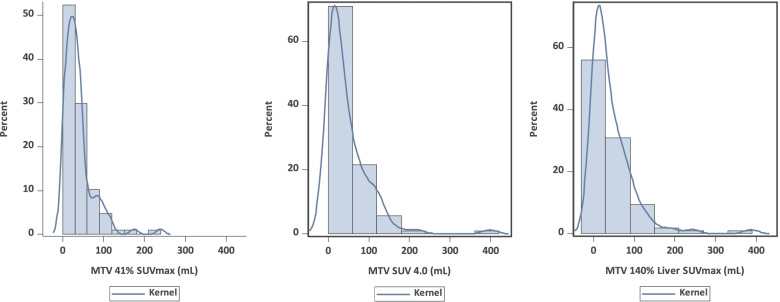
Histograms of the MTV distributions are presented in Fig. 2 and show a right-skewed distribution for all thresholding methods. The median values of MTV41%, MTV4.0, and MTV140%L were 28.7 mL (range, 0.9 – 238.9), 27.4 mL (range, 0.34 – 397.8) and 24.4 mL (range, 0.1 – 386.4). The correlation between the two relative threshold methods was 0.70, while the correlations with the absolute thresholding method (MTV4.0) were 0.70 for MTV41% and 0.94 for MTV140%L, respectively. Low correlation of MTV41% might have been caused by the relatively lower volume compared to MTV4.0 and MTV140L in the case of a higher SUVmax.
Fig. 2.
Histograms of MTV distribution assessed by different thresholding methods. MTV was obtained using the following thresholds: 41% of the SUVmax within the respective lymphoma site (MTV41%), a fixed SUV of 4.0 (MTV4.0), and 140% of the SUVmax of liver background MTV140%L. Abbreviations: MTV, metabolic tumor volume
TLG
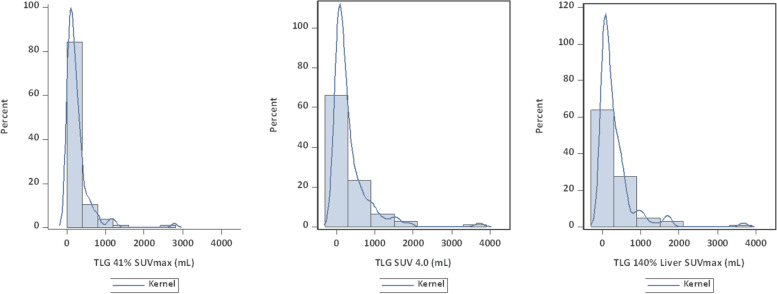
Histograms of the TLG distributions are presented in Fig. 3 and show a right-skewed distribution for all thresholding methods. The SUVmean for MTV41% was 6.8 (± 3.2), MTV4.0 6.3 (± 1.8), and MTV140%L 6.6 (± 2.0). The median of TLG41%, TLG4.0, and TLG140%L were 162.0 (range, 5.8 – 2771.5), 160.5 (range, 1.4 – 3715.3) and 147 mL (range, 0.2 – 3670.8). The correlation between the two relative threshold methods was 0.94, while the correlations with the absolute thresholding method (TLG4.0) were 0.92 for TLG41% and 0.97 for TLG140%L, respectively.
Fig. 3.
Histograms of TLG distribution assessed by different thresholding methods. TLG was obtained using the following thresholds: 41% of the SUVmax within the respective lymphoma site (TLG41%), a fixed SUV of 4.0 (TLG4.0), and 140% of the SUVmax of liver background (TLG140%L). Abbreviations: TLG, total lesion glycolysis
Effect of MTV on PET-2 positivity
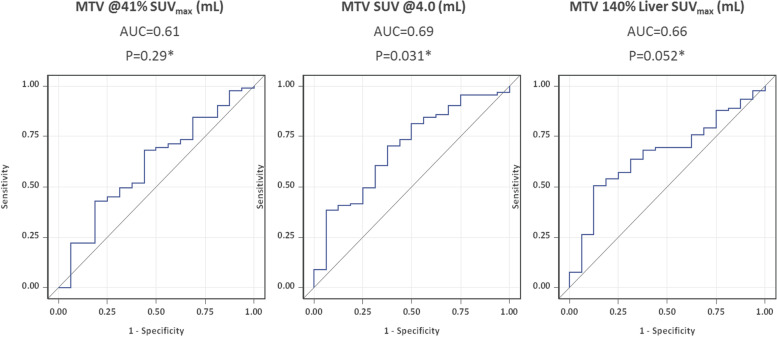
The ROC curves for PET response after two cycles of ABVD were derived from MTV using different thresholding methods, and are displayed in Fig. 4. Areas under the curve (AUC) for MTV41%, MTV4.0, and MTV140%L were 0.61 (95% CI 0.45–0.76, Plogist = 0.29), 0.69 (0.55–0.83, Plogist = 0.031), and 0.66 (0.53–0.80, Plogist = 0.052).
Fig. 4.
ROC curves of MTV distribution assessed by different thresholding methods for PET response after two cycles of ABVD (16/107 = 15% PET-2-positive patients with Deauville score 4). MTV was obtained using the following thresholds: 41% of the SUVmax within the respective lymphoma site (MTV41%) a fixed SUV of 4.0 (MTV4.0) and 140% of liver background (MTV140%L). Abbreviations: MTV, metabolic tumor volume. AUC, area under the curve
Effect of TLG on PET-2 positivity
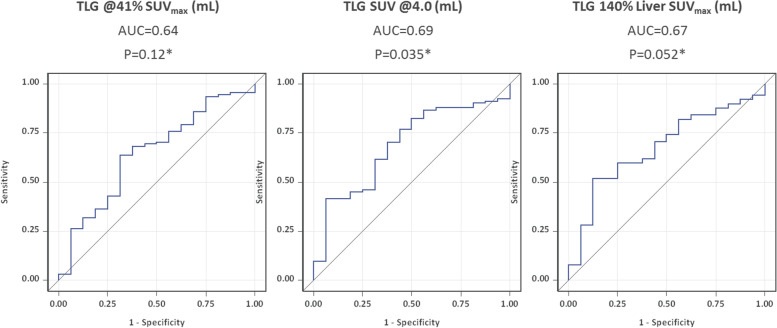
The ROC curves for PET response after two cycles of ABVD were derived from TLG using different thresholding methods, and are displayed in Fig. 5. AUC for TLG41%, TLG4.0 and TLG140%L were 0.64 (95% CI 0.49–0.80, Plogist = 0.12), 0.69 (0.55–0.82, Plogist = 0.035), and 0.67 (0.54–0.81, Plogist = 0.052).
Fig. 5.
ROC curves of TLG distribution assessed by different thresholding methods for PET response after two cycles of ABVD (16/107 = 15% PET-2-positive patients with Deauville score 4). TLG was obtained using the following thresholds: 41% of the SUVmax within the respective lymphoma site (TLG41%) a fixed SUV of 4.0 (TLG4.0) and 140% of the SUVmax of liver background (TLG140%L). Abbreviations: TLG, total lesion glycolysis. AUC, area under the curve
Discussion
The following results emerge from our analysis of 107 patients with early-stage favorable Hodgkin lymphoma: All three methods used for calculating MTV and TLG show a moderate predictive impact with regard to PET response after 2 cycles of ABVD in early-stage favorable Hodgkin lymphoma. Both the calculations of MTV and TLG using SUV 4.0 as fixed threshold, showed a small advantage, as compared to the other methods used.
Various studies have indicated the prognostic potential of baseline MTV in Hodgkin lymphoma patients [19–26]. Akhtari and colleagues showed that MTV and TLG could help predict worse outcome in 267 patients with early-stage Hodgkin lymphoma who received combined standard modality treatment. Furthermore, two distinct categories can be discerned from MTV or TLG: low and high disease burdens [20]. In a study of 59 patients with Hodgkin lymphoma treated with anthracycline-based chemotherapy, Kanoun and colleagues highlighted a possible division into two risk groups with regard to long-term success on the basis of the MTV and the metabolic signature [21]. Cottereau and colleagues showed baseline MTV to be a strong prognostic factor in 258 patients with early-stage Hodgkin lymphoma who received standard combined modality treatment. This collective of patients could also be divided into two risk groups based on the MTV [22]. In another group of 127 patients, Song and colleagues showed that MTV can be a prognostic factor and can also usefully influence selection of the necessary therapy regimen [23]. In 65 patients with a relapsed or refractory Hodgkin, Moskowitz and colleagues found MTV to be a very strong prognostic factor and one that can also improve the predictive value of PET before autologous stem cell transplantation [24]. In 310 patients with advanced Hodgkin lymphoma, Mettler and colleagues have shown that the MTV can predict patient response after two cycles of eBEACOPP, regardless of the method used to determine it [25]. The receiver-operating-characteristic curves in their study did not point to any unique cut-offs, but indicated a wide range of possible cut-offs [25], as we have also observed here in the present work. Analyzing a group of 140 DLBCL patients, Kim and colleagues show that the metabolic tumor burden expressed as TLG can be a prognostic factor for survival after R-CHOP [26]. All these studies are in line with our finding that initial MTV and TLG are parameters of additional use for response prediction.
Here, it should be noted that there is as yet no standardized procedure for measuring MTV and TLG [27]. A variety of methods and software platforms are currently in use for MTV and TLG calculation. The use of algorithms with fixed-threshold or relative-threshold values and adaptive threshold values is often encountered in this context [28]. Using a relative threshold of 41% of SUVmax for 106 patients with peripheral T-cell lymphoma, Cottereau and colleagues demonstrated that baseline MTV is a relevant risk factor [22]. Kanoun and colleagues showed that MTV calculation using a fixed threshold of SUV 2.5 gave a higher volume than a relative limit of 41% of SUVmax [21]. In their cohort of 140 DLBCL patients, Kim and colleagues showed that a TLG calculated with 50% of the SUVmax has the highest prognostic accuracy when a relative threshold is used [26]. This is contrary to our results that indicate that a fixed threshold has a higher predictive value than a relative threshold. Furthermore, in a group of 121 patients, Tutino and co-workers observed that with a fixed threshold of SUV4.0 MTV-calculation is less dependent on the reviewer and can be reproduced better than calculation using a relative threshold of SUV41% [29]. This is in line with our observation that MTV and TLG using a fixed cut-off of 4.0 may be slightly superior in terms of predicting PET-2 positivity. Here we have observed that MTV4.0 works comparably well in a cohort in which no SUV standardization between participating PET centers has been performed.
Due to the limited number of survival events, our analyses were restricted to PET-2 positivity and a further investigation of the influence on long-term efficacy in terms of progression-free survival is pending. However, as the prognostic influence of PET-2 on progression-free survival has been demonstrated for the HD16 trial [6], PET-2 could be regarded as a surrogate for longer-term efficacy. In order to further improve response prediction and risk-adapted individualization of therapy, additional risk factors are needed. Such risk factors might include but need not be restricted to the use of MTV and TLG, possibly in combination with PET-2. New biomarkers such as thymus and activation-regulated chemokine or cell free DNA would be well worth further investigation for individual tailoring of treatment in patients with Hodgkin lymphoma [30].
Conclusion
MTV and TLG show predictive value after two cycles of ABVD in early-stage favorable Hodgkin lymphoma. When determining MTV and TLG, due to higher reproducibility and a slight advantage over a relative threshold, we favor a fixed cut-off of SUV 4.0.
However, it remains to be shown whether these factors can have a useful impact on prognosis when applied in combination with PET-2 assessment and other biomarkers in early stage Hodgkin lymphoma.
Acknowledgements
Not applicable
Abbreviations
- FDG
18F -fluorodeoxyglucose
- PET
Positron emission tomography
- CT
Computed tomography
- MTV
Metabolic tumor volume
- TLG
Total lesion glycolysis
- AUC
Area under the curve
- SUV
Standardized uptake value
- ABVD
Adriamycin, Bleomycin, Vinblastin und Dacarbazin
- Gy
Gray
- GHSG
German Hodgkin Study Group
- PET-0
Baseline PET
- PET-2
PET after 2 cycles of chemotherapy
- VOI
Volume of interest
- ROC
Receiver operating characteristic
- eBEACOPP
Bleomycin, Etoposide, Doxorubicin, Cyclophosphamide, Vincristine, Procarbazine and Prednisone in escalated doses
- DLBCL
Diffuse large B cell lymphoma
- R-CHOP
Rituximab, Clophosphamid; Doxorubicin; Vincristin; Prednisone
Authors’ contributions
Conception and design: LvH, CS, JM, MF, PB, AE, MD, CK. Provision of study materials or patients: LvH, CS, JM, FH, MF, PB, AE, CK. Collection and assembly of data: LvH, CS, JM, FH, CB, MF, PB, AE, MD, CAV, CK. Data analysis and interpretation: LvH, CS, HK, HM, JM, CB, MF, PB, AE, MD, CAV, CK. Manuscript writing: All authors. Final approval of manuscript: All authors. Accountable for all aspects of the work: All authors.
Funding
Open Access funding enabled and organized by Projekt DEAL. No specific funding for this study.
Availability of data and materials
From the corresponding author on request.
Declarations
Ethics approval and consent to participate
The study was ethically approved by the ethical review committee of the Medical Faculty of the University of Cologne. All patients gave their written consent to participate in the HD16 trial.
Consent for publication
Not applicable.
Competing interests
All authors declare that they have no conflict of interest.
Footnotes
Publisher’s Note
Springer Nature remains neutral with regard to jurisdictional claims in published maps and institutional affiliations.
References
- 1.Howlader N, Noone AM, Krapcho M, Miller D, Brest A, Yu M, et al. SEER Cancer Statistics Review. 1975–2016. https://seer.cancer.gov/csr/1975_2016/. Accessed 7 Nov 2021.
- 2.Fermé C, Eghbali H, Meerwaldt JH, et al. Chemotherapy plus involved-field radiation in early-stage Hodgkin’s disease. N Engl J Med. 2007;357:1916–1927. doi: 10.1056/NEJMoa064601. [DOI] [PubMed] [Google Scholar]
- 3.Engert A, Plütschow A, Eich HT, et al. Reduced treatment intensity in patients with early-stage Hodgkin’s lymphoma. N Engl J Med. 2010;363:640–652. doi: 10.1056/NEJMoa1000067. [DOI] [PubMed] [Google Scholar]
- 4.Connors JM. State-of-the-art therapeutics: Hodgkin´s lymphoma. J Clin Oncol. 2005;23:6400–6408. doi: 10.1200/JCO.2005.05.016. [DOI] [PubMed] [Google Scholar]
- 5.Engert A, Horning S, editors. Hodgkin Lymphoma. Heidelberg: Springer; 2011. [Google Scholar]
- 6.Fuchs M, Goergen H, Kobe C, et al. Positron emission tomography-guided treatment in early-stage favorable Hodgkin Lymphoma: final results of the international, radomized phase II HD16 trial by the German Hodgkin Study Group. J Clin Oncol. 2019;37(31):2835–2845. doi: 10.1200/JCO.19.00964. [DOI] [PubMed] [Google Scholar]
- 7.Eichenauer DA, André M, Johnson P, et al. Controversies in the treatment of classical Hodgkin Lymphoma. Hemasphere. 2008;2(5):e149. doi: 10.1097/HS9.0000000000000149. [DOI] [PMC free article] [PubMed] [Google Scholar]
- 8.Engert A, Younges A (eds): Principles of radiation therapy for Hodgkin Lymphoma in Hodgkin Lymphoma: a comprehensive overview. Basel: Springer International Publishing; 2015. p. 157–77.
- 9.Kobe C, Dietlein M, Franklin J, et al. Positron emission tomography has a high negative predictive value for progression or early relapse for patients with residual disease after first-line chemotherapy in advanced stage Hodgkin lymphoma. Blood. 2008;112:3989–3994. doi: 10.1182/blood-2008-06-155820. [DOI] [PMC free article] [PubMed] [Google Scholar]
- 10.Weihrauch MR, Re D, Bischoff S, et al. Whole-body positron emission tomography using 18F-fluorodeoxyglucose for initial staging of patients with Hodgkin´s disease. Ann Hematol. 2002;81:20–25. doi: 10.1007/s00277-001-0390-y. [DOI] [PubMed] [Google Scholar]
- 11.Gallamini A, Rigacci L, Merli F, et al. The predictive value of positron emission tomography scanning performed after two courses of standard therapy on treatment outcome in advanced stage Hodgkin´s disease. Haematologica. 2006;91:475–481. [PubMed] [Google Scholar]
- 12.Gallamini A, Hutchings M, Rigacci L, et al. Early interim 2-[18F]fluoro-2-deoxy-D-glucose positron emission tomography is prognostically superior to international prognostic score in advanced-stage Hodgkin´s lymphoma: a report from a joint Italian-Danish study. J Clin Oncol. 2007;25:3746–3752. doi: 10.1200/JCO.2007.11.6525. [DOI] [PubMed] [Google Scholar]
- 13.Engert A, Haverkamp H, Kobe C, et al. Reduced-intensity chemotherapy and-guided radiptheray in patients with advanced stage Hodgkin´s lymphoma (HD15 trial): a randomized, open label phase 3 non-inferiority trial. Lancet. 2012;379:1791–1799. doi: 10.1016/S0140-6736(11)61940-5. [DOI] [PubMed] [Google Scholar]
- 14.Borchmann P, Goergen H, Kobe C, et al. PET-guided treatment in patients with advanced-stage Hodgkin´s lymphoma (HD18): final results of an open-label, international, randomized phase 3 trial by the German Hodgkin Study Group. Lancet. 2017;390:2790–2802. doi: 10.1016/S0140-6736(17)32134-7. [DOI] [PubMed] [Google Scholar]
- 15.Borchman P, Plütschow A, Kobe C, et al. PET-guided omission of radiotherapy in early-stage unfavourable Hodgkin lymphoma (GHSG HD17): a multicenter, open-label, randomized, phase 3 trial. Lancet Oncol. 2021;22(2):223–234. doi: 10.1016/S1470-2045(20)30601-X. [DOI] [PubMed] [Google Scholar]
- 16.Raemaekers JMM, André MPE, Federico M, et al. Omitting radiotherapy in early positron emission tomography-negative stage I/II Hodgkin lymphoma is associated with an increased risk of early relaps: clinical results of the preplanned interim analysis of the randomized EORTC/LYSA/FIL H10 Trial. J Clin Oncol. 2014;32(12):1188–1194. doi: 10.1200/JCO.2013.51.9298. [DOI] [PubMed] [Google Scholar]
- 17.Radford J, Illidge T, Counsell N, et al. Results of trial of PET-directed therapy for early-stage Hodgkin´s lymphoma. N Engl J Med. 2015;372:1598–1607. doi: 10.1056/NEJMoa1408648. [DOI] [PubMed] [Google Scholar]
- 18.Meignan M, Cottereau AS, Versari A, et al. Baseline metabolic tumor volume predicts outcome in high-tumor-burden follicular lymphoma: apooled analysis of three multicentre studies. J Clin Oncol. 2016;34:3618–3626. doi: 10.1200/JCO.2016.66.9440. [DOI] [PubMed] [Google Scholar]
- 19.Gallamini A, Barrington SF, Biggi A, et al. The predictive role of interim positron emission tomography for Hodgkin lymphoma treatment outcome is confirmed using the interpretation criteria of the Deauville five point scale. Haematologica. 2014;99:1107–1113. doi: 10.3324/haematol.2013.103218. [DOI] [PMC free article] [PubMed] [Google Scholar]
- 20.Akhtari M, Milgrom SA, Pinnix CC, et al. Reclassifying patients with early-stage Hodgkin lymphoma based on functional radiographic markers at presentation. Blood. 2018;131:84–94. doi: 10.1182/blood-2017-04-773838. [DOI] [PMC free article] [PubMed] [Google Scholar]
- 21.Kanoun S, Rossi C, Berriolo-Riedinger A, et al. Baseline metabolic tumour volume is an independent prognostic factor in Hodgkin lymphoma. Eur J Nucl Med Mol Imaging. 2014;41:1735–1743. doi: 10.1007/s00259-014-2783-x. [DOI] [PubMed] [Google Scholar]
- 22.Cottereau AS, Versari A, Loft A, et al. Prognostic value of baseline metabolic tumor volume in early-stage Hodgkin lymphoma in the standard arm of the H10 trial. Blood. 2018;131:1456–1463. doi: 10.1182/blood-2017-07-795476. [DOI] [PubMed] [Google Scholar]
- 23.Song MK, Chung JS, Lee JJ, et al. Metabolic tumor volume by positron emission tomography/computed tomography as a clinical parameter to determine therapeutic modality for early stage Hodgkin’s lymphoma. Cancer Sci. 2013;104:1656–1661. doi: 10.1111/cas.12282. [DOI] [PMC free article] [PubMed] [Google Scholar]
- 24.Moskowitz AJ, Schoder H, Gavane S, et al. Prognostic significance of baseline metabolic tumor volume in relapsed and refractory Hodgkin lymphoma. Leuk Lymphoma. 2009;50:1257–1260. doi: 10.1080/10428190903040048. [DOI] [PMC free article] [PubMed] [Google Scholar]
- 25.Mettler J, Müller H, Voltin CA, et al. Metabolic tumor volume for response prediction in advance-stage Hodgkin Lymphoma. J Nucl Med. 2019;60:207–211. doi: 10.2967/jnumed.118.210047. [DOI] [PMC free article] [PubMed] [Google Scholar]
- 26.Kim TM, Paeng JC, Chun IK, et al. Total lesion glycolysis in positron emission tomography is a better predictor of outcome than the international prognostic index for patients with diffus lage B Cell lymphoma. Cancer. 2013;119(6):1195–1202. doi: 10.1002/cncr.27855. [DOI] [PubMed] [Google Scholar]
- 27.Meignan M, Sasanelli M, Casasnovas RO, et al. Metabolic tumour volumes measured at staging in lymphoma: Methodological evaluation on phantom experiments and patients. Eur J Nucl Med Mol Imaging. 2014;41:1113–1122. doi: 10.1007/s00259-014-2705-y. [DOI] [PubMed] [Google Scholar]
- 28.Carlier T, Bailly C. State-of-theart and recent advances in quantification for therapeutic follow-up in oncology using PET. Front Med. 2015;2:18. doi: 10.3389/fmed.2015.00018. [DOI] [PMC free article] [PubMed] [Google Scholar]
- 29.Tutino F, Puccini G, Linguanti F, et al. Baseline metabolic tumor volume calculation using different SUV thresholding methods in Hodgkin Lymphoma patients: interobserver argreement and reproducibility across software platforms. Nuc Med Com. 2021;42(3):284–291. doi: 10.1097/MNM.0000000000001324. [DOI] [PubMed] [Google Scholar]
- 30.Borchmann S. Liquid biopsy in Hodgkin lymphoma – moving beyond the proof of principle. Br J Haematol. 2021;195(4):493–494. doi: 10.1111/bjh.17796. [DOI] [PubMed] [Google Scholar]
Associated Data
This section collects any data citations, data availability statements, or supplementary materials included in this article.
Data Availability Statement
From the corresponding author on request.


