

SUMMARY
Influenza poses a significant public health burden worldwide. Understanding how and to what extent people would change their behaviour in response to influenza outbreaks is critical for formulating public health policies. We incorporated the information-theoretic framework into a behaviour-influenza (BI) transmission dynamics system in order to understand the effects of individual behavioural change on influenza epidemics. We showed that information transmission of risk perception played a crucial role in the spread of health-seeking behaviour throughout influenza epidemics. Here a network BI model provides a new approach for understanding the risk perception spread and human behavioural change during disease outbreaks. Our study allows simultaneous consideration of epidemiological, psychological, and social factors as predictors of individual perception rates in behaviour-disease transmission systems. We suggest that a monitoring system with precise information on risk perception should be constructed to effectively promote health behaviours in preparation for emerging disease outbreaks.
Key words: Epidemiology, human behaviour, influenza, information theory, modelling, risk perception
INTRODUCTION
It is well recognized that influenza poses a significant public health burden worldwide. Generally, non-regulatory approaches to changing behaviours against influenza across individuals and populations have focused on using information-based interventions to persuade people of the infection risks they face. The potential benefits of behavioural change may result from clinics or public health campaigns such as those aimed at keeping one's distance from infected individuals, wearing protective masks, and reducing time spent in crowded environments [1].
Understanding how and to what extent people would change their behaviour in response to an epidemic is critical for formulating public health policies to control the spread of infectious diseases [2]. Chen et al. [3] found that individuals who were infected at a lower rate were more likely to engage in self-protective behaviour compared to those with a higher rate of infection. Recent researches have indicated that the risk perception of the disease, the level of anxiety regarding the disease, the perceived efficacy of self-protective measures, and other factors are positively associated with people's willingness to engage in self-protective behaviour during influenza virus outbreaks [4]. Generally, risk perception can be referred to as an awareness or belief about the potential hazard and/or harm [5]. Risk perception may be affected by factors such as perception of a hazard, cultural and social factors or the experience or memory of a prior similar hazard, all of which may result in variation in risk perception among individuals [5]. In a behaviour-disease system, risk perception can be described by the likelihood and severity of the infectious disease [4, 6].
Previous researches have linked transmission dynamics with behavioural modelling to investigate behavioural responses to epidemics [7–12]. More recently, Wells et al. [13] incorporated behaviour such as perceived vaccine risks and social influences into a seasonal influenza transmission model to examine decision-making regarding vaccine uptake. Many studies have also highlighted that the social network structure could enable new health behavioural interventions to critically affect the interactions between risk perception and contagious disease transmission [4, 9, 14–16]. Despite the importance of understanding the impact of risk perception on a pandemic [1, 17], it is difficult to predict empirically the spread of health behaviour for reducing susceptibility.
Funk et al. [7, 8] linked a mathematical model describing the spread of risk perception in a host population and the epidemiological susceptible-infected-recovered (SIR) model for understanding the perception effects on behavioural change and susceptibility reduction. They treated the spread of risk perception or behaviour as a simple contagious disease, implying that a single contact with an infected individual is usually sufficient to transmit the risk perception or behaviour. Funk et al. [7] also pointed out that interaction within a disease network structure can induce health behavioural change in individuals which can feed back to alter the disease dynamics.
Generally, perception variance (noise) can be adequately described as the stochastic individual–individual variability. Experimentally, perception noise can be observed by sampling the distribution of responses by a group of infected individuals exposed to the same input sources of information regarding the accurate knowledge of influenza. Moreover, if the distribution of responses elicited by a less accurate perception overlaps with the distribution elicited by a more accurate perception, an individual whose response value falls within the overlap will not be able to distinguish with absolute certainty which perception was presented. This inability to resolve distinct risk perceptions represents a loss of information about the knowledge of influenza. In order to quantify the degree to which perception noise affects the accurate knowledge of influenza, or specifically to determine what a behaviour-influenza (BI) transmission system can or cannot communicate accurately; it is useful to turn to information theory.
Information theory provides a mathematical framework to quantify the amount of information that can be transmitted through a noisy communication channel and thus any complex system can be reduced to a black box communication channel and analysed. The strength of this type of analysis is that only input and output measurements are required. Some studies have provided examples of disease transmission systems that have benefited from such an analysis [18].
Recently, epidemiological studies were conducted on a large scale in genetics, the network structure, and cell function by using information-theoretic methods [19]. Such ideas may provide effective means for the field of epidemiology for social network structure assessment. To discriminate the epidemic heterogeneity and network structure on the spatio-temporal pattern of the epidemic process, Colizza et al. [20] introduced a characterization of the epidemic pattern by using entropy. Quax et al. [21] inferred the structure of the sexual network by the likelihood cluster-size distribution.
The purpose of this study is to apply information theory to a BI dynamics system for assessing risk perception transmission. In this study, we incorporated a classic SIR model into an information-theoretic framework to assess the spread of information flow of risk perception concerning influenza and the consequent behavioural changes in a single population and a network system. We provided theoretical and numerical analyses of various scenarios involved in a BI transmission model that was also implemented in a network-based information scheme.
MATERIALS AND METHODS
BI model
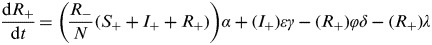
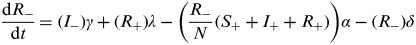
We developed a BI model by incorporating a previously established SIR-based perception model [8] into an information-theoretic framework to simulate the information flow of risk perception in response to an influenza outbreak (Fig. 1a, b). The mathematical descriptions of the transmission dynamics for the SIR-based perception model are listed in Table 1.
Fig. 1.

Schematic representation of proposed behaviour-influenza (BI) transmission dynamics systems. (a) SIR-based perception model by Funk et al. [8]. (b) Information flow of R0 signals through the communication channel to link some output I. (c) Uncertainty for population about input signal R0s due to response I. (d) Network BI models.
Table 1.
| Dynamic equations† | |
|---|---|
 |
(T1) |
 |
(T2) |
 |
(T3) |
 |
(T4) |
 |
(T5) |
 |
(T6) |
Briefly, the BI model uses six compartments to represent disease states with and without perception [8]. The model divided the population into two groups, i.e those with and those without perception, so that people with perception are assumed to become aware of information about the infectious disease as such information emerges in the population. Hence, people tend to assess the individual costs and benefits of behavioural change which leads to action (e.g. mask wearing, vaccination, etc.).
The number of individuals with perception would either be increased or decreased by perception spread and perception loss, respectively. The susceptible population would increase due to loss of immunity and also decrease following infection, acquired by contact between susceptible and infected individuals, with and without perception. The infected population would increase by successful infection of susceptible individuals and decrease by recovery. The recovered population would increase and decrease by recovery and loss of immunity, respectively. The symbols, meanings, and values used in the BI model are given in Table 2.
Table 2.
Values and descriptions of input parameters used in the SIR-based perception model
| Symbol | Description | Value |
|---|---|---|
| S+ | Susceptible with perception | 0* |
| I+ | Infected with perception | 0* |
| R+ | Recovered with perception | 0* |
| S− | Susceptible without perception | 99* |
| I− | Infected without perception | 1* |
| R− | Recovered without perception | 0* |
| N | Total population | 100* |
| α | Perception spread rate | 0·1–3* |
| Φ | People who perceive the presence of the disease | 1† |
| δ | Immunity loss rate of recovered without perception | 0·5† |
| σI | Reduced infectivity factor from infected individuals with perception to susceptible individuals without perception | 0·5† |
| σS | Reduced susceptibility factor from infected individuals without perception to susceptible individuals with perception | 0·5* |
| β | Infection rate from infected to susceptible state | 1–3·5* |
| λ | Perception loss rate | 1† |
| ω | Rate of infected individuals becoming perceptive | 1† |
| εγ | Reduction in the duration of infected individuals with perception | 2† |
| γ | Recovery rate of infected without perception | 0·1† |
Assumed in this study.
Adopted from Funk et al. [8].
Here we identified estimates of the basic reproduction number (R0), with and without perception, based on the present BI model. R0 can be used to quantify disease infection severity, defined as the average number of secondary cases produced by an infected individual in a totally susceptible population [22]. Therefore, this study used two parameters, R0a and R0d, to describe populations with and without perception, respectively, during an influenza epidemic. Based on the BI models, there are two R0s, i.e. R0a = α/λ for the with-perception state and R0d = β/γ for the without-perception state, where α is the rate of perception spread, λ is the rate of perception loss, β is the infection rate describing contact between infected and susceptible populations, and γ is the recovery rate from infected to recovered populations.
Information flow of risk perception
In the information theory framework, we used two types of information transfer and exchange on various perception information processing within the BI scheme: (i) Sa ≡ R0a and (ii) Sd ≡ R0d, representing the R0 signals with and without perceptual states, respectively (Fig. 1b). We used the R0's signal as a proxy input source of risk perception information about an influenza outbreak and the infected fraction of the population (I) as an output response to capture the infection level in the total population.
Therefore, a communication channel can be used to link an input source of information Sa or Sd to an output I (Fig. 1b). However, the signal processing may cause noise that includes noisy and incomplete surveillance data from input signal R0s, leading to an overlap of possible output response I (Fig. 1b, c). Thus, the uncertainty for an individual to acquire an accurate perception of influenza knowledge can be induced from the overlapping response to Sa and Sd (Fig. 1c).
Network BI models
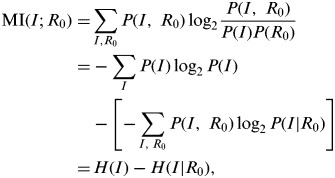
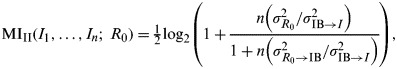
In view of the BI model (Fig. 1a, b), the mutual risk perception information (MI) between R0 and I, i.e. MI(I; R0) can be expressed mathematically as the binary logarithm of the maximum number of input signal values (R0), whereas a signalling system can resolve in the presence of its noisy output response (I) [23],
 |
(1) |
where P(I, R0) is a joint probability function determining the marginal probability functions P(I) and P(R0) which can be expressed as P(I, R0)=P(R0) × P(I|R0), in that P(I|R0) is a conditional response distribution, H(I) is the Shannon entropy of a random variable I with a probability mass function P(I) measured in bits, H(I|R0) is the conditional entropy for a conditional response probability P(I|R0), and log2 is a binary logarithm, representing an individual may have a two-state context of with- and without-perception information in the social contagion during an epidemic.
In particular, H(I) measures inherent uncertainty rather than how different the outcomes are, whereas MI(I; R0) measures the reduction in the entropic uncertainty of I due to the knowledge of R0, regardless of how their outcomes may correlate [23]. The R0 signal distribution, P(R0), reflects setting-specific influenza transmission potentials at which an individual perceives different R0 values.
The disease transmission is typically processed by disease networks comprising multiple channels. However, there is noise in perception acquisition, although the source of the noise is unclear. This information bottleneck (IB) might be anywhere: in the information from perception, in the ability to accumulate the incoming information over time or in an imperfect strategy that might incorrectly estimate the importance of an accurate knowledge of an epidemic.
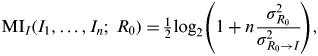
Here we used network information theory known as the multiple access channel (MAC) model [23] to describe the effects of a disease network structure on transmission for information flow of risk perception. We considered two simple network BI models, (i) without IB: NM-I and (ii) with IB: NM-II, for transmitting a signal R0 through multiple channels to the responses I1, I2,…, In, under the assumption of Gaussian distribution (Fig. 1d).
The maximum MI resulting from NM-I can be calculated as [23],
 |
(2) |
where n is the number of contacts of infectious individuals,  is the variance of the R0 signal distribution, and
  is the variance introduced in each access channel. The ratio
  is the signal-to-noise ratio (SNR) [23].
On the other hand, the maximum MI resulting from NM-II is [23],
 |
(3) |
where  is the variance introduced to the IB and σIB→I2 is the variance introduced in each access channel through the IB to response I.
Variance in NM-I and NM-II
Previous studies providing valuable data related to the viral titre over time for the <18 and ⩾18 years age groups on experimental human influenza data (Supplementary Tables S1 and S2), allowed us to calculate  . Moreover, to assess the variance of the R0's signal distribution
  , we utilized a previous study [24] to identify the estimates of the viral titre and I. We used a four-parameter Hill-based dose–response model to construct the relationship between R0 and viral titre,
| (4) |
where V is the viral titre (log TCID50/ml), R0 min and R0 max are the minimum and maximum R0, R0V50 is the viral titre at 50% R0, and nH is the fitted Hill coefficient.
Theoretically, during the epidemic I is seen to depend only on R0 in a homogeneous and unstructured population [22],
| (5) |
We solved equation (5) numerically by using a nonlinear regression model to best fit the profile describing the relationship between I and R0 for values of R0 ranging from 1–5 as: I(R0) = 1−exp(1·63 − 1·66R0) (r2 = 0·99, P < 0·05). Finally, R0 can be estimated as a function of I only
| (6) |
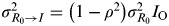
To explore the effects of the disease network on risk perception, we used a correlation coefficient (ρ) to associate R0 and I from the published data (see Supplementary material). ρ can be used to associate the amount of observed variability which can attribute variance to the overall biological variability and experimental noise to assess the estimates of MI affected by experimental noise. On the other hand, the overlapping percentage (IO) (Fig. 1c) can be used to calculate  . Thus, the information-theoretic theorem with known values of ρ, IO, and
  ,
,  can be computed as:
 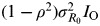 [23].
[23].
To determine the variance in NM-II, we adopted the concept of influenza viral reassortment as an information exchange between viral segments [25]. First, we adopted an adaptive mutation model [26] to account for the effect of an IB on the R0's signal transmission in NM-II. André & Day [26] indicated that the adaptive mutation might occur by chance within a secondary infection due to a transmission bottleneck in a transmission chain of the emergence of an infectious disease.
Thus, we analogized the mutation pathogen changes to the next state as the transmission of R0's signal through a communication channel due to an IB ( ) which has the form [26],
 |
(7) |
where P is the probability of an initial state that does not change to the next stage, μ is the probability of the chance that the mutation pathogen in the adaptive host changes to the next state, and L is the expected duration of infections caused by influenza. Thus, the variance between R0 and IB ( ) can be calculated.
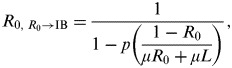
On the other hand, to study the R0's signal transmission between IB and response I, we adopted the concept in the SIR-based pathogen genetic diversity model [27]. Thus, the information flow of risk perception through the IB to response I can be expressed as
| (8) |
where e is the probability of an infected individual moving to the recovered state and b is the probability of any host moving to the susceptible state. The variance between IB and response I (σIB→I2) can then be calculated by equation (8).
Behavioural change modelling
To explore the effects of health behavioural change on BI transmission dynamics, three actions representing health behaviours as a consequence of protective behaviour adopted in a state of greater alert (e.g. awareness of carrying the disease) were adopted in an epidemic equilibrium structure [8]. (i) Reduced susceptibility: only susceptible individuals have their susceptibility reduced by a factor σS, while the other rates remain unaffected by perceiving an accurate knowledge of influenza; (ii) reduced infectivity: only infected individuals have their infectivity reduced by a factor σI, while the other rates remain unaffected by perceiving an accurate knowledge of influenza; and (iii) faster recovery: only the recovery rate depends on the perception of an accurate knowledge of influenza such that ε > 1, while all other parameters are perception-independent.
Thus, the equilibrium signal from the population without perception R0ed with a reduced susceptibility factor σS can be expressed as [8],
| (9) |
The equilibrium signal from a population without perception R0ed with a reduced infectivity factor σI is [8],
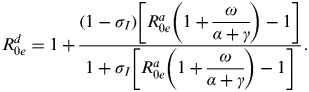 |
(10) |
The equilibrium signal from a population without perception R0ed with a faster recovery factor ε has the form [8],
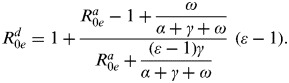 |
(11) |
The MI may be affected by the health behavioural change as a negative feedback. Therefore, we estimated the variance of R0ed varied with behavioural factors to assess the MI caused by behavioural change (MIb) in NM-I and NM-II. We used the MI change ratio (MIc) defined as MIc = (MIb−MI)/MI to assess behavioural change effects on the network BI systems.
RESULTS
BI model simulation
Here we divided the equilibrium structures of the BI model into four different regions during an epidemic. (i) Region I: disease spread only; (ii) region II: both disease and perception spread; (iii) region III: nothing spread; and (iv) region IV: perception spread only (Fig. 2a).
Fig. 2.

Behaviour-influenza model simulation. (a) Four different schemes at equilibrium. (b) Total numbers infected for spread of disease only. (c) Total numbers infected for both disease and perception spread.
Our results showed that the total numbers infected for disease spread only were estimated to be 0–25 given that R0d and R0a change from 2·5 to 3·5 and 1 to 3, respectively (Fig. 2b). Whereas, the total numbers infected for both disease and perception spreads were 0–35 given R0a and R0d changing from 0·1 to 0·9 and 1 to 3, respectively (Fig. 2c). Our results indicated that the total numbers infected in region I was slightly lower than in region II. Moreover, we also revealed that perception spreading might suppress prevalence during the influenza outbreak.
R0 signals in different age groups
Here a lognormal [LN(geometric mean, geometric standard deviation)] model was optimally fitted to the subtype viral titre data to describe viral titres changing over time for individuals aged <18 years [LN(1·66, 1·86), r2 = 0·97, P < 0·01] and ⩾18 years [LN(1·54, 1·51), r2 = 0·54, P < 0·01], respectively (Fig. 3). We found that viral titre peaked at day 1 with a value of 3·4 log TCID50/ml and then decreased over increasing days since illness onset for those aged <18 years (Fig. 3a). On the other hand, the peak value of viral titre in the ⩾18 years age group occurred at day 3 with 4·4 log TCID50/ml (Fig. 3b).
Fig. 3.

Time-dependent viral titre concentrations: (a) <18 years age group, (b) ⩾18 years age group, respectively.
To establish a dose–response profile describing the relationship between viral titre and R0, varied by age group, we used R0 estimates from published data with viral titres of (sub)type influenza virus A(H1N1), A(H3N2), and type B (see Supplementary material). We found that the Hill equation can reasonably fit the R0–viral titre relationship with R0V50 of 3·80 ± 3·08 log TCID50/ml and nH of 2·90 ± 14·95 for the <18 years age group (r2 = 0·54, P< 0·01) (Fig. 4a) and R0V50 = 4·80 ± 4·20 log TCID50/ml and nH = 4·90 ± 19·60 for the ⩾18 year age group (r2 = 0·42, P < 0·01) (Fig. 4b). We also found that estimated median values of R0 were 1·16 (95% CI 1·09–1·68) and 1·01 (95% CI 1·01–1·27) for the <18 and ⩾18 years age groups, respectively (Fig. 4c). We showed that R0 in the <18 years age group had higher variance than in the ⩾18 years age group.
Fig. 4.
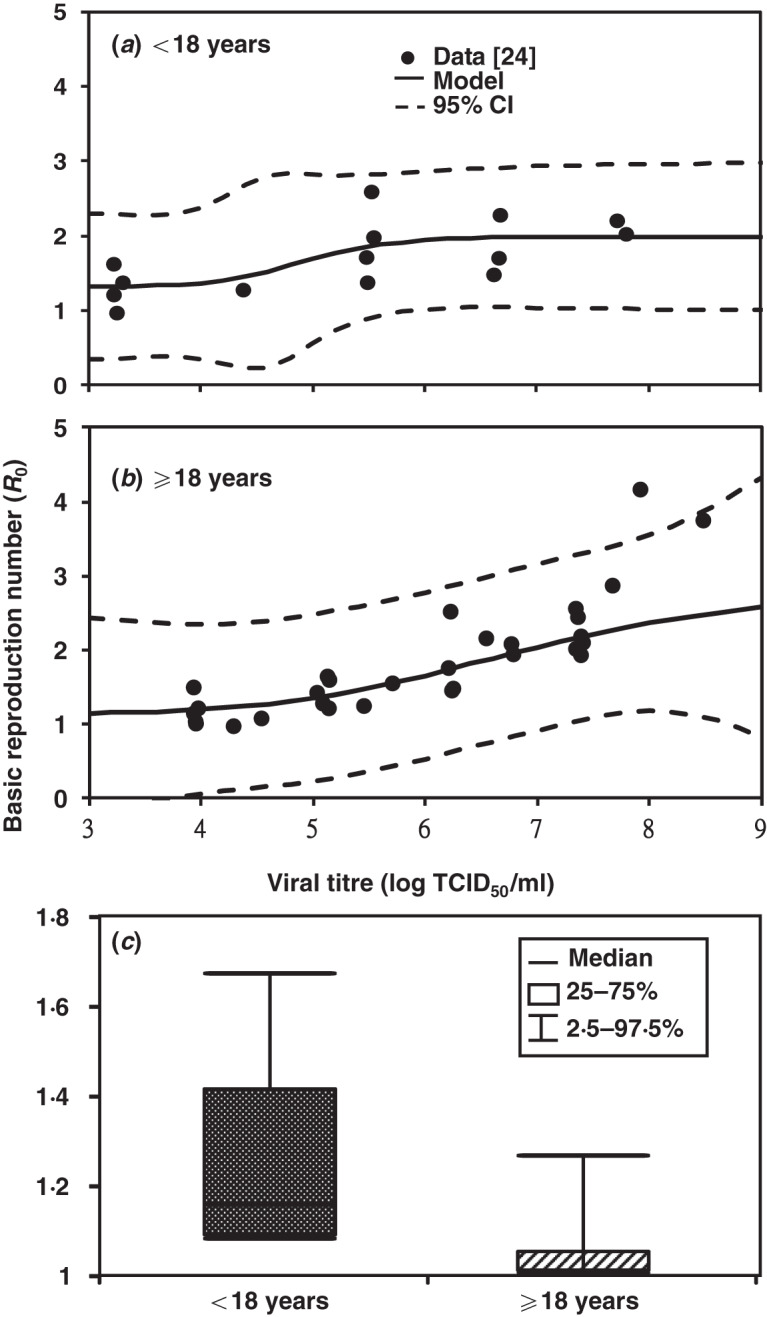
R0 signals in different age groups. (a) R0–viral titre relationship for the <18 years group. (b) R0–viral titre relationship for the ⩾18 years group. (c) basic reproduction number (R0) for the <18 and ⩾18 years age groups, respectively.
Network MI assessment
Figure 5a shows that the LN distribution best describes the model fitting the data, resulting in a R0 variance of LN(1·34, 1·31) (r2 = 0·99, P < 0·05). The correlation coefficient (ρ) can be estimated from the relationship between viral titre data-based infection ratio and viral titre-based R0, resulting in ρ = 0·4 for (sub)type influenza viruses (Fig. 5b). We used the optimal fitted LN function to describe probability distributions of the total numbers infected in region Ι [LN(6·2, 2·8), r2 = 0·99, P < 0·01] and region II [LN(2·6, 0·8), r2 = 0·99, P < 0·01] (Fig. 5c). Moreover, the overlapping percentage (IO) could also be estimated as 62% (Fig. 5c).
Fig. 5.

Network maximum mutual risk perception information (MI). (a) R0 with lognormal (LN) distribution; (b) correlation coefficient (ρ) for subtype influenza virus; (c) probability LN distributions of total numbers infected for regions I and II, respectively, (d) simulated network behaviour-influenza models relationship between the contact number of infectious individuals and maximum mutual risk perception information.
The variance values used in NM-I and NM-II varied by age group and are listed in Table 3. The results showed that the maximum MI in NM-II were higher with estimates ranging from 3·8–5·0 and 3·4–3·6 compared to those in NM-I of 0·7–1·7 and 1·2–2·4 given the contact numbers of infectious individuals changing from 1 to 6 for age groups <18 and ⩾18 years, respectively (Fig. 5d).
Table 3.
Values of variance used in NM-I and NM-II varied by age group
| Parameter | Age group | |
|---|---|---|
| <18 years | ⩾18 years | |
 |
0·21 | 0·59 |
 * *
|
0·14 | |
 † †
|
5·5 × 10−5 | 3·7 × 10−3 |
 ‡ ‡
|
0·9 × 10−3 | 1·4 × 10−3 |
R0, Basic reproduction number; I, infected fraction of the population; IB, information bottleneck.
 is the variance of signal R0 to response I.
Variances of signal R0 to IB varied by age group and are calculated by 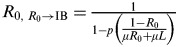 [26]; P is the probability of initial state that does not change to the next stage; μ is the probability of the chance that the mutation pathogen in an adaptive host changes to the next state; L is the expected duration of infection caused by influenza.
Variances of IB to infected ratio I varied by age group and are calculated by  [27], where e is the probability of an infected individuals moving to the recovered state and b is the probability of any host moving to the susceptible state.
Behavioural change assessment
Here we considered different age groups adopting different health behaviours (i.e. reduced susceptibility, reduced infectivity, faster recovery) as over-contact links in NM-I and NM-II. Our results indicated that the MI change ratios (MIc) were higher at 0·15–5·55 for those aged <18 years compared to 0·004–4·44 for those aged ⩾18 years (Fig. 6). We found that the health behaviour of faster recovery could most effectively increase the MIc ranging from 1·11 to 4·44 in the ⩾18 years age group, whereas for those aged <18 years, the health behaviour of reduced infectivity increased the MIc most, ranging from 0·70 to 5·55.
Fig. 6.

Behavioural change effects on the relationship between the contact number of infectious individuals and the MI change ratios for different age groups. (a, b) Reduced susceptibility; (c, d) reduced infectivity; (e, f) faster recovery.
Figure 6 indicates that based on the NM-I model, the MIcs of faster recovery altered most significantly in different age groups. However, the MIcs of reduced susceptibility and reduced infectivity altered most significantly for those aged ⩾18 and <18 years, respectively, in the NM-II model.
DISCUSSION
In this study, we incorporated the information-theoretic framework into a BI transmission dynamics system in order to understand the effects of individual behavioural change on an influenza epidemic. We have shown that individuals with a perceptual state will decrease the prevalence in the disease transmission dynamics system. However, it is a challenging task to know how people acquire available sources of risk perception information and transmit it to others. These situations may cause underestimation of the amount of information flow in estimating mutual risk perception information.
The complete joint distribution between input source and output response has to be measured in order to estimate mutual information in a real-world communication channel. Thus, by carefully choosing the input source (e.g. R0) and output response (e.g. I), we can apply information theory to a broad variety of behaviour-disease transmission systems. In our proposed BI model, P(I|R0) can be readily obtained from a theoretical relationship [22]. However, P(R0) cannot be easily estimated [28]. Hence, the amount of information corresponding to a particular signal source of accurate knowledge of disease can be difficult to assess.
Moreover, transmission capacity of mutual information of risk perception can be easily inferred by determining which P(R0) yields the maximum amount of information. In particular, channel capacity can measure the ability of a specific behaviour-disease system to transfer maximum information and to examine how information is efficiently processed. Thus, the information theory-based initial analyses can be performed without detailed knowledge of the underlying complexity of the system, providing useful insights into what an information transmission system can or cannot achieve [29].
Several researches have suggested that the perceived risk of disease is a determinant of health-protective change on intention or behaviour. However, the different views of perceived risk may result in influences on behaviour change. For example, self-related risk (e.g. ‘I am at risk’) is a more important factor for behaviour change [30–33] than other related risk perceptions (such as an average of groups is at risk). To raise the individual's awareness of differential risks faced may help to mitigate the epidemic. Yet, the comparative aspect of a difference in risk perceptions remains unclear. Recently, risk information has been shown to stimulate fear, worry, anxiety, etc. Such negative emotion factors could affect perceptions and judgements, and even directly associate with a tendency to engage in protective behaviour as a mediator between perceived risk and intention [34, 35].
A minimal age structure was also considered in our model, allowing us to examine age-specific risk perception spread rate and increase model realism [13]. Our results showed that mutual risk perception information can be affected by the ability to acquire accurate information by different age groups. Based on our results, for NM-II, it carried over 3–4 bits. We found that collective individual response can increase mutual risk perception information.
Moreover, children would have a higher mutual risk perception (NM-II) than adults. Given the higher risk perception in children, this study suggests that an authority could focus more on interventions in children such as educational propaganda and vaccination to properly control disease spread. Indeed, children or grandchildren would have more contact with their parents or grandparents than among their peers. Therefore, as long as educational propaganda and vaccination for children is enhanced, the overall disease spread would decline because of reduced susceptibility and infectivity.
Previous studies have found that the differences of health or protective behaviours in terms of their perceived effectiveness and costs depend on varied health behaviour models such as health belief model, subjective expected utility theory, protection motivation theory, and reasoned action theory. Moreover, protective behaviours can be classified into preventive, avoidant, and management of disease behaviours [36]. Renner & Reuter [37] indicated that people need to believe they are at risk in order to take protective action. Liao et al. [38] demonstrated that the term of vaccination planning based on a modified theory of a planned behaviour model can be a more significant determinant of vaccination uptake than vaccination intention.
The scenarios of behaviour change were more sensitive to ‘faster recovery’ based on the NM-I model. Wallace [39] indicated that most active participation in medical decision-making was related to faster recovery. On the other hand, ‘reduced susceptibility’ was the most influential for risk perception based on the NM-II model. This result implies that a susceptible individual becomes more perceptive to disease risk according to reduced susceptibility to the medication they receive. Numerous studies have also indicated that the higher the perception rate is, the quicker individuals respond to the existence of infection, e.g. receiving vaccination for reduced susceptibility [8, 40].
In conclusion, our results show that information transmission of risk perception plays a crucial role in the spread of health-seeking behaviour throughout an influenza epidemic. This paper also shows that the network BI model provides a new approach for understanding and linking the risk perception spread and human behavioural change during an influenza epidemic. We suggest that a monitoring system associated with information flow of risk perception in the contact networks should be constructed to effectively promote health behaviours in preparation for emerging disease outbreaks.
ACKNOWLEDGEMENTS
This work was supported by National Science Council of the Republic of China under grant no. NSC 97-2313-B-002-017-MY3. Comments by two anonymous reviewers on this manuscript are greatly appreciated.
Supplementary material
For supplementary material accompanying this paper visit http://dx.doi.org/10.1017/S0950268814000430.
click here to view supplementary material
DECLARATION OF INTEREST
None.
REFERENCES
- 1.Prati G, Pietrantoni L, Zani B. A social-cognitive model of pandemic influenza H1N1 risk perception and recommended behaviors in Italy. Risk Analysis 2011; 31: 645–645. [DOI] [PubMed] [Google Scholar]
- 2.Coelho FC, Codeço CT. Dynamic modeling of vaccinating behavior as a function of individual beliefs. PLoS Computational Biology 2009; 5: e1000425. [DOI] [PMC free article] [PubMed] [Google Scholar]
- 3.Chen F, et al. Behavioral responses to epidemics in an online experiment: using virtual diseases to study human behavior. PLoS ONE 2013; 8: e5999914. [DOI] [PMC free article] [PubMed] [Google Scholar]
- 4.Salathé M, Khandekwal S. Assessing vaccination sentiments with online social media: implications for infectious disease dynamics and control. PLoS Computational Biology 2011; 7: e1002199. [DOI] [PMC free article] [PubMed] [Google Scholar]
- 5.Slovic P. The Perception of Risk, 2000. London: Earthscan. [Google Scholar]
- 6.Reyna V. Risk perception and communication in vaccination decisions: a fuzzy-trace theory approach. Vaccine 2012; 30: 3790–3797. [DOI] [PMC free article] [PubMed] [Google Scholar]
- 7.Funk S, et al. The spread of awareness and its impact on epidemic outbreaks. Proceedings of the National Academy of Sciences USA 2009; 106: 6872–6877. [DOI] [PMC free article] [PubMed] [Google Scholar]
- 8.Funk S, Gilad E, Jansen VA. Endemic disease, awareness, and local behavioral response. Journal of Theoretical Biology 2010; 264: 501–509. [DOI] [PubMed] [Google Scholar]
- 9.Fenichel EP, et al. Adaptive human behavior in epidemiological models. Proceedings of the National Academy of Sciences USA 2011; 108: 6306–6311. [DOI] [PMC free article] [PubMed] [Google Scholar]
- 10.Poletti P, Ajelli M, Merler S. Risk perception and effectiveness of uncoordinated behavioral responses in an emerging epidemic. Mathematical Biosciences 2012; 238: 80–89. [DOI] [PubMed] [Google Scholar]
- 11.Wells CR, Bauch CT. The impact of personal experiences with infections and vaccination on behaviour-incidence dynamics of seasonal influenza. Epidemics 2012; 4: 139–151. [DOI] [PubMed] [Google Scholar]
- 12.Durham DP, Casman EA. Incorporating individual health-protective decisions into disease transmission models: a mathematical framework. Journal of the Royal Society Interface 2012; 9: 562–570. [DOI] [PMC free article] [PubMed] [Google Scholar]
- 13.Wells CR, Klein EY, Bauch CT. Policy Resistance undermines superspreader vaccination strategies for influenza. PLoS Computational Biology 2013; 9: e1002945. [DOI] [PMC free article] [PubMed] [Google Scholar]
- 14.Epstein JM, et al. Coupled contagion dynamics of fear and disease: mathematical and computational explorations. PLoS ONE 2008; 3: e3955. [DOI] [PMC free article] [PubMed] [Google Scholar]
- 15.Salathé M, et al. A high-resolution human contact network for infectious disease transmission. Proceedings of the National Academy of Sciences USA 2010; 107: 22020–22025. [DOI] [PMC free article] [PubMed] [Google Scholar]
- 16.Cauchemez S, et al. Role of social networks in shaping disease transmission during a community outbreak of 2009 H1N1 pandemic influenza. Proceedings of the National Academy of Sciences USA 2011; 108: 2825–2830. [DOI] [PMC free article] [PubMed] [Google Scholar]
- 17.Poletti P, Ajelli M, Merler S. The effect of risk perception on the 2009 H1N1 pandemic influenza dynamics. PLoS ONE 2011; 6: e16460. [DOI] [PMC free article] [PubMed] [Google Scholar]
- 18.Zhao K, Karsai M, Bianconi G. Entropy of dynamical social networks. PLoS ONE 2011; 6: e2816. [DOI] [PMC free article] [PubMed] [Google Scholar]
- 19.Hernández-Lemus E, Siqueiros-García JM. Information theoretical methods for complex network structure reconstruction. Complex Adaptive Systems Modelling 2013; 1: 8. [Google Scholar]
- 20.Colizza V, et al. The role of the airline transportation network in the prediction and predictability of global epidemics. Proceedings of the National Academy of Sciences USA 2005; 103: 2015–2020. [DOI] [PMC free article] [PubMed] [Google Scholar]
- 21.Quax R, et al. Inferring epidemiological parameters from phylogenetic information for the HIV-1 epidemic among MSM. European Physical Journal Special Topics 2013; 222: 1347–1358. [Google Scholar]
- 22.Anderson RM, May RM. Infectious Disease of Humans: Dynamics and Control. Oxford: Oxford University Press, 1991. [Google Scholar]
- 23.Cover TM, Thomas JA. Elements of Information Theory, 2nd edn. Hoboken: Wiley-Interscience, 2006. [Google Scholar]
- 24.Watanabe T, et al. Dose-response assessment for influenza A virus based on data sets of infection with its live attenuated reassortants. Risk Analysis 2012; 32: 555–565. [DOI] [PubMed] [Google Scholar]
- 25.Greenbaum BD, et al. Viral reassortment as an information exchange between viral segments. Proceedings of the National Academy of Sciences USA 2012; 109: 3341–3346. [DOI] [PMC free article] [PubMed] [Google Scholar]
- 26.André JB, Day T. The effect of disease life history on the evolutionary emergence of novel pathogens. Proceedings of the Royal Society of London, Series B: Biological Sciences 2005; 272: 1949–1956. [DOI] [PMC free article] [PubMed] [Google Scholar]
- 27.Gordo I, et al. Genetic diversity in the SIR model of pathogen evolution. PLoS ONE 2009; 4: e4876. [DOI] [PMC free article] [PubMed] [Google Scholar]
- 28.Yang Y, et al. The transmissibility and control of pandemic influenza A (H1N1) virus. Science 2009; 326: 729–733. [DOI] [PMC free article] [PubMed] [Google Scholar]
- 29.Liepe J, et al. Maximizing the information content of experiments in systems biology. PLoS Computational Biology 2013; 9: e1002888. [DOI] [PMC free article] [PubMed] [Google Scholar]
- 30.Weinstein ND. Testing four competing theories of health-protective behavior. Health Psychology 1993; 12: 324–333. [DOI] [PubMed] [Google Scholar]
- 31.Renner B, Schupp H. The perception of health risk. In: Friedman HS, ed. The Oxford Handbook of Health Psychology. New York: Oxford University Press. 2011; pp. 639–667. [Google Scholar]
- 32.Alkuwari MG, et al. Pandemic influenza A/H1N1 vaccination uptake among health care workers in Qatar: motivators and barriers. Vaccine 2011; 29: 2206–2011. [DOI] [PubMed] [Google Scholar]
- 33.Drees M, et al. Sustained high influenza vaccination rates and decreases safety concerns among pregnant women during the 2010–2011 influenza season. Vaccine 2013; 31: 362–366. [DOI] [PubMed] [Google Scholar]
- 34.Senay I, Hensley-Alford S, Kaphingst KA. Judging risk for multiple diseases: the role of disease worry. Journal of Health Psychology 2013; 18: 554–560. [DOI] [PMC free article] [PubMed] [Google Scholar]
- 35.Ferrer RA, Portnoy DB, Klein WM. Worry and risk perceptions as independent and interacting predictors of health protective behaviors. Journal of Health Communication 2013; 18: 397–409. [DOI] [PubMed] [Google Scholar]
- 36.Bish A, Michie S. Demographic and attitudinal determinants of protective behaviours during a pandemic: a review. British Journal of Health Psychology 2010; 15: 797–824. [DOI] [PMC free article] [PubMed] [Google Scholar]
- 37.Renner B, Reuter T. Predicting vaccination using numerical and affective risk perception: the case of A/H1N1 influenza. Vaccine 2012; 30: 7019–7026. [DOI] [PubMed] [Google Scholar]
- 38.Liao Q, et al. Factors affecting intention to receive and self-reported receipt of 2009 pandemic (H1N1) vaccine in Hong Kong: a longitudinal study. PLoS ONE 2011; 6: e17713. [DOI] [PMC free article] [PubMed] [Google Scholar]
- 39.Wallace LM. Communication variables in the design of presurgical preparatory information. British Journal of Clinical Psychology 1986; 25: 111–118. [DOI] [PubMed] [Google Scholar]
- 40.Sahneh FD, Chowdhury FN, Scoglio CM. On the existence of a threshold for preventive behavioral responses to suppress epidemic spreading. Scientific Reports 2012; 2: 632. [DOI] [PMC free article] [PubMed] [Google Scholar]
Associated Data
This section collects any data citations, data availability statements, or supplementary materials included in this article.
Supplementary Materials
For supplementary material accompanying this paper visit http://dx.doi.org/10.1017/S0950268814000430.
click here to view supplementary material