Abstract
Studies have shown exosomal circRNAs can regulate the immune escape of tumors by carrying cancer‐derived molecules. Regulatory T cells (Tregs) participate in the process of tumor immune escape. However, the mechanism by which exosomal circRNAs regulate Tregs to create a microenvironment for tumor immune escape is unclear. The effect of exosomes on the proliferation, migration, and invasion of tumor cells was evaluated by CCK‐8, transwell, and wound‐healing assays. The expression of circGSE1 was evaluated by real‐time quantitative PCR, and the function of exosomal circGSE1 was explored by Western blot and RNA pull‐down assays. In vivo animal metastasis models and bioluminescence imaging were used to verify the effect of exosomal circGSE1 on tumor progression. Collectively, we revealed that exosomal circGSE1 derived from hepatocellular carcinoma (HCC) cells promotes the progression of HCC by inducing Tregs expansion via regulating the miR‐324‐5p/TGFBR1/Smad3 axis. Therefore, in the future, exosomal circGSE1 can be used as a promising biomarker for immunotherapy of HCC.
Keywords: circGSE1, exosome, hepatocellular carcinoma, immunotherapy, Tregs
Schematic of the action of cancer cell–derived exosomal circGSE1 promotes the immune escape of hepatocellular carcinoma by inducing Tregs expansion.

Abbreviations
- APC
antigen‐s
- CCK‐8
cell‐counting kit‐8
- circRNAs
circular RNAs
- ELISA
enzyme‐linked immunosorbent assay
- FISH
fluorescence in situ hybridization
- HCC
hepatocellular carcinoma
- IHC
immunohistochemistry
- NTA
nanoparticle‐tracking analysis
- PBMCs
peripheral blood mononuclear cells
- qRT‐PCR
quantitative reverse‐transcription polymerase chain reaction
- TGF‐β
transforming growth factor‐β
- Tregs
regulatory T cells
1. INTRODUCTION
Hepatocellular carcinoma (HCC) is reported to be the fifth most common cancer in the world. 1 In the past few decades, the widespread application of immunotherapy in cancer has greatly changed the prognosis of cancer patients. 2 An increasing number of clinical trials are being carried out to explore the efficacy of PD1 inhibitors in advanced liver cancer. However, the phase 3 clinical trials that have been carried out so far have not achieved the expected efficacy. 3 Therefore, it is necessary to find new targets for immunotherapy of liver cancer. Antigen presentation, antigen recognition, T cell activation and migration, and the killing of tumor cells by effector T cells constitute the immune response of cancer. 4 , 5 The results of single‐cell sequencing in liver cancer tissues showed that CD8+ T cells in liver cancer tissues were exhausted and the expansion of regulatory T cells (Tregs) was promoted. 6 Tregs secrete immunosuppressive factors to inhibit the function of CD8+ T cells, causing tumor immune escape. 7 An increasing number of studies have shown exosomes regulate the immune escape of tumors by carrying cancer‐derived molecules. 8 , 9 However, the relationship between HCC‐derived exosomes and Treg is unclear.
Circular RNA (circRNA) has been identified as a noncoding RNA with a closed‐loop structure and no 5' and 3' ends, which mainly acts as miRNA sponge. 10 , 11 , 12 , 13 A recent study also found that cancer cell–derived exosomal circUHRF1 can participate in the tumor immune escape process by inducing natural killer cell depletion. 14 However, the specific mechanism by which cancer‐derived exosomal circRNA regulates Tregs to participate in tumor immune escape is still unclear.
Notably, the TGF‐β signaling pathway not only inhibits the production of CD8+ effector T cells, but also participates in promoting the expansion of Tregs. 15 , 16 In this study, we first demonstrated that HCC cell–derived exosomal circGSE1 promotes the progression of HCC by inducing Tregs expansion via regulating the miR‐324‐5p/TGFBR1/Smad3 axis. Therefore, our study reveals the carcinogenic effect of exosomal circGSE1 in the progression of HCC cells and provides a new theoretical basis for the study of exosomal circRNAs in HCC immunotherapy.
2. MATERIALS AND METHODS
2.1. Patient samples and ethical statement
From the Fourth Affiliated Hospital of China Medical University, 30 matched HCC cancer and paracancerous tissues and blood samples of 40 HCC patients were collected. For each tumor, age, gender, tumor size (cm), TNM stage, lymph node status, and vascular invasion are shown in Table 1. The study was approved by the Ethics Committee of the Fourth Affiliated Hospital of China Medical University.
TABLE 1.
Relationship between circGSE1 expression and clinicopathologic parameters of patients with hepatocellular carcinoma (HCC)
| Variables | No. of patients | circGSE1 expression | P value | |
|---|---|---|---|---|
| Low (n = 20) | High (n = 20) | |||
| Gender | ||||
| Female | 19 | 12 | 7 | 0.113 |
| Male | 21 | 8 | 13 | |
| Age (year) | ||||
| ≤60 | 18 | 7 | 11 | 0.204 |
| >60 | 22 | 13 | 9 | |
| Tumor size (cm) | ||||
| ≤5 | 16 | 12 | 4 | 0.010 |
| >5 | 24 | 9 | 15 | |
| TNM stage | ||||
| I + II | 23 | 15 | 8 | 0.025 |
| III + IV | 17 | 5 | 12 | |
| Lymph node metastasis | ||||
| Negative | 14 | 10 | 4 | 0.047 |
| Positive | 26 | 10 | 16 | |
| Vascular invasion | ||||
| Negative | 25 | 16 | 9 | 0.022 |
| Positive | 15 | 4 | 11 | |
2.2. Cell culture
Six HCC cell lines including HepG2, Huh7, PLC, HCCLM3, SMMC‐7721, and Hep3B were cultured in DMEM (Biological Industries) supplemented with 10% fetal bovine serum (FBS) (Biological Industries). The temperature of the incubator was controlled at 37°C, and the CO2 concentration was 5%.
2.3. Human CD3+ T cell and Tregs isolation and culture
CD3+ T cells were sorted from peripheral blood mononuclear cells (PBMCs) of healthy individuals using FACSAria Fusion (BD Biosciences). Sorted CD3+ T cells were stimulated with anti‐CD3 mAb (clone: OKT3) (eBioscience, 16‐0037‐81) and anti‐CD28 mAb (clone: CD28.2) (eBioscience, 14‐0289‐82), plus TGF‐β1 (MCE, A279‐S390), while cultured in RPMI‐1640 (GIBCO) containing 10% FBS and 150 IU/mL recombinant human interleukin‐2 (IL‐2) (Novoprotein).
Tregs were extracted in PBMC using the regulatory CD4+/CD25+ T cell kit (Invitrogen, 1363D), stimulated with anti‐CD3 mAb and anti‐CD28 mAb, and then cultured in RPMI‐1640 containing 10% FBS and 150 IU/mL recombinant human IL‐2.
2.4. Plasmid generation and cell transfection
SiRNAs targeting circGSE1, TGFBR1, and Smad3 and miR‐324‐5p mimics/inhibitors were all designed and synthesized by GeneChem. The cells were then transfected with the Lipofectamine™ 3000 kit (ThermoFisher Scientific) according to the manufacturer's instructions.
2.5. Transmission electron microscopy (TEM)
Exosomes were extracted by ultraspeed ultracentrifugation as described above. 17 The purified exosomes were resuspended in 100 μl 1 × PBS. A total of 5 μl exosome suspension was added to a formvar‐carbon sample copper net and fixed with 1% glutaraldehyde solution for 20 minutes. Then, 50 μl of uranyl oxalate was dropped on the copper mesh at pH 7 for 5 minutes and 50 µl of methylcellulose‐UA onto the copper mesh for 10 minutes. The copper mesh was dried in the air for 10 minutes and finally photographed at 80 kV with FEI TecnaiG2 spirit transmission electron microscope.
2.6. Nanoparticle‐tracking analysis (NTA)
As mentioned above, the purified exosomes were resuspended in PBS and analyzed and identified using the 301 NanoSight NS300 system. 18
2.7. Exosome labeling and tracking
PKH26 red fluorescent membrane linker dye (Sigma) was used to stained the purified exosomes. The labeled exosomes were cocultured with T cells. Fluorescence microscopy was used to observe the uptake process of T cells in exosomes.
2.8. Transwell assay
For the migration experiments, 600 µl of medium containing 10% FBS was added to the lower chamber and 100 µl of tumor cell suspension to the upper chamber at first. After incubating at 37°C for 24 hours, the cells were fixed with 4% paraformaldehyde. The chamber was taken out, the upper chamber liquid was blotted, and the cells were stained with 0.1% crystal violet for 30 minutes. Finally, the cells were wiped off on the surface of the upper chamber with a cotton ball and observed under a microscope. Different from the migration experiment, in the invasion experiment, the insert membranes of the upper chamber first had to be coated with Matrigel (50 mL/well) (BD Biosciences). The other steps are consistent with the migration experiment.
2.9. Wound‐healing assay
Hepatocellular carcinoma cells were treated with or without exosome‐treated T cell–conditioned medium for 24 hours and then seeded in a six‐well plate. A 200‐μl sterile pipette tip was used to scratch the petri dish, and the scratched cells were removed by washing with 1 × PBS. Pictures were taken of the scratches at 0 and 48 hours.
2.10. Cell‐counting kit‐8 assay (CCK‐8)
Hepatocellular carcinoma cells treated with or without exosome‐treated T cell–conditioned medium for 24 hours were planted to 96‐well plates. Then, 10 μl CCK‐8 (Beyotime) was added to each well, and the cells were incubated at 37°C for 1 hour. Afterward, an automatic microplate reader (Synergy4; BioTek) was used to measure the absorbance at 450 nm.
2.11. Western blot
Total protein was separated by SDS‐PAGE gel and transferred onto polyvinylidene difluoride membranes (Millipore). After being blocked in 5% nonfat milk for 1 hour, the protein on membranes was incubated overnight at 4°C with the indicated primary antibodies. The primary antibodies were anti‐E‐cadherin (Abcam, ab76055), anti‐N‐cadherin (Abcam, ab76011), anti‐vimentin (Abcam, ab20346), anti‐TGFBR1 (Abcam, ab92486), anti‐Smad3 (Abcam, ab40854), and anti‐β‐actin (Proteintech, 20536‐1‐AP). The protein was then incubated with secondary antibodies for 1 hour at room temperature and observed with ECL chemiluminescence reagent (Millipore).
2.12. Bioinformatics analysis
Screen the differentially expressed circRNA from the GEO database (GSE100206and GSE100207). CircGSE1 sequence data were obtained from circBase (http://www.circbase.org/). The target miRNAs of circGSE1 and the target gene of miRNAs were predicted through starBase 2.0 (http://starbase.sysu.edu.cn/index.php) and TargetScan (https://www.targetscan.org/vert_72/).
2.13. Quantitative reverse‐transcription polymerase chain reaction (qRT‐PCR)
TRIzol reagent (Invitrogen) was used to extract total RNA of cells or tissues. Then, 1 μg total RNA was added to a 10‐μl final volume of mixed reagent to reverse transcription. Quantitative RT‐PCR was performed with SYBR Green PCR Master Mix (Vazyme) using an ABI Prism 7900 sequence detection system (Applied Biosystems). U6 (Rnu6–1) was used as an endogenous control for miRNA, GAPDH was used as an internal control, and the results of each sample were normalized to U6 or GAPDH expression.
2.14. Luciferase reporter assays
CircGSE1‐wt/mut or TGFBR1‐wt/mut were cotransfected with miR‐324‐5p/miR‐744‐5p mimics or control into T cells with Lipofectamine™ 3000 (Invitrogen). Cell lysates were collected 48 hours after transfection, and then the firefly and Renilla luciferase activities were measured using a dual‐luciferase reporter gene detection kit (Promega) according to the manufacturer's protocol.
2.15. Immunohistochemistry (IHC)
Immunohistochemistry staining was performed using the streptavidin‐biotin‐peroxidase complex method. In short, liver cancer tissue samples underwent several processes, including fixation, paraffin embedding, dewaxing, rehydration, and antigen retrieval. Then, samples were stained with CD63 (Proteintech, 25682‐1‐AP) or Foxp3 (Abcam, ab20034) antibody at 44°C overnight, incubated in secondary biotinylated antibody for 30 minutes at 37°C, visualized with DAB solution, and counterstained with hematoxylin. Finally, paraffin sections were sealed for microscopic observation.
2.16. RNA fluorescence in situ hybridization (FISH)
T cells were first made into paraffin sections. After permeabilized in PBS with 0.5% Triton X‐100, the cells were hybridized in hybridization buffer with Cy3‐labeled circGSE1 probes at 37°C overnight. The hybridization buffer was then gradually washed off with 4× SSC (including 0.1% Tween‐20), 2× SSC, and 1× SSC at 42°C. Then, the nucleus was stained with DAPI for 10 minutes, and finally the results were observed with a TCS SP2 AOBS confocal laser microscope.
2.17. Flow cytometry (FCM)
The antibodies used in FCM analysis included the following: APC‐CD4 (BD biosciences, 561840), PE‐FOXP3 (eBioscience, 12‐4776‐41), and FITC‐CD8a (eBioscience, 11‐0088‐42). Cells were washed with washing solution and stained with surface antibody and fixable viability dye (ThermoFisher Scientific). Then, intracellular antibodies and Foxp3/transcription factor staining buffer set (ThermoFisher Scientific) were used for intracellular staining according to the manufacturer's protocol. All FCM assays were finished by Becton Dickinson FACS Calibur flow cytometer.
2.18. RNA pull‐down
The biotin‐labeled circGSE1 probe/negative control probe was synthesized by RiboBio Biotech. T cells were transfected with circGSE1‐overexpressing vector or control vector. After 48 hours, the biotinylated‐circGSE1 probe was incubated with C‐1 magnetic beads (Life Technologies), generating probe‐coated beads. Then, the coated beads were incubated with sonicated T cells at 4°C overnight. The bound RNA complex is eluted from the beads and purified using the RNeasy Mini Kit (Qiagen). The abundance of miRNA was detected by qRT‐PCR analysis.
2.19. Enzyme‐linked immunosorbent assay (ELISA)
IFN‐γ in T cell supernatant were detected by the human IFN‐γ ELISA kit (Proteintech, 15365‐1‐AP) according to the manual. Samples were detected at 450‐nm/630‐nm absorbance with an automatic microplate reader, followed by adding Stop Solution.
2.20. In vivo metastasis
C57 male mice (6 weeks old) were injected with HCC cells (1 × 10⁶) (n = 3/per group) mixed with the HCC‐exo–induced T cells, or T cells induced by HCC‐exo that had been transfected with NC‐overexpression (OE)/circGSE1‐OE. The bioluminescence was monitored weekly. After about 4 weeks, the representative bioluminescence imaging of metastases was measured by a Xenogen IVIS 2000 luminal imager.
2.21. Statistical analysis
All statistical analyses were performed in SPSS 25.0 software (SPSS Inc.). GraphPad Prism 8.0 (GraphPad Software) was used to generate graphs. Statistical significance for comparing two or more groups was determined by Student's t test or one‐way ANOVA. When P value <0.05, the difference is considered statistically significant.
3. RESULTS
3.1. HCC‐derived exosomes enhance HCC proliferation, migration, and invasion
It is reported that exosomes derived from HCC are related to tumor progression. 19 In order to verify the mechanisms, we isolated HCC cell (Huh7 and HepG2)‐derived exosomes from the supernatant. Nanoparticle‐tracking analysis showed that these exosomes had a double‐layer membrane structure with a size of about 80‐100 nm, which was in line with the size and morphology of common exosomes (Figure 1A and B). The expression level of CD63 (exosomal marker) detected by IHC in liver cancer tissues was significantly higher than that in nontumor tissues (Figure 1C). Cell‐counting kit‐8 showed exosomes significantly increased the proliferation of HCC cells (Figure 1D). Additionally, wound‐healing and transwell analysis showed that HCC‐derived exosomes markedly enhanced the migration and invasion capabilities of HCC cells (Figure 1E and F). Western blot results showed that HCC‐derived exosomes reduced the expression level of E‐cadherin, an epithelial cell marker, while increased the expression level of N‐cadherin and vimentin, which served as mesenchymal cell markers (Figure 1G). To study the role of HCC‐derived exosomes in HCC metastasis, mice were injected with control/exosome‐treated HCC cells via tail vein. Then, using a live animal bioluminescence imaging system, it was found that exosomes significantly increased the metastasis of Huh7 (Figure 1H). These results demonstrate that exosomes derived from HCC cells increase the ability of HCC to proliferate, migrate, and invade.
FIGURE 1.
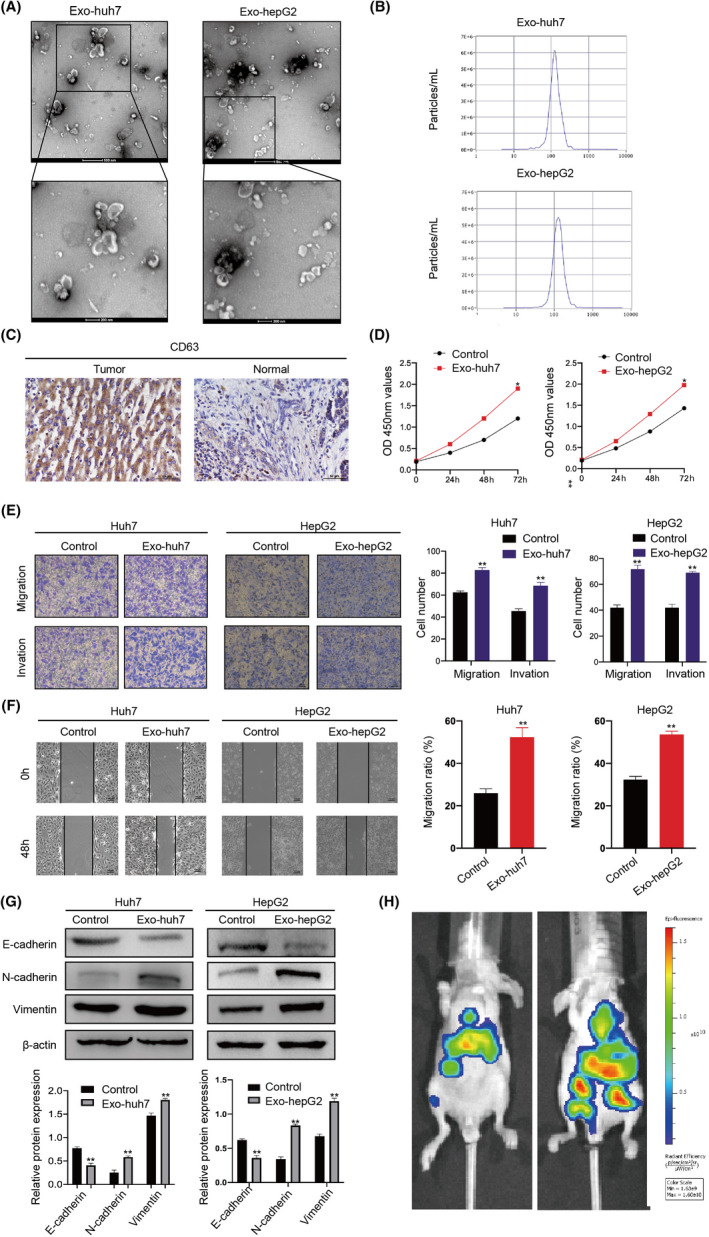
Hepatocellular carcinoma (HCC)‐derived exosomes enhance HCC proliferation, migration, and invasion. A, Identifying the size and morphology of exosomes by TEM (scale bar = 200nm and 100nm). B, Identifying the size of HCC‐derived exosomes by nanoparticle‐tracking analysis (NTA). C, Detecting CD63 expression in normal and HCC tissues by immunohistochemistry (IHC). D, Proliferation ability of HCC cells treated with or without HCC cell–derived exosomes was determined by CCK‐8. E, Migration and invasion ability of HCC cells treated with or without exosomes detected by Transwell. F, Scratch wound–healing assays in Huh7 and HepG2 cells treated with or without exosomes. G, Western blots of E‐cadherin, N‐cadherin, and vimentin expression in Huh7 and HepG2 cells after being treated with exosomes. Densitometry shows relative protein expression normalized for β‐actin loading control. H, C57 mice were injected with control/exosome‐treated Huh7 cells via the tail vein (n = 3/per group). Bioluminescence imaging system was used to monitor the metastasis of HCC cells. All data are means ± SD; n = 3, *p < 0.05, **p < 0.01, ***p < 0.001
3.2. HCC‐derived exosomes enhance HCC proliferation, migration, and invasion via inducing Tregs expansion
Tregs in tumor‐infiltrating lymphocytes regulate the immune escape process of tumors by inhibiting the activation of CD4+ T cells and CD8+ effector T cells. 5 Therefore, we explored the effect of HCC‐derived exosomes on the proliferation of Treg. Isolated exosomes from Huh7 and HepG2 cells were labeled with PKH26 dye and incubated with T cells for 48 hours. Confocal microscopy observed red‐labeled exosomes in T cells, indicating that T cells can take up exosomes (Figure 2A). At first, IHC results showed that the expression of Tregs marker protein FOXP3 in liver cancer tissues was significantly higher than that in nontumor tissues (Figure 2B). Furthermore, after extracting T cells from PBMCs, stimulating them based on TCR signaling, and co‐culturing the activated T cells with exosomes, FCM results showed the percentage of effector Treg (eTreg) (FoxP3hiCD45RA−) in CD4+ T cells was significantly increased in exosome‐stimulated T cells, while exosomes could not directly promote the proliferation of Tregs (Figure 2C and D). This indicates that exosomes promote the differentiation of CD4+ T cells into Tregs. The role of Treg proliferation induced by HCC‐derived exosomes in the progression of HCC was detected by indirect coculture system (Figure 2E). CCK‐8 results showed that T cells treated with HCC‐derived exosomes significantly enhanced the proliferation of HCC cells (Figure 2F). Additionally, wound‐healing and transwell assays indicated that exosome‐treated T cells significantly enhanced the migration and invasion ability of HCC (Figure 2G–J). Collectively, the results showed that HCC‐derived exosomes promote the proliferation, migration, and invasion of HCC by inducing Treg expansion.
FIGURE 2.
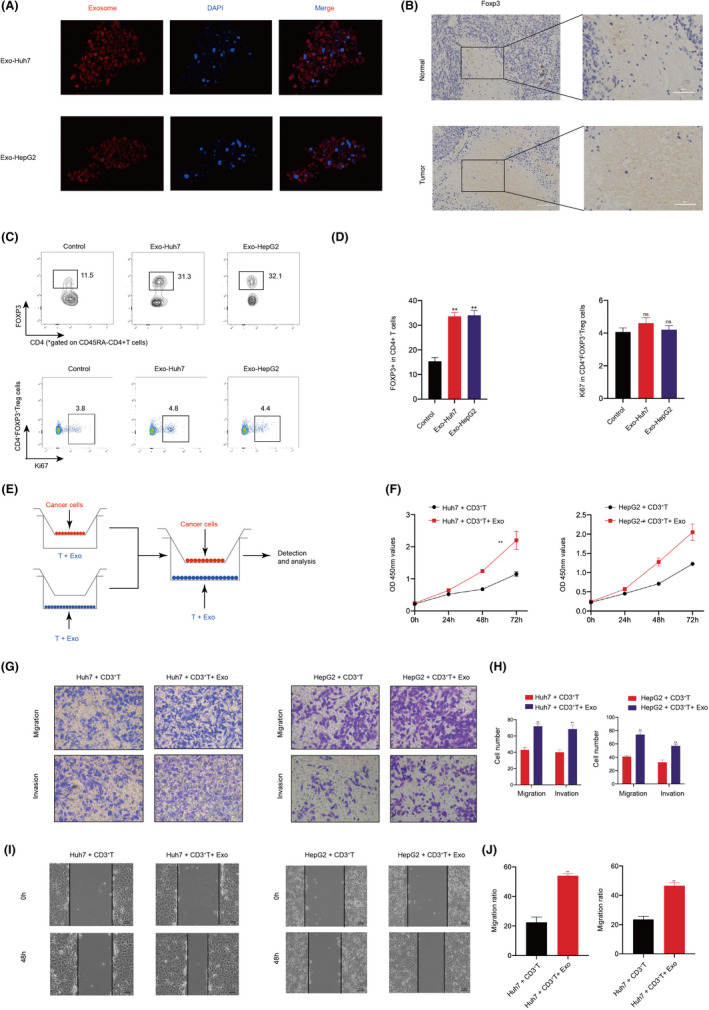
Hepatocellular carcinoma (HCC)‐derived exosomes enhance HCC proliferation, migration, and invasion via inducing Tregs expansion. A, Confocal observation of the internalization of PKH26‐labeled HCC (Huh7 and HepG2)‐derived exosomes (red) by T cells. B, Expression of Foxp3 (Treg marker) was examined by immunohistochemistry (IHC) in normal and HCC tissues. C, Proportion of FOXP3+ in CD4+ T cells and proportion of Ki67+ cells in CD4+ FOXP3+ Tregs. D, Frequencies of FOXP3+ in CD4+ T cells and Ki67+ cells in CD4+ FOXP3+ Tregs. E, Schematic illustration of the indirect coculture system. F, Proliferation ability of HCC cells cocultured with exosome‐treated T cells was determined by CCK8. G, Migration and invasion ability of HCC cells cocultured with T cells treated with or without exosomes using Transwell. H, Quantitative analysis of the number of migrating and invading cells. I, Migration capacity of HCC cells cocultured with T cells treated with or without exosomes was examined by wound‐healing assays. J, Quantitative analysis of the number of migrating cells. All data are means ± SD; n = 3, *p < 0.05, **p < 0.01, ***p < 0.001
3.3. CircGSE1 is significantly upregulated in T cells with tumor‐derived exosome addition
The data in the microarray GSE100206and GSE100207were used to explore several differentially expressed circRNAs in blood exosomes of HCC patients and normal people. On the basis of log2 (fold change) ≥ 1 and p < 0.05, the volcano plot shows the difference in circRNA expression (Figure 3A). The heat map showed circGSE1 is the most upregulated circRNA in the exosomes from HCC patients’ serum (Figure 3B). CircGSE1 (hsa_circ_0000722, chr16:85667519‐85667738) was derived from the protein‐coding locus GSE1, which is generated by backsplicing of the second exon of the GSE1 gene with several Alu elements in introns on both sides (Figure 3C and D). Immediately afterward, qRT‐PCR found that the expression level of circGSE1 in HCC tissues was significantly higher than that of adjacent nontumor tissues (Figure 3E). Additionally, Kaplan‐Meier survival analysis showed that the overall survival (OS) of patients with higher circGSE1 expression levels was significantly shorter than that of patients with lower circGSE1 expression (Figure 3F). Then, qRT‐PCR results also showed circGSE1 was significantly upregulated in Huh7 and HepG2 cells compared with other cell lines (Figure 3G). For further analysis, we explored the effect of exosomal circGSE1 derived from the serum of HCC patients and HCC cells on circGSE1 in T cells. Quantitative RT‐PCR showed that after T cells were added with exosomes derived from serum, Huh7, and HepG2 cells, circGSE1 in T cells was markedly higher than that in the control group (Figure 3H and I). To further verify that HCC‐derived exosomes can carry circGSE1 into T cells, we transfected circGSE1 siRNA into T cells, and qRT‐PCR assays validated that knockdown of circGSE1 significantly reduced the expression of circGSE1. However, after T cells were cocultured with Huh7‐ and HepG2‐derived exosomes, the expression of circGSE1 in T cells increased significantly (Figure 3J). In general, circGSE1 was significantly upregulated in T cells treated with tumor‐derived exosomes.
FIGURE 3.
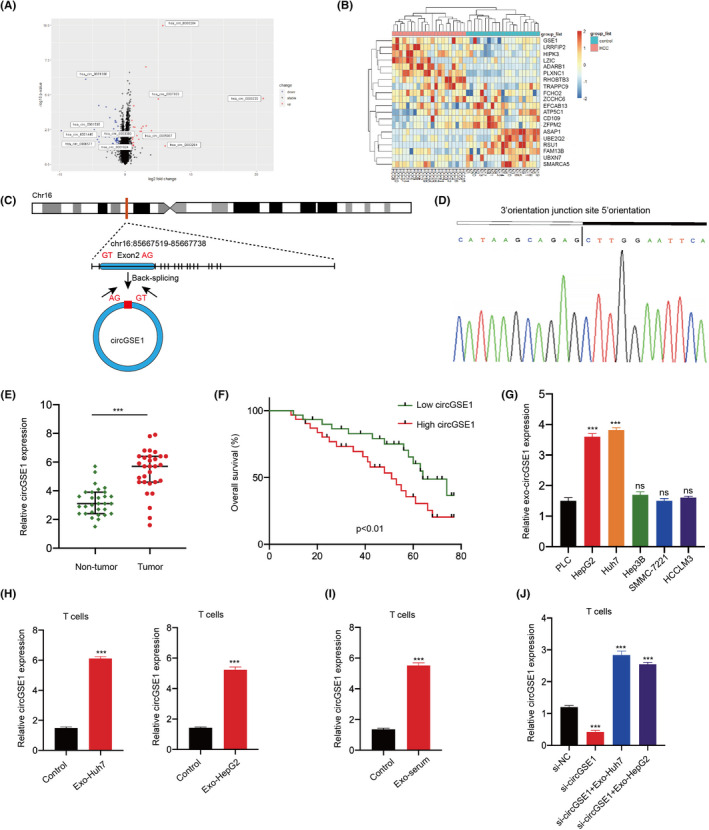
CircGSE1 was significantly upregulated in T cells cultured with hepatocellular carcinoma (HCC)‐derived exosomes. A, Volcano map of cirRNA expression profile composed of 21 pairs of HCC patients’ and healthy human serum exosomes. B, Heat map of cirRNA expression profile composed of 21 pairs of HCC patients’ and healthy human serum exosomes. C, Structure of circGSE1 elements in the flanking sequence. D, Back‐splicing sequence and junction site of circGSE1. E, Expression of circGSE1 in HCC tissues and adjacent nontumor tissues of 30 patients. F, Kaplan‐Meier analysis of overall survival in 40 patients with HCC according to circGSE1 expression (logrank test). G, Expression level of circGSE1 in six liver cancer cell lines (PLC, HepG2, Huh7, Hep3B, SMMC‐7221, HCCLM3). H, Quantitative RT‐PCR analyses of circGSE1 in T cells after adding HCC‐derived exosomes (Huh7 and HepG2 cells). I, Quantitative RT‐PCR analyses of circGSE1 mRNA in T cells after adding HCC patients’ serum–derived exosomes (Exo‐serum). J, Quantitative RT‐PCR analyses of circGSE1 in T cells after being transfected with si‐NC or si‐circGSE1 either with or without the addition of HCC‐derived exosomes. All data are means ± SD; n = 3, *p < 0.05, **p < 0.01, ***p < 0.001
3.4. circGSE1 acts as a sponge for miR‐324‐5p
Studies have found that circRNA is mainly present in the cytoplasm and produces a sponge effect by binding to miRNA. 20 FISH results showed that circGSE1 transcription signals were abundant in the cytoplasm of T cells, while there was little hybridization signal in the nucleus (Figure 4A). To find potential miRNAs that can bind to circGSE1, StarBase 2.0 (http://starbase.sysu.edu.cn/) and TargetScan (https://www.targetscan.org/vert_72/) were used to predict the potential complementary miRNAs. MiR‐324‐5p, miR‐744‐5p, and miR‐138‐5p were predicted to bind to circGSE1. Quantitative RT‐PCR results showed that miR‐324‐5p and miR‐744‐5p were downregulated in circGSE1‐overexpressing T cells (Figure 4B). Dual‐luciferase reporter gene assay found that miR‐324‐5p mimics significantly reduced the luciferase activity of the circGSE1‐miR‐324‐5p groups but had no effect on the circGSE1‐miR‐324‐5p mutant group (Figure 4D). However, miR‐744‐5p mimics did not affect the luciferase activity of circGSE1‐miR‐744‐5p (Figure 4D). Then, an RNA pull‐down assay was carried out to assess the relationship between miR‐324‐5p/miR‐744‐5p and circGSE1. Results showed that biotinylated circGSE1 probe significantly pulled down circGSE1 and miR‐324‐5p, but not miR‐744‐5p in T cells upon circGSE1 overexpression (Figure 4E). In addition, we found that the expression of miR‐324‐5p in T cells cocultured with HCC exosomes was significantly reduced (Figure 4F). Additionally, we transfected circGSE1 siRNA into Huh7 and HepG2 cell lines. Then, we found that the exosomes of HCC knocking down circGSE1 did not increase miR‐324‐5p expressions in T cells (Figure 4G). These results demonstrated that circGSE1 acts as a sponge for miR‐324‐5p.
FIGURE 4.
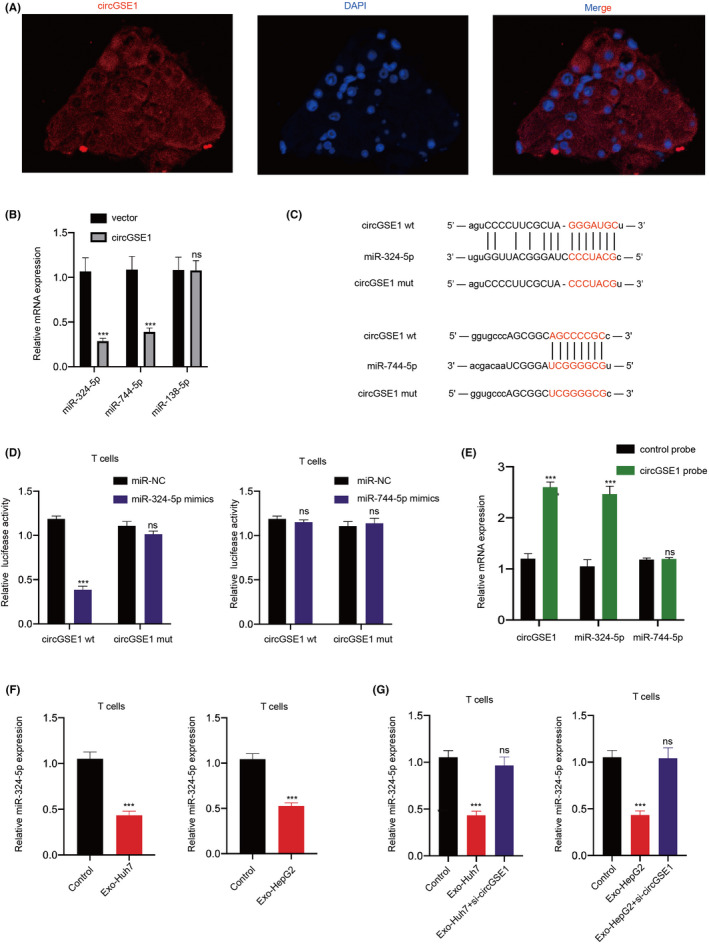
circGSE1 acts as a sponge for miR‐324‐5p. A, Distribution of circGSE1 in T cells after treatment with exosomes detected by FISH. B, Quantitative RT‐PCR analyses of miR‐324‐5p, miR‐744‐5p, and miR‐138‐5p in T cells transfected with control vector or circGSE1 plasmid. C, Schematic diagram of circGSE1 with the predicted binding site for miR‐324‐5p and miR‐744‐5p. D, Luciferase reporter gene assay was carried out to check the binding ability between miR‐324‐5p/miR‐744‐5p and circGSE1. Reporter constructs containing either circGSE1wt or circGSE1mut at the predicted miR‐324‐5p/miR‐744‐5p target sequences were cotransfected into T cells, along with miR‐324‐5p/miR‐744‐5p mimics or miR‐NC, (Negative Control). E, Lysates prepared from circGSE1‐overexpressing T cells were incubated with biotinylated probes for circGSE1, and then RNA pull‐down assay was performed. The expression of circGSE1 and miR‐324‐5p was detected by qRT‐PCR. F, Quantitative RT‐PCR analyses of miR‐324‐5p expression in T cells after exosomes treatment (Exo‐Huh7 and Exo‐HepG2). G, Quantitative RT‐PCR analyses of the expression of miR‐324‐5p in T cells treated with exosomes and circGSE1‐knockdown exosomes. All data are means ± SD; n = 3, *p < 0.05, **p < 0.01, ***p < 0.001
3.5. miR‐324‐5p activates the TGFBR1/smad3 signaling pathway
As is known, miRNAs regulate mRNAs by binding to the 3'UTR of target genes. 21 The online bioinformatics tool StarBase 2.0 (http://starbase.sysu.edu.cn/) and TargetScan (https://www.targetscan.org/vert_72/) were used to predict the target genes of miR‐324‐5p. The prediction results indicated that TGFBR1 is one of the most suitable target genes that can bind to miR‐324‐5p. Studies have shown that TGFBR1, as a receptor for TGFβ1, participates in signal transduction in immune cells, including T cells. 22 In order to explore the relationship between miR‐324‐5p and TGFBR1, a luciferase reporter gene was constructed and used (Figure 5A). Dual‐luciferase reporter assay results demonstrated miR‐324‐5p mimics significantly decreased the luciferase activity of wild‐type TGFBR1 (TGFBR1‐wt) rather than the luciferase activity of mutation TGFBR1 (TGFBR1‐mt) (Figure 5B). Western blot analysis also found that miR‐324‐5p inhibitor markedly induced the protein expression of TGFBR1 (Figure 5C and D). Studies have shown that SMD3 can be used as an important substrate of TGF‐β and participate in the transcriptional regulation of downstream genes. 15 Therefore, we first explored the protein expression level of Smad3 after knockdown of TGFBR1 by Western blot. Western blot results once again confirmed that knockdown of TGFBR1 can significantly reduce the expression of Smad3 (Figure 5E and F). Tone et al. found that Smad3 induced FOXP3 expression through its enhancer, thereby promoting Treg expansion. 23 Therefore, further research results showed that the protein expressions of TGFBR1, Smad3, and FOXP3 were significantly increased in T cells supplemented with HCC‐derived exosomes, while the upregulation effects were significantly inhibited after cotreatment with miR‐324‐5p inhibitor (Figure 5G–J). In short, findings indicated that miR‐324‐5p activates the TGFBR1/smad3/FOXP3 axis. Therefore, it is necessary to explore whether the miR‐324‐5p/TGFBR1/smad3 axis can promote the expression of FOXP3 and induce the expansion of Treg.
FIGURE 5.
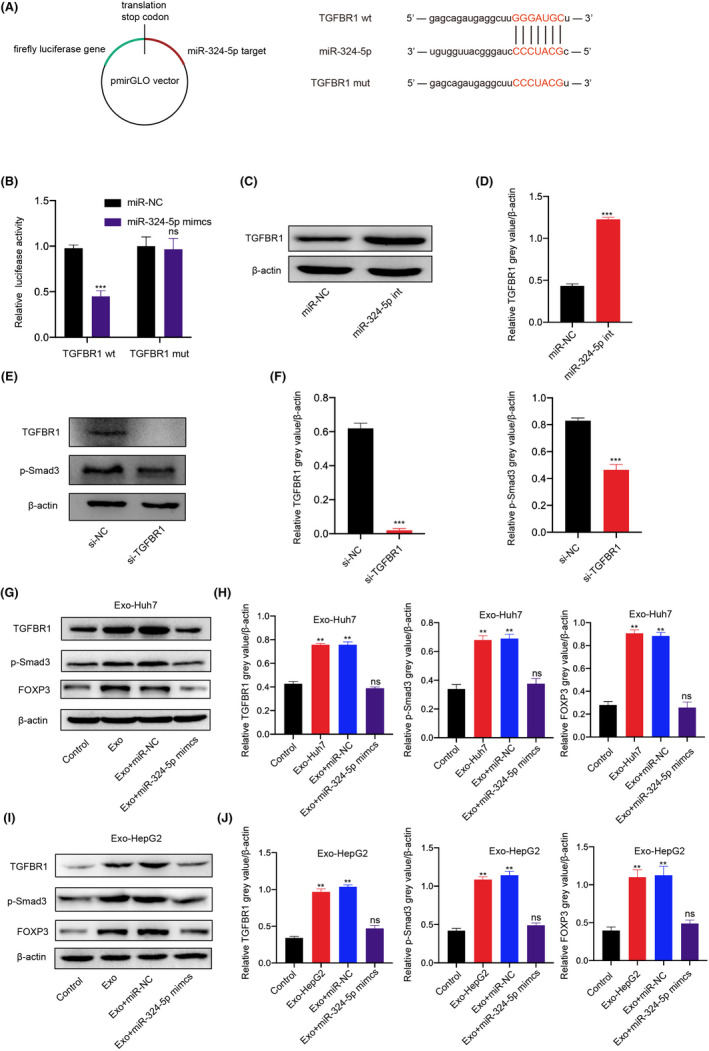
miR‐324‐5p activates the TGFBR1/smad3 signaling pathway. Schematic diagram of TGFBR1 with the predicted binding site for miR‐324‐5p. B, Luciferase reporter analysis was carried out to examine the binding ability between miR‐324‐5p and TGFBR1. Reporter constructs containing either TGFBR1wt or TGFBR1mut at the predicted binding site for miR‐324‐5p were cotransfected into T cells with miR‐324‐5p or miR‐NC mimic. C, D, Western blots and grey value of TGFBR1 expression in T cells after being transfected with miR‐324‐5p inhibitor or miR‐NC. E, F, Western blots and grey value of TGFBR1, Smad3, and FOXP3 expression in T cells after being transfected with TGFBR1 siRNA. G, H, Western blots and grey value of TGFBR1, Smad3, and FOXP3 expression in T cells after treatment with Huh7‐derived exosomes (Exo‐Huh7), miR‐324‐5p mimics, or miR‐NC. I, J, Western blots and grey value of TGFBR1, Smad3, and FOXP3 expression in T cells after treatment with HepG2‐derived exosomes (Exo‐HepG2), miR‐324‐5p mimics, or miR‐NC. All data are means ± SD; n = 3, *p < 0.05, **p < 0.01, ***p < 0.001
3.6. HCC‐derived exosomal circGSE1 induces the expansion of Tregs via the miR‐324‐5p/TGFBR1/Smad3 axis
Whether exosomal circRNA regulates the proliferation of Tregs through the TGF‐β1/Smad pathway has not been reported. 5 Therefore, we tried to explore whether HCC‐derived exosomal circGSE1 is involved in the regulation of the expansion of Tregs and the mechanism of regulation. Flow cytometry analysis demonstrated HCC‐derived exosomes markedly promoted the expansion of Tregs, while the upregulation effects were significantly inhibited after the transfection of circGSE1 siRNA into HCC cells (Figure 6A. a‐c and B). Furthermore, although culturing T cells with HCC‐derived exosomes knocked down circGSE1, we also used miR‐324‐5p inhibitor in T cells. Results showed that the use of miR‐324‐5p inhibitor rescued the promoting effect of HCC‐derived exosomes on the proliferation of Tregs (Figure 6A. d and B). In order to further explore whether miR‐324‐5p affects the expansion of Tregs via activating the TGFBR1/smad3 signaling pathway, we added miR‐324‐5p inhibitor into T cells and knocked down the expression of TGFBR1 or smad3 in T cells at the same time. The results suggest that the upregulation effect of HCC‐derived exosomes rescued by inhibiting miR‐324‐5p will be downregulated again by knocking down TGFBR1 (Figure 6A. e and B) or smad3 (Figure 6A. f and B). Based on the above experimental results, it can be concluded that HCC‐derived exosomal circGSE1 induces the expansion of Tregs via the miR‐324‐5p/TGFBR1/Smad3 axis. The ratio of Tregs to CD8+ T cells is related to the prognosis and clinical efficacy of cancer patients. 24 Therefore, we further found that the trend of Treg/CD8+ T cells ratio is basically consistent with the change in the proportion of Tregs cells in CD4+ T cells (Figure 6C). Tregs shape the suppressive immune microenvironment by suppressing effector CD8+ T cells. 25 In order to understand whether Tregs affect the activity of CD8+ T cells, we used ELISA to detect the expression of IFN‐γ (cytokine secreted by CD8+ T cells) in the supernatant of T cells cocultured with HCC‐derived exosomes. ELISA analysis results showed that the IFN‐γ secretion in the Tregs‐amplified group was significantly lower than that in the Tregs‐unamplified group (Figure 6D), indicating that Tregs may exert tumor immunosuppressive function by suppressing the function of effector T cells.
FIGURE 6.
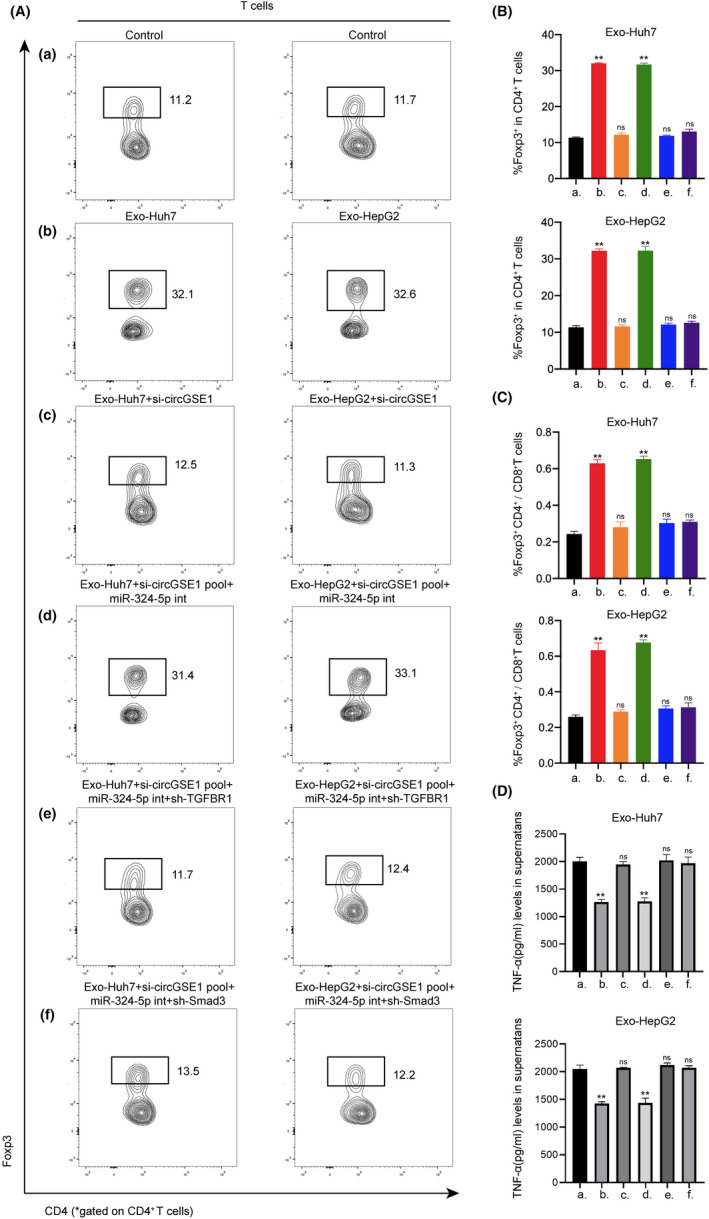
Hepatocellular carcinoma (HCC)‐derived exosomal circGSE1 induces the expansion of Tregs via the miR‐324‐5p/TGFBR1/Smad3 axis. A‐C, Flow cytometry analysis of the ratio of Foxp3+ T cells in CD4+ T cells and the Foxp3+ CD4+/CD8+ T cells ratio after indicated treatment. D, ELISA analysis of the IFN‐γ secretion after indicated treatment. All data are means ± SD; n = 3, *p < 0.05, **p < 0.01, ***p < 0.001
3.7. HCC‐derived exosomal circGSE1 facilitates HCC progression in vitro and in vivo via inducing the expansion of Tregs
To further evaluate the effect of HCC‐derived exosomal circGSE1 in stimulating the progression of HCC, we carried out in vitro and in vivo experiments. We first observed the effect of indirect coculture of HCC cells and conditioned T cells by carrying out Transwell and wound‐healing assays. Transwell and wound healing showed that Exo‐Huh7–treated T cells significantly improved the migration and invasion abilities of Huh7 cells, while an opposite effect occurred in the circGSE1‐knockdown exosomes. T cells treated with circGSE1‐knockdown exosomes and miR‐324‐5p inhibitor markedly promoted the migration and invasion of Huh7 cells. On the basis of T cells treated with circGSE1‐knockdown exosomes and miR‐324‐5p inhibitor, after knocking down TGFBR1 or Smad3 on T cells, the migration and invasion abilities of Huh7 were significantly reduced (Figure 7A–D). In addition, we carried out in vivo experiments by injecting Huh7 cells mixed with conditioned T cells into the mice via tail vein. After 4 weeks, we observed that compared with the PBS group, Huh7 cells mixed with Exo‐Huh7–treated T cells had significant metastasis, and overexpression of circGSE1 further promoted the metastasis of HCC (Figure 7E and F). The above in vitro and in vivo experiments jointly indicate that HCC‐derived exosomal circGSE1 facilitates HCC progression via inducing the expansion of Tregs.
FIGURE 7.
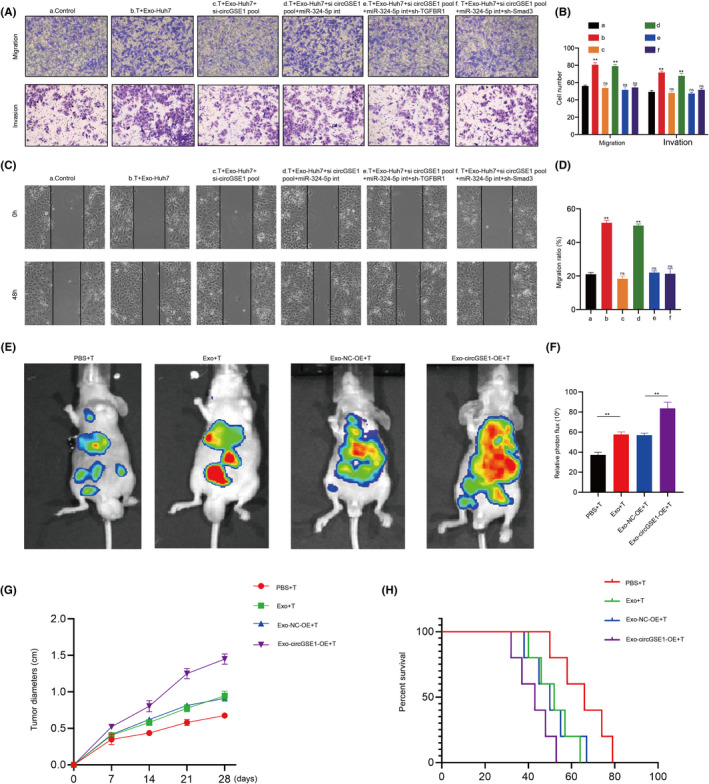
Hepatocellular carcinoma (HCC)‐derived exosomal circGSE1 facilitates HCC progression in vitro and in vivo via inducing the expansion of Tregs. A, B, Migration and invasion capacity of Huh7 cells cocultured with T cells subject to indicated treatment detected by Transwell. C, D, Scratch wound healing assays in Huh7 cells cocultured with T cells subject to indicated treatment. E, F, Bioluminescence imaging of C57 mice after tail vein injection of HCC cells mixed with HCC‐exo–induced T cells, or T cells induced by HCC‐exo that had been transfected with NC‐overexpression (OE)/circGSE1‐OE (n = 3/per group). Metastasis was monitored by bioluminescence using an in vivo imaging system. All data are means ± SD; n = 3, *p < 0.05, **p < 0.01, ***p < 0.001
4. DISCUSSION
Studies have reported that circRNAs are abnormally expressed in various cancers, revealing that circRNA is an important molecule involved in tumor progression. 26 , 27 It is reported that cell‐to‐cell communication has the effect of promoting cancer immune escape. 28 , 29 , 30 The main mechanisms of signal exchange between cells include direct interaction, secreted biologically active molecules, and exosomes. 30 , 31 Studies have confirmed that exosomal circRNAs are abnormally expressed in the peripheral blood of patients with various cancers. 30 , 32 , 33 Notably, circRNA has been shown to be involved in regulating the immune evasion process of cancer. 26 In this study, we identified circGSE1 was highly expressed in HCC serum–derived exosomes. This suggests that circGSE1 may be involved in the occurrence and development of HCC, and it is necessary to further explore its mechanism.
Furthermore, by bioinformatics, luciferase reporter assays, and pull‐down, circGSE1 was confirmed to directly bind with miR‐324‐5p. Moreover, we found that TGFBR1 was a direct common target of miR‐324‐5p. Quantitative RT‐PCR and Western blot results confirmed that knockdown of TGFBR1 can significantly reduce the expression of Smad3. Our data showed that miR‐324‐5p activates the TGFBR1/Smad3 axis. Flow cytometry results showed that exosomal circGSE1 promoted the expansion of Tregs, while the knockdown of circGSE1 abrogated the increased effects. However, the downregulation of miR‐324‐5p can rescue Tregs expansion defects caused by circGSE1 deficiency. Transwell and wound‐healing assays showed that HCC‐derived exosomal circGSE1 facilitates HCC progression via the miR‐324‐5p/TGFBR1/Smad3 axis (Figure 8). In vivo experiments further confirmed that HCC‐derived exosomal circGSE1 facilitates HCC metastasis, indicating that cicrGSE1 has the opportunity to become a potential target for HCC immunotherapy.
FIGURE 8.
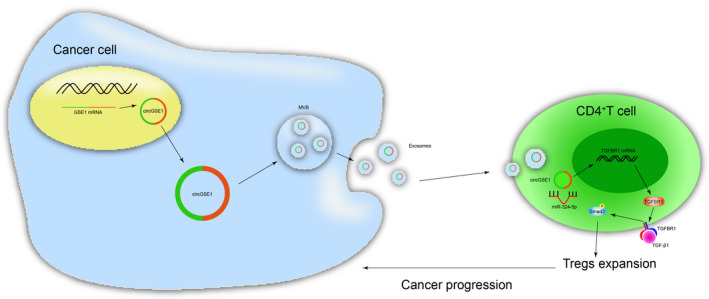
Schematic of the action of cancer cell–derived exosomal circGSE1 promoting the immune escape of hepatocellular carcinoma by inducing Tregs expansion
Our results also showed that the trend of the ratio of Treg/CD8+ T cells is basically consistent with the change in the proportion of Tregs in CD4+ T cells, suggesting that Treg/CD8+ T ratio may be an indicator of the prognosis of HCC; further clinical trials are needed to explore this in the future. Additionally, ELISA analysis results showed that Tregs may exert tumor immunosuppressive function by suppressing the function of effector T cells. Of note, recent research also found that PD1 blockade can promote the expansion of Tregs. 34 It has been confirmed that the expression of PD1 on CD8+ T is related to CD8+ T cell apoptosis, which is also the mechanism by that PD1/PDL1 inhibitors work. 35 These results further illustrate that the Tregs/CD8+ T ratio may also predict the antitumor response of PD1/PDL1 inhibitors.
5. CONCLUSIONS
In summary, we demonstrated for the first time that circGSE1 leads to immune escape of HCC by promoting the expansion of Tregs via regulating the miR‐324‐5p/TGFBR1/Smad3 axis. These findings shed light on the mechanism of exosomal circGSE1 in the progression of HCC and provide a promising biomarker for HCC immunotherapy.
DISCLOSURE
The authors declare that they have no competing interests.
ACKNOWLEDGEMENTS
This study was supported by grants from National Natural Science Foundation of China (No.82003040).
Huang M, Huang X, Huang N. Exosomal circGSE1 promotes immune escape of hepatocellular carcinoma by inducing the expansion of regulatory T cells. Cancer Sci. 2022;113:1968–1983. doi: 10.1111/cas.15365
Mingyao Huang and Xin Huang contributed equally to this work.
REFERENCES
- 1. Singal AG, Lampertico P, Nahon P. Epidemiology and surveillance for hepatocellular carcinoma: new trends. J Hepatol. 2020;72:250‐261. [DOI] [PMC free article] [PubMed] [Google Scholar]
- 2. Sharma P, Allison JP. Immune checkpoint targeting in cancer therapy: toward combination strategies with curative potential. Cell. 2015;161:205‐214. [DOI] [PMC free article] [PubMed] [Google Scholar]
- 3. Foerster F, Galle PR. The current landscape of clinical trials for systemic treatment of HCC. Cancers. 2021;13(8):1962. [DOI] [PMC free article] [PubMed] [Google Scholar]
- 4. Chen DS, Mellman I. Oncology meets immunology: the cancer‐immunity cycle. Immunity. 2013;39:1‐10. [DOI] [PubMed] [Google Scholar]
- 5. Huang M, Peng X, Yang L, et al. Non‐coding RNA derived from extracellular vesicles in cancer immune escape: Biological functions and potential clinical applications. Cancer Lett. 2021;501:234‐246. [DOI] [PubMed] [Google Scholar]
- 6. Zheng C, Zheng L, Yoo JK, et al. Landscape of infiltrating T cells in liver cancer revealed by single‐cell sequencing. Cell. 2017;169(1342‐1356):e1316. [DOI] [PubMed] [Google Scholar]
- 7. Nishikawa H, Sakaguchi S. Regulatory T cells in cancer immunotherapy. Curr Opin Immunol. 2014;27:1‐7. [DOI] [PubMed] [Google Scholar]
- 8. Hoshino A, Costa‐Silva B, Shen TL, et al. Tumour exosome integrins determine organotropic metastasis. Nature. 2015;527:329‐335. [DOI] [PMC free article] [PubMed] [Google Scholar]
- 9. Muller L, Mitsuhashi M, Simms P, Gooding WE, Whiteside TL. Tumor‐derived exosomes regulate expression of immune function‐related genes in human T cell subsets. Sci Rep. 2016;6:20254. [DOI] [PMC free article] [PubMed] [Google Scholar]
- 10. Ma S, Kong S, Wang F, Ju S. CircRNAs: biogenesis, functions, and role in drug‐resistant Tumours. Mol Cancer. 2020;19:119. [DOI] [PMC free article] [PubMed] [Google Scholar]
- 11. Han Y, Liu Y, Zhang B, Yin G. Exosomal circRNA 0001445 promotes glioma progression through miRNA‐127‐5p/SNX5 pathway. Aging (Albany NY). 2021;13:13287‐13299. [DOI] [PMC free article] [PubMed] [Google Scholar]
- 12. Jiang Z, Hou Z, Li L, Liu W, Yu Z, Chen S. Exosomal circEPB41L2 serves as a sponge for miR‐21‐5p and miR‐942‐5p to suppress colorectal cancer progression by regulating the PTEN/AKT signalling pathway. Eur J Clin Invest. 2021;51:e13581. [DOI] [PubMed] [Google Scholar]
- 13. Zhang T, Jing B, Bai Y, Zhang Y, Yu H. Circular RNA circTMEM45A acts as the sponge of microRNA‐665 to promote hepatocellular carcinoma progression. Mol Ther Nucleic Acids. 2020;22:285‐297. [DOI] [PMC free article] [PubMed] [Google Scholar]
- 14. Zhang PF, Gao C, Huang XY, et al. Cancer cell‐derived exosomal circUHRF1 induces natural killer cell exhaustion and may cause resistance to anti‐PD1 therapy in hepatocellular carcinoma. Mol Cancer. 2020;19:110. [DOI] [PMC free article] [PubMed] [Google Scholar]
- 15. David CJ, Massague J. Contextual determinants of TGFbeta action in development, immunity and cancer. Nat Rev Mol Cell Biol. 2018;19:419‐435. [DOI] [PMC free article] [PubMed] [Google Scholar]
- 16. Batlle E, Massague J. Transforming growth factor‐beta signaling in immunity and cancer. Immunity. 2019;50:924‐940. [DOI] [PMC free article] [PubMed] [Google Scholar]
- 17. Thery C, Amigorena S, Raposo G, Clayton A. Isolation and characterization of exosomes from cell culture supernatants and biological fluids. Curr Protoc Cell Biol. 2006;30(1):Chapter 3:Unit 3 22. [DOI] [PubMed] [Google Scholar]
- 18. Peng X, Yang L, Ma Y, et al. IKKbeta activation promotes amphisome formation and extracellular vesicle secretion in tumor cells. Biochim Biophys Acta Mol Cell Res. 2021;1868:118857. [DOI] [PubMed] [Google Scholar]
- 19. Li R, Wang Y, Zhang X, et al. Exosome‐mediated secretion of LOXL4 promotes hepatocellular carcinoma cell invasion and metastasis. Mol Cancer. 2019;18:18. [DOI] [PMC free article] [PubMed] [Google Scholar]
- 20. Hansen TB, Jensen TI, Clausen BH, et al. Natural RNA circles function as efficient microRNA sponges. Nature. 2013;495:384‐388. [DOI] [PubMed] [Google Scholar]
- 21. Bartel DP. MicroRNAs: genomics, biogenesis, mechanism, and function. Cell. 2004;116:281‐297. [DOI] [PubMed] [Google Scholar]
- 22. Groeneveldt C, van Hall T, van der Burg SH, Ten Dijke P, van Montfoort N. Immunotherapeutic potential of TGF‐beta inhibition and oncolytic viruses. Trends Immunol. 2020;41:406‐420. [DOI] [PubMed] [Google Scholar]
- 23. Tone Y, Furuuchi K, Kojima Y, Tykocinski ML, Greene MI, Tone M. Smad3 and NFAT cooperate to induce Foxp3 expression through its enhancer. Nat Immunol. 2008;9(2):194‐202. [DOI] [PubMed] [Google Scholar]
- 24. Kumagai S, Togashi Y, Sakai C, et al. An oncogenic alteration creates a microenvironment that promotes tumor progression by conferring a metabolic advantage to regulatory T cells. Immunity. 2020;53(187–203):e188. [DOI] [PubMed] [Google Scholar]
- 25. van der Veeken J, Gonzalez AJ, Cho H, et al. Memory of inflammation in regulatory T cells. Cell. 2016;166:977‐990. [DOI] [PMC free article] [PubMed] [Google Scholar]
- 26. Chen X, Yang T, Wang W, et al. Circular RNAs in immune responses and immune diseases. Theranostics. 2019;9:588‐607. [DOI] [PMC free article] [PubMed] [Google Scholar]
- 27. Ng WL, Mohd Mohidin TB, Shukla K. Functional role of circular RNAs in cancer development and progression. RNA Biol. 2018;15:995‐1005. [DOI] [PMC free article] [PubMed] [Google Scholar]
- 28. Kim DH, Kim H, Choi YJ, et al. Exosomal PD‐L1 promotes tumor growth through immune escape in non‐small cell lung cancer. Exp Mol Med. 2019;51:1‐13. [DOI] [PMC free article] [PubMed] [Google Scholar]
- 29. Kulkarni B, Kirave P, Gondaliya P, et al. Exosomal miRNA in chemoresistance, immune evasion, metastasis and progression of cancer. Drug Discov Today. 2019;24:2058‐2067. [DOI] [PubMed] [Google Scholar]
- 30. Wang Y, Liu J, Ma J, et al. Exosomal circRNAs: biogenesis, effect and application in human diseases. Mol Cancer. 2019;18:116. [DOI] [PMC free article] [PubMed] [Google Scholar]
- 31. Xie Y, Dang W, Zhang S, et al. The role of exosomal noncoding RNAs in cancer. Mol Cancer. 2019;18:37. [DOI] [PMC free article] [PubMed] [Google Scholar]
- 32. Li S, Li Y, Chen B, et al. exoRBase: a database of circRNA, lncRNA and mRNA in human blood exosomes. Nucleic Acids Res. 2018;46:D106‐D112. [DOI] [PMC free article] [PubMed] [Google Scholar]
- 33. Wang G, Liu W, Zou Y, et al. Three isoforms of exosomal circPTGR1 promote hepatocellular carcinoma metastasis via the miR449a‐MET pathway. EBioMedicine. 2019;40:432‐445. [DOI] [PMC free article] [PubMed] [Google Scholar]
- 34. Kamada T, Togashi Y, Tay C, et al. PD‐1(+) regulatory T cells amplified by PD‐1 blockade promote hyperprogression of cancer. Proc Natl Acad Sci U S A. 2019;116:9999‐10008. [DOI] [PMC free article] [PubMed] [Google Scholar]
- 35. Chen SW, Zhu SQ, Pei X, et al. Cancer cell‐derived exosomal circUSP7 induces CD8+ T cell dysfunction and anti‐PD1 resistance by regulating the miR‐934/SHP2 axis in NSCLC. Mol Cancer. 2021;20(1):144. [DOI] [PMC free article] [PubMed] [Google Scholar]


