Abstract
Intrinsic and extrinsic cues determine developmental trajectories of hematopoietic stem cells (HSCs) towards erythroid, myeloid and lymphoid lineages. Using two newly generated transgenic mice that report and trace the expression of terminal deoxynucleotidyl transferase (TdT), transient induction of TdT was detected on a newly identified multipotent progenitor (MPP) subset that lacked self-renewal capacity but maintained multilineage differentiation potential. TdT induction on MPPs reflected a transcriptionally dynamic, but uncommitted stage, characterized by low expression of lineage-associated genes. Single-cell CITE-Seq indicated that multipotency in the TdT+ MPP is associated with expression of the endothelial cell adhesion molecule ESAM. Stable and progressive upregulation of TdT defined the lymphoid developmental trajectory. Collectively, we here identify a new multipotent progenitor within the MPP4 compartment. Specification and commitment are defined by downregulation of ESAM which marks the progressive loss of alternative fates along all lineages.
Keywords: Hematopoiesis, multipotent progenitors, lineage specification/restriction, plasticity, fate mapping, CITE-Seq
Most blood cells have a short half-life and are regenerated throughout the life of an individual in a process referred to as hematopoiesis1. Hematopoietic stem cells (HSCs) reside within the bone marrow (BM) at specific niches that provide the necessary cues for their maintenance and survival. Through proliferation and differentiation, the pool of HSCs is constantly self-renewed, while generating progeny which progressively expand, giving rise to all mature hematopoietic subsets2, 3. HSCs were originally described as Lineage−Sca1+c-Kit+ (LSK) BM cells4, 5, 6. Later studies revealed heterogeneity identifying long-term (LT-), short-term (ST-) HSCs and MPPs7, 8, 9, 10. MPPs do not have self-renewal capacity, but will reconstitute lymphoid, myeloid and erythroid lineages. Based on the expression of FLT3, CD150 and CD48 the MPP compartment is currently split into erythroid-primed FLT3−CD48+CD150+ MPP2, myeloid-primed FLT3−CD48+CD150− MPP3, and lymphoid-primed FLT3+CD150− MPP411, 12, 13, 14, 15, 16, 17, 18, 19, 20, each characterized by developmental bias towards their respective lineages21, 22, 23. However, the extent of their heterogeneity and plasticity, and the stage at which lineage commitment becomes irreversible, remains elusive. To dissect lineage restriction and specification at its earliest along the lymphoid branch, we generated mouse models that directly report or trace the expression of the lymphoid specific template independent polymerase Dntt (encoding TdT) which is required for the insertion of random nucleotides at VDJ joining regions during B- and T-cell receptor rearrangement24. TdT tracing surprisingly showed a broad expression profile, labelling all hematopoietic lineages. Using computational analysis on single cell CITE-Seq in these newly generated mouse lines, combined with multiple functional assays we resolved and re-defined early hematopoietic development from its most uncommitted precursor within the MPP4 subset up to each specific stage at which lymphoid, myeloid and erythroid lineage restriction occurred.
TdT labeling marks early T and B cell development
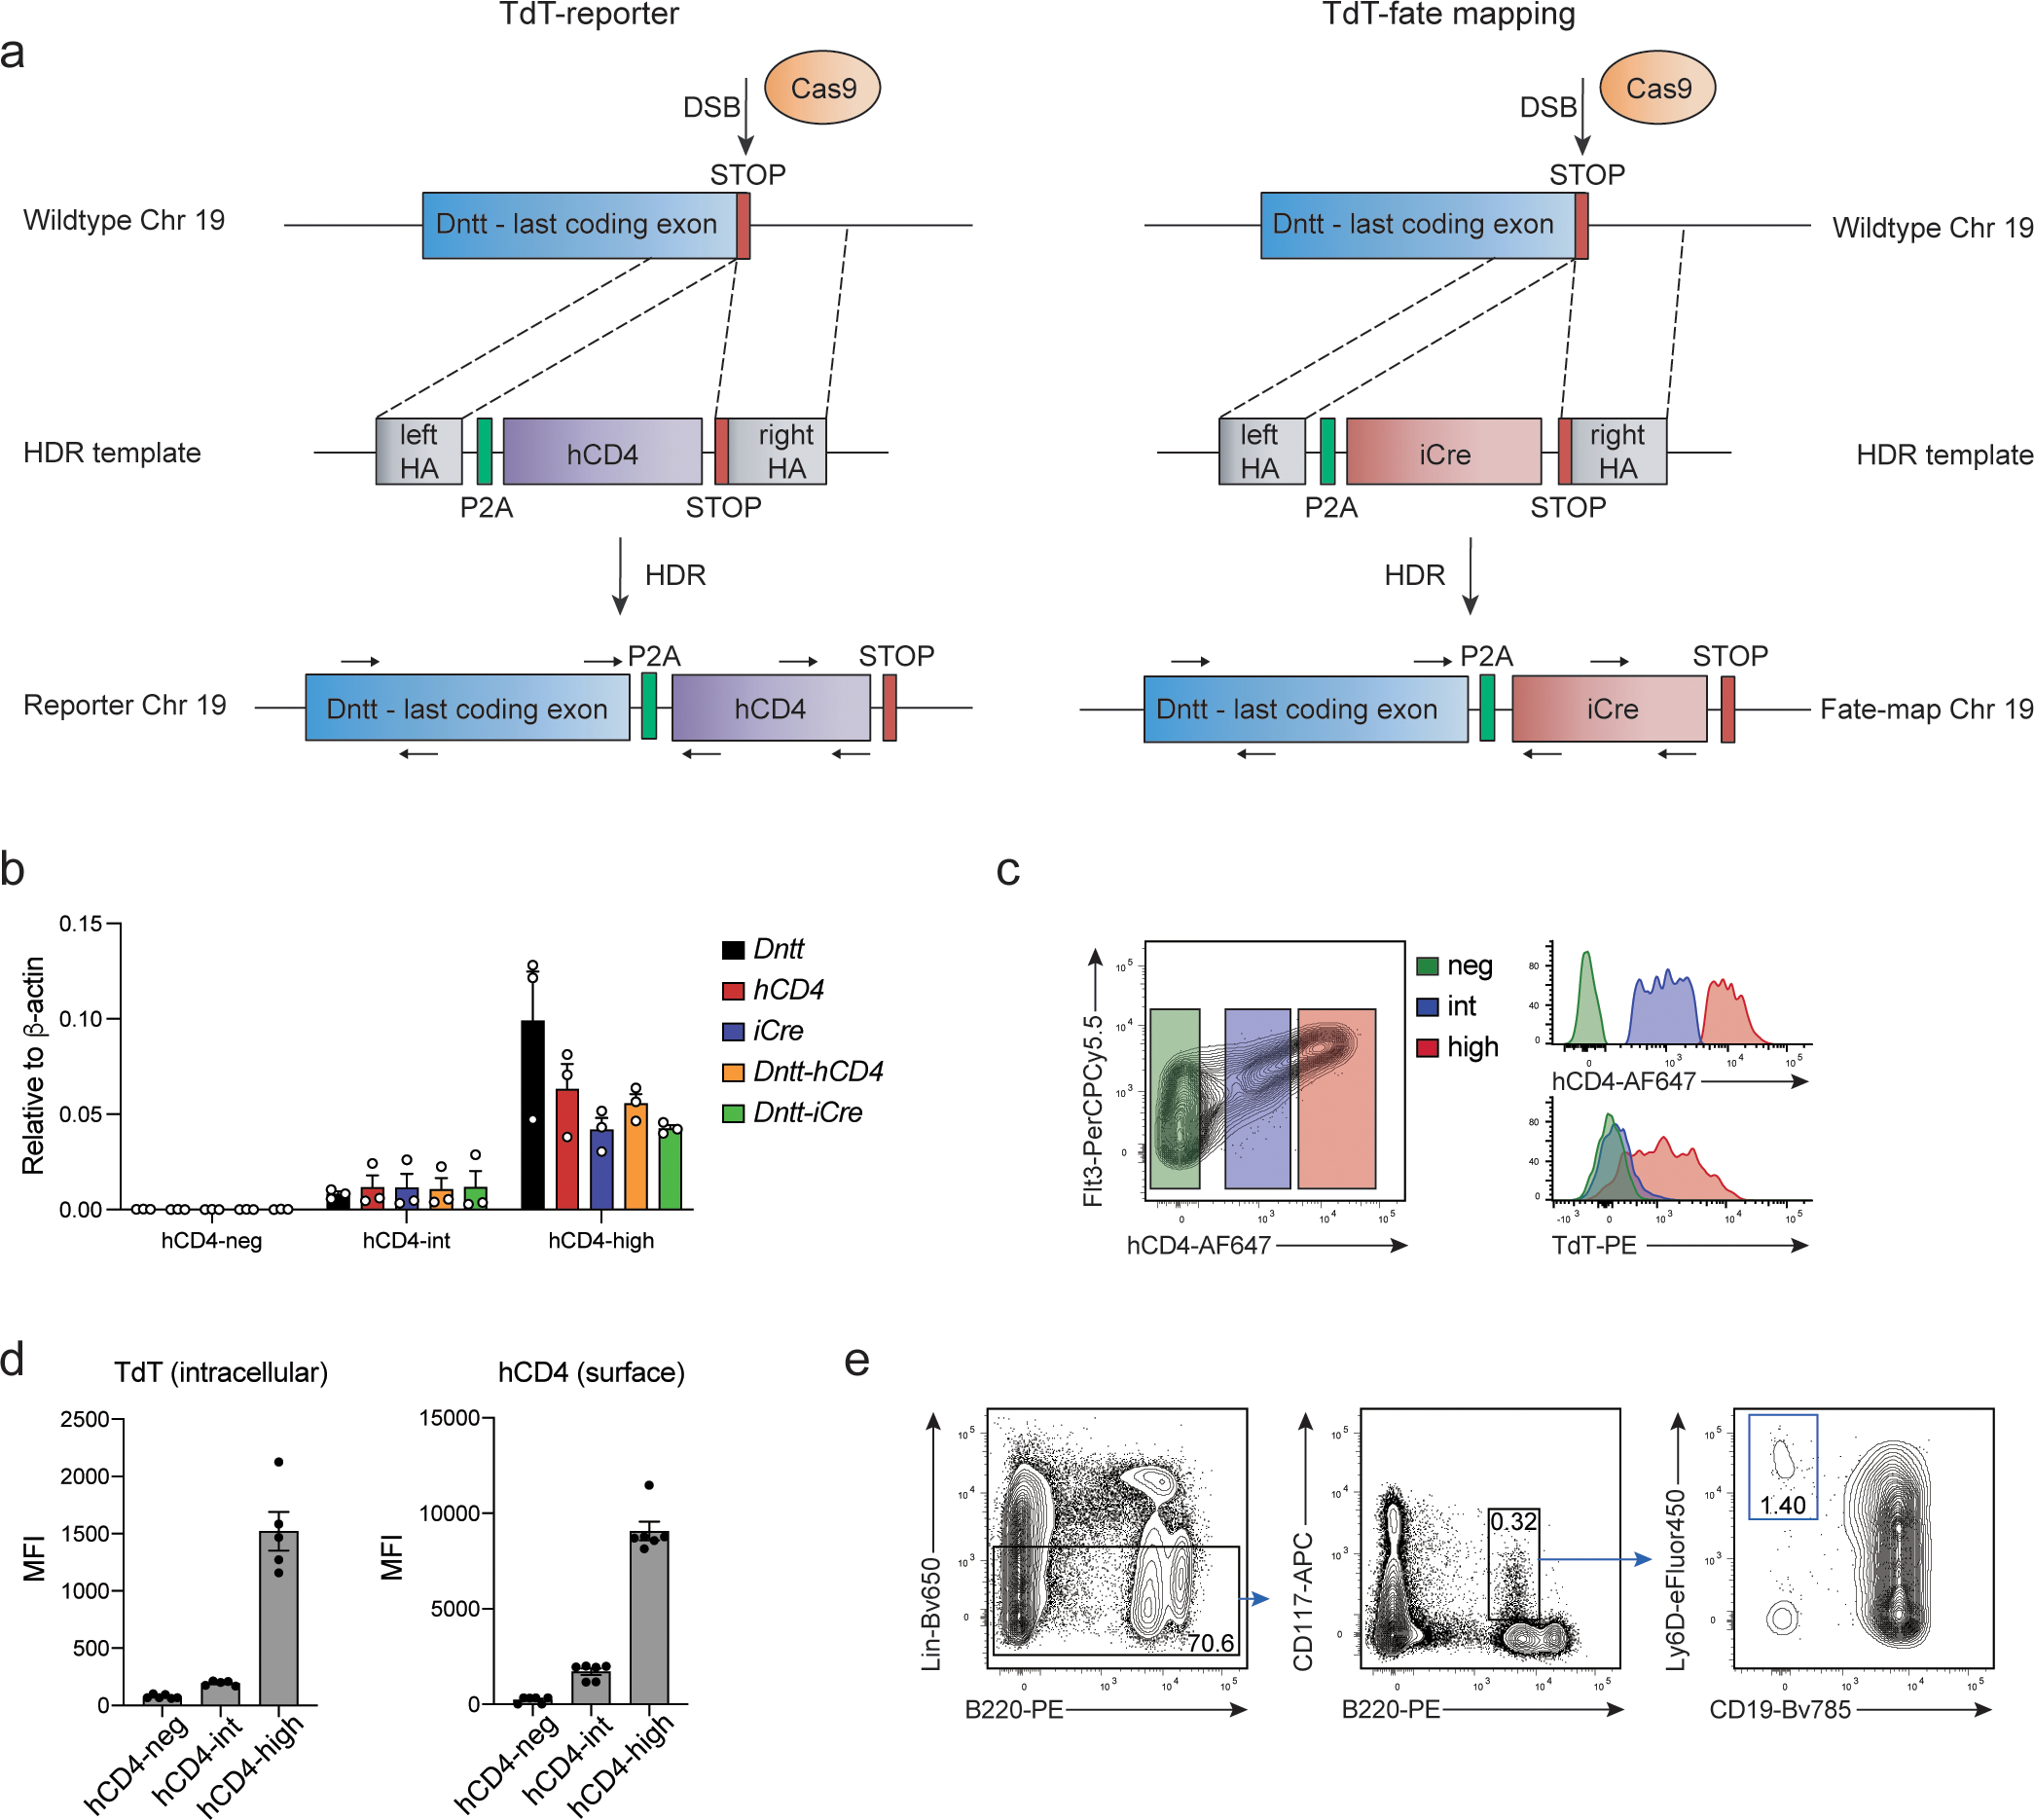
To isolate TdT-expressing cells and identify their progeny we generated a TdT-reporter and a TdT-fate mapping line (Extended Data 1a). The reporter line (hereafter TdThCD4) was constructed by inserting the self-cleaving peptide P2A followed by the extracellular domain of the human CD4 gene (hCD4), ensuring equimolar expression and surface detection of TdT. Similarly, TdT-fate mapping was achieved using P2A-iCre crossed to Rosa26LSL-YFP line (hereafter TdTYFP). Faithful reporting of TdT by hCD4 was confirmed by qPCR analysis (Extended Data 1b) of sorted LSK subsets using primers for Dntt, hCD4, iCre or spanning the junctional regions as well as by hCD4 and intracellular TdT co-staining (Extended Data 1c,d).
Expression of TdT, which inserts random nucleotides at junctional regions, is thought to be initiated on CLPs and maintained on T and B lymphocytes until cells have rearranged their corresponding T- and B-cell receptors 24. hCD4 expression is detected in developing T cells from CD4-CD8 double negative (DN) to double positive precursors (Fig. 1a,b). Consistently, YFP is detected starting form DN1 cells in TdTYFP mice (Fig. 1c). Along the B cell lineage, hCD4 in TdThCD4 and YFP in the TdTYFP mice were detectable in Lin−B220+cKit+CD19−Ly6D+ EPLM (early BM progenitors with myeloid and lymphoid potential)25, 26, 27 up to CD19+cKit+ pro-B cells (Fig. 1d–g; Extended Data 1e) in agreement with the reported downregulation of Dntt expression upon rearrangement of the heavy chain24. As expected, YFP expression remained high on all B cells (Fig. 1g), collectively confirming the origin of all T and B cells from a Dntt expressing progenitor.
Fig. 1. TdT reporter and lineage tracing expression in T and B cells.
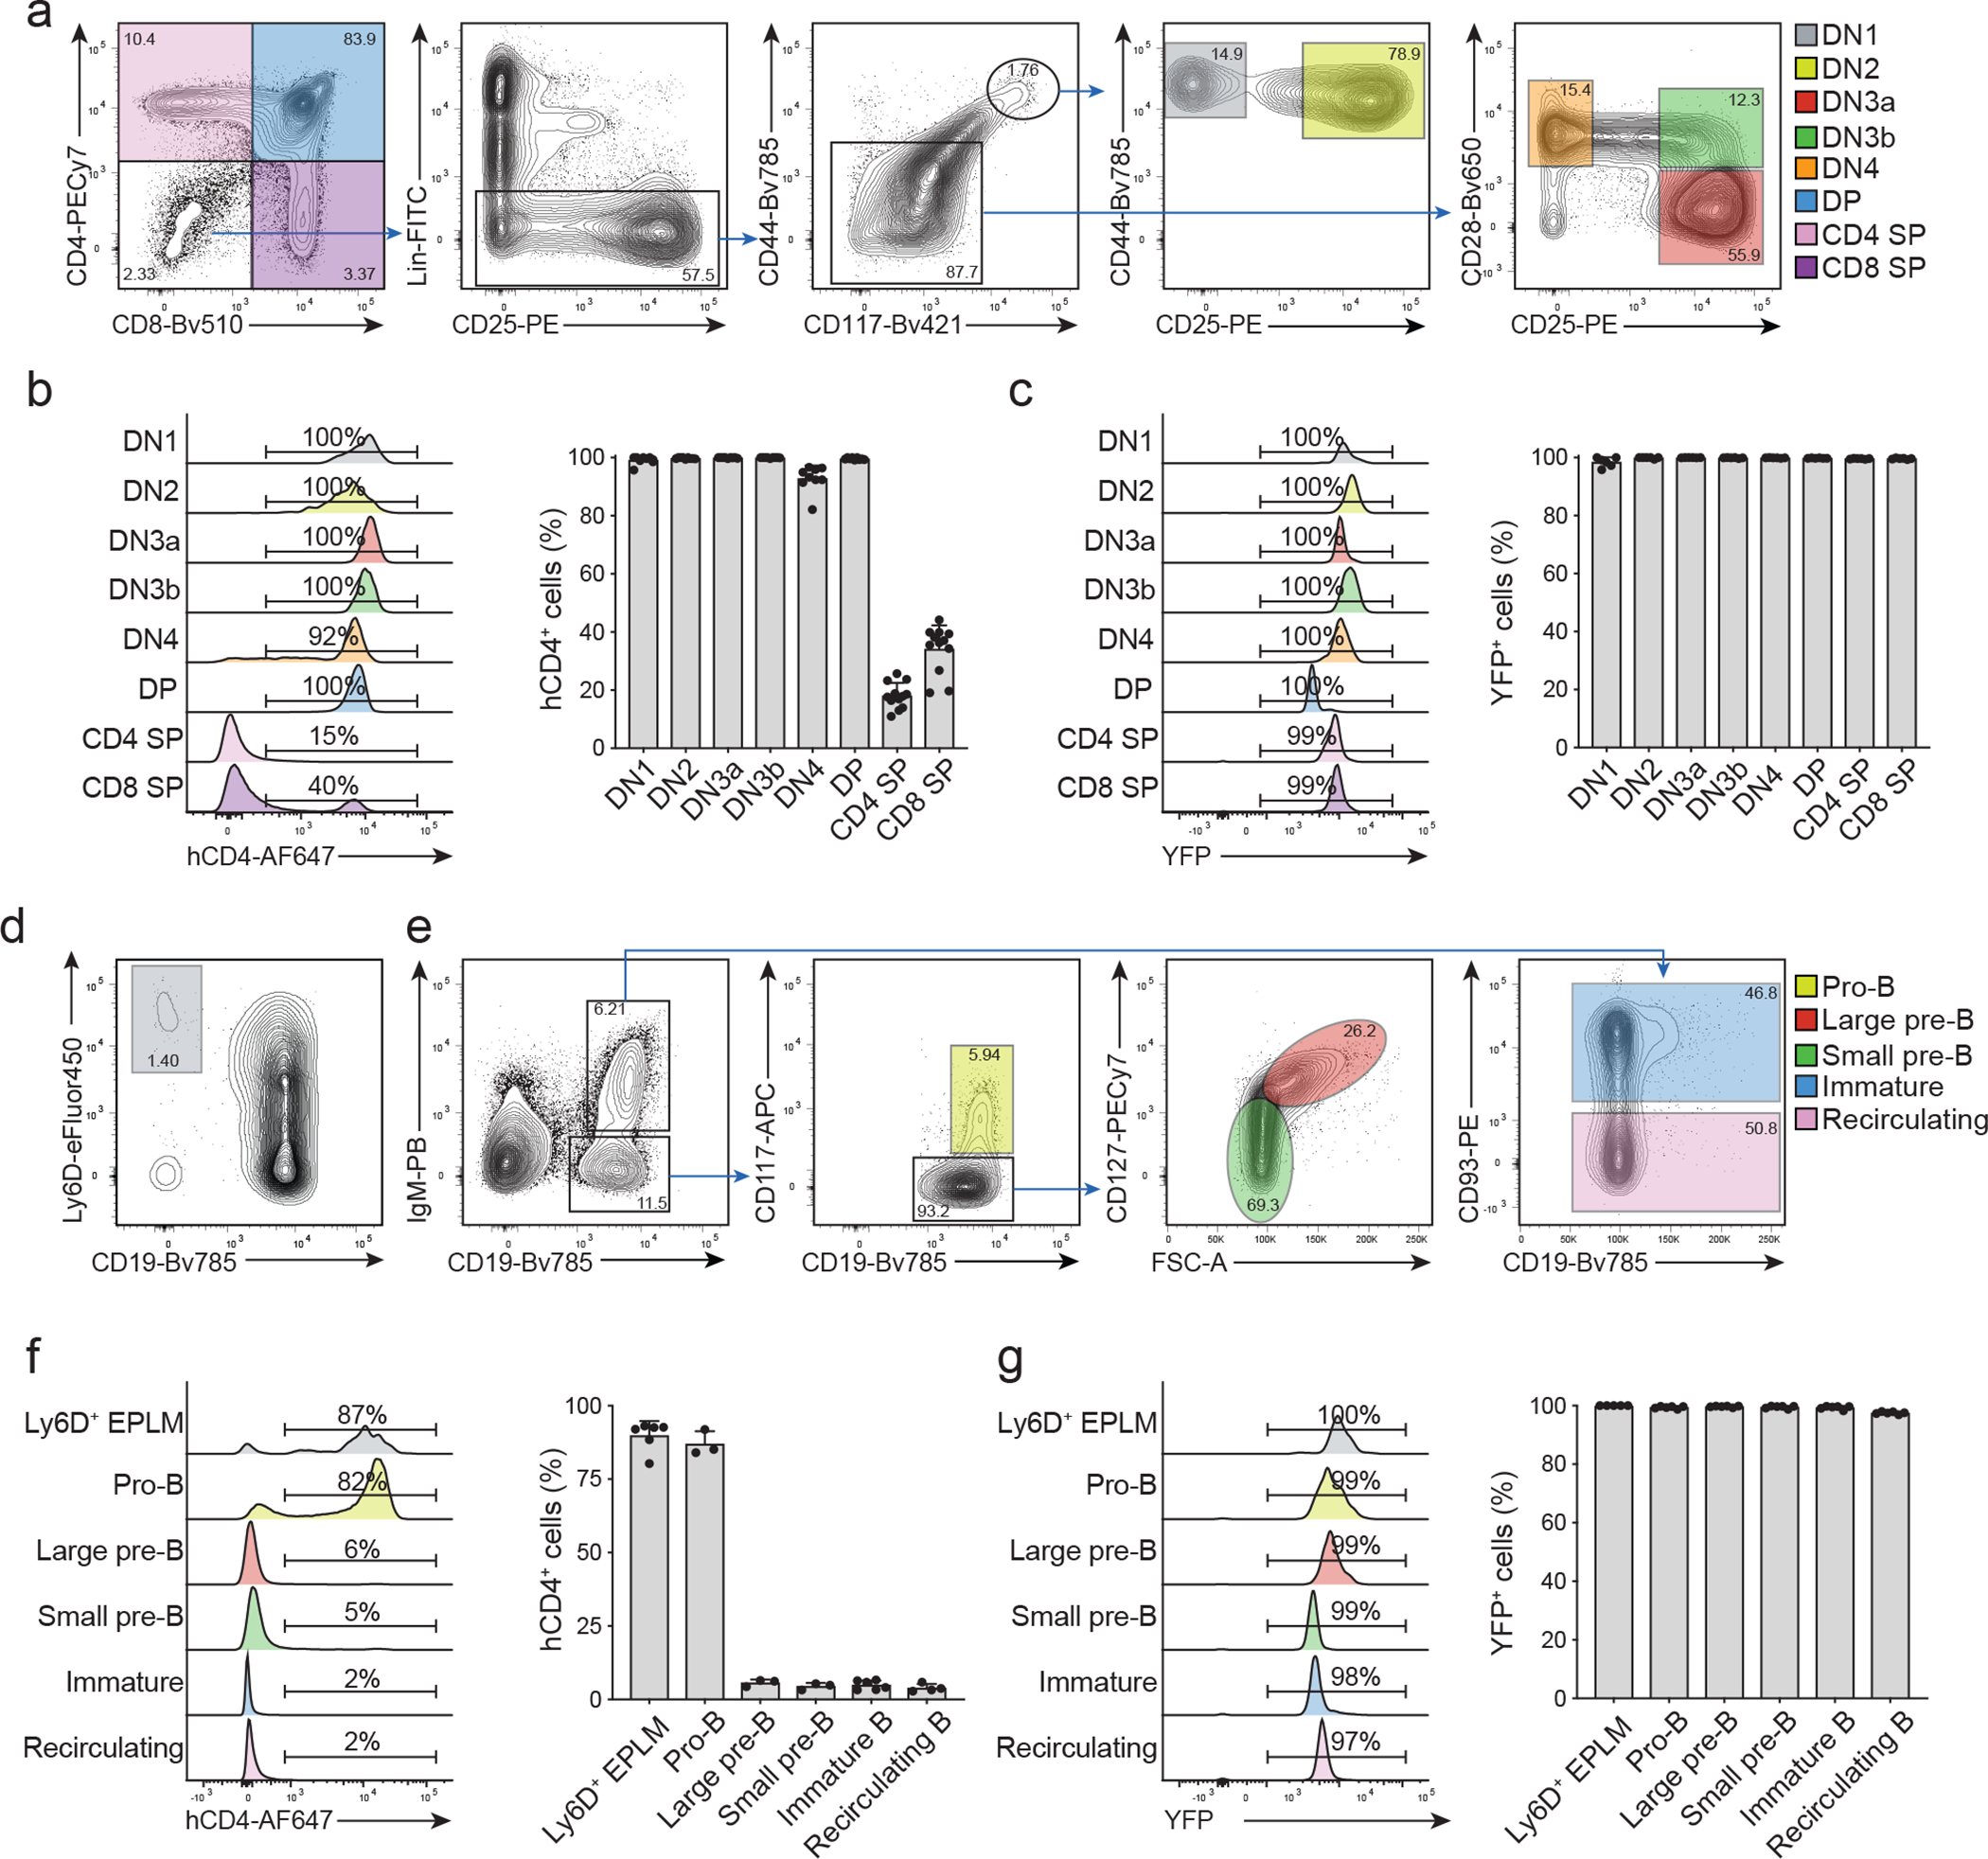
(a) Representative FACS plots showing the gating strategy for T-cell progenitors in the thymus: double negative (DN), double positive (DP) and CD4/CD8 single positive (SP).
(b-c) Representative histograms (left panels) and cumulative bar graphs (right panels) showing in (b) hCD4 (n=12) and in (c) YFP (n=6) expression in T-cell progenitors of 6–8 weeks old TdThCD4 “reporter” (b) and TdTYFP “Lineage tracer” (c) mice, respectively. Shown are cumulative results from 3 independent experiments (n=number of mice analyzed). Error bars indicate standard error of the mean (SEM).
(d) Representative FACS plot showing the gating strategy to identify BM Ly6D+EPLMs on cells pre-gated for Lin−B220+CD117+ as indicated.
(e) Representative FACS plots showing the gating strategy for B cells and B cell progenitors in BM. The identified subsets (pro-B, large and small pre-B, immature and recirculating B cells) cells pre-gated on live and PI negative.
(f-g) Representative histograms (left panels) and cumulative bar graphs (right panels) showing in (f) hCD4 (Ly6D+ EPLM, immature B n=6; pro-B, large pre-B, small pre-B n=3; recirculating B n=4) and in (g) YFP (n=6) expression in B-cell progenitors of 6–8 weeks old TdThCD4 “reporter” (f) and TdTYFP “Lineage tracer” (g) mice, respectively. Shown are cumulative results from 3 independent experiments (n=number of mice analyzed). Error bars indicate s.e.m.
TdT-fate mapping labels across all hematopoietic lineages
hCD4 expression on TdThCD4 was down-modulated on all mature cells (Extended Data 2a–d), except for: plasmacytoid dendritic cells (pDCs), corroborating their lymphoid origin28, 29, and a small fraction of splenic CD4+, CD8+ and γδ T cells, likely representing recent thymic emigrants (Fig. 2a). Surprisingly, YFP expression was detected at different frequencies across all hematopoietic subsets analyzed, reaching 20–30% on platelets and pro-erythrocytes, 50–80% in myeloid subsets (Fig. 2b). Since P2A mediates in-frame translation of Dntt with hCD4 or iCRE we could exclude leakage but rather hypothesize that TdT or iCre expression occurred in a multipotent progenitor, resulting the YFP labelling across all lineages.
Fig. 2. TdT expression and tracing across mature cell and progenitors.
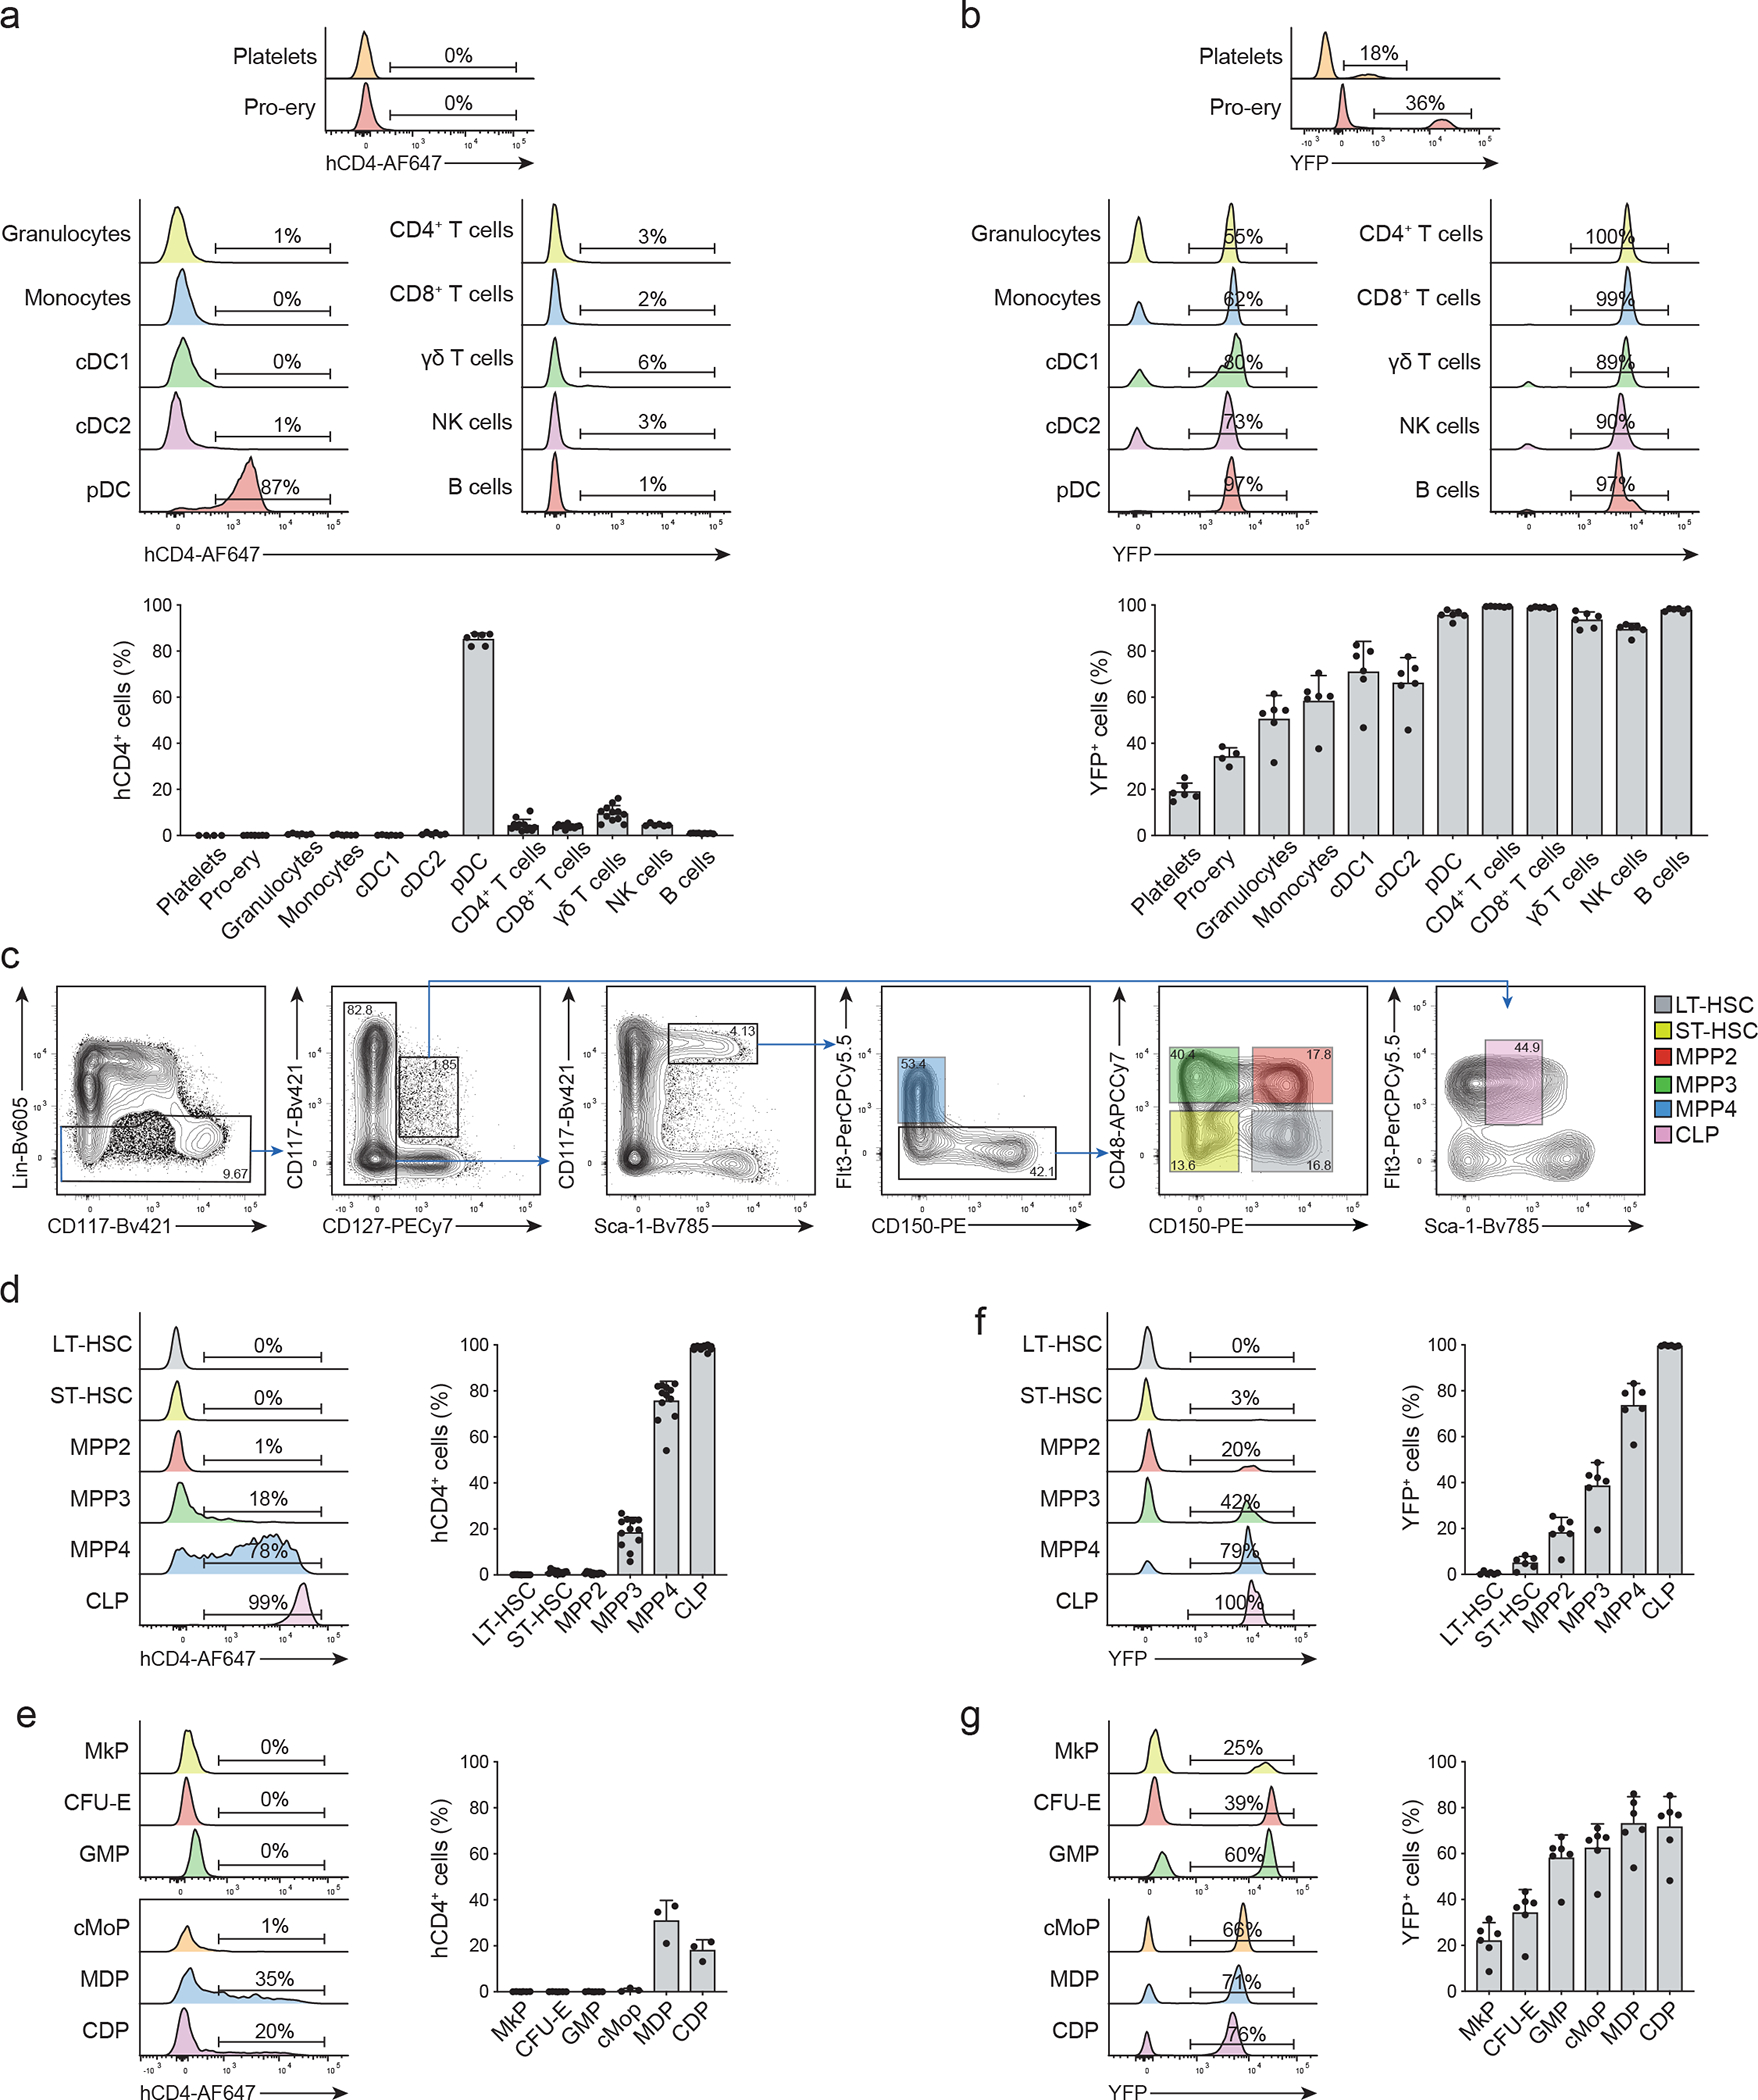
(a-b) Representative histogram plots (upper panels) and cumulative bar graphs (lower panels) showing in (a) hCD4 (Platelets n=4; pro-erythrocytes n=7; granulocyte, monocyte, cDC1, cDC2, pDC, NK cells n=6; CD4+ T cells, CD8+ T cells, γδ T cells n=12; B cells n=9) and in (b) YFP (n=6) expression for different mature hematopoietic subsets in 6–8 weeks old TdThCD4 “reporter” (a) and TdTYFP “Lineage tracer” (b) mice, respectively. Shown are BM cells for pro-erythrocytes, blood mononuclear cells for platelets, and splenocytes for all other subsets. The gating strategies to identify the corresponding cell types are shown in Extended Data 2a–d. Shown are cumulative results from 3 independent experiments. Error bars indicate s.e.m.
(c-g) BM progenitors gated as shown in (c) and in Extended Data 2f,g were analyzed for the expression of hCD4 (d, e) and YFP (f, g) in 6–8 weeks old TdThCD4 “reporter” (d, e) and TdTYFP “Lineage tracer” (f, g) mice. (c) HSC, MPP subsets and CLPs were identified by the indicated gates. (d-g) Representative histograms (left panels) and cumulative bar graphs (right panels) showing in (d, e) hCD4 and in (f, g) YFP expression for the indicated progenitor subsets. (d) n=12; (e) n=3; (f) n=6; (g) n=6. Shown are cumulative results from 3 independent experiments. Error bars indicate s.e.m.
We therefore analyzed hCD4 and YFP expression in TdThCD4 and TdTYFP mice across all LSK cells. To remove residual lymphoid progenitors within the LSK fraction we introduced an additional IL7R− gate and further subdivided LT- and ST-HSCs, MPP2s, MPP3s and MPP4 using CD48, CD150 and FLT3 (Fig. 2c; Extended Data 2e)15, 16, 29. As expected in TdThCD4 mice, hCD4 expression in MPP4s was the highest, reaching about 80% of labeling (Fig. 2d) This percentage increased along the lymphoid branch with almost 100% hCD4+ CLPs (Fig. 2d). Across all other progenitor subsets, we observed 20% hCD4+ MPP3s and 35% hCD4+ monocyte/dendritic cell progenitors (MDPs) (Fig. 2d,e; Extended data 2f,g). In lineage tracer TdTYFP mice about 80% MPP4s and all CLPs were labeled (Fig. 2f). Further about 20–40% MPP2s megakaryocyte progenitors (MkPs) and colony forming unit-erythrocyte (CFU-E) were YFP+, despite all being hCD4− (Fig. 2f,g), suggesting that iCre was initiated in a TdT+ progenitor upstream these developmental stages. Along the myeloid developmental pathway YFP labeling on mature subsets was consistent with their immediate precursors, as evidenced by the 50%–70% labelling of granulocyte-monocyte progenitors (GMPs), monocyte progenitors (cMoPs), monocyte-dendritic cell progenitors (MDPs), common dendritic cell progenitors (CDPs) and their direct progeny (Fig. 2b,g).
Given that all LT-HSCs were YFP-hCD4-, but YFP and hCD4 labelling could be detected across all lineages, we hypothesized the existence of a TdT+hCD4+ progenitor. Since a small fraction of about 3% ST-HSCs were YFP+, labelling could have occurred within this fraction. However, hCD4 that proceeded YFP labelling was evident only in few mice and at the limit of detection (Fig. 2d, Extended Data 2h,i), while YFP was present on all mice analyzed, excluding the possibility that labeling was initiated within this subset but rather suggesting that YFP+ ST-HSCs were also downstream a hCD4+ multipotent precursor. About 20% of MPP2s expressed YFP, however since hCD4 was almost undetectable (Fig. 2d; Extended Data 2h,i), we could exclude that YFP labelling is initiated within this subset. Moreover, these results indicated that the expression of the lymphoid-specific gene Dntt was uncoupled from lymphoid-lineage restriction on a significant fraction of MPPs and that at least two developmental pathways along the erythroid and the myeloid lineage are possible, one from a YFP− and one from a YFP+ progenitor.
TdT− MPP4s are multipotent progenitors
To understand the developmental pathways and the plasticity of the different MPP subsets in view of their TdT and YFP expression, we crossed the TdTiCre line with Rosa26mTmG mice (hereafter TdTmTmG). In these mice, induction of iCre excises the Tomato cassette, leading to the loss of the constitutive Tomato expression with concomitant induction of GFP. During a short time-window, cells are Tomato+GFP+, until Tomato is degraded or sufficiently diluted through proliferation. Developmental progression occurs from Tomato+GFP−, to Tomato+GFP+, and finally to Tomato−GFP+cells, enabling the earliest detection of iCre, and therefore of TdT in TdTmTmG mice. LT-HSCs were exclusively Tomato+GFP− (Fig. 3a,b; Extended Data 3a–d), confirming that they are upstream of all compartments. We than assessed Tomato expression within GFP+LSKs and observed about 7% TomatohiGFP+ MPP4s, which also displayed the highest tomato expression across all MPPs (Fig. 3a,b; Extended Data 3b–d). When back-gating on TomatohiGFP+ cells, 92% MPP4s and about 2–3% were MPP3 (Fig. 3b, Extended Data 3b–d), suggesting that either both or one of the two subsets was responsible for the multilineage labeling. No TomatohiGFP+ cells were detected within the MPP2 or ST-HSC gates (Fig. 3b; Extended Data 3b–d), corroborating that YFP labeling was not initiated within either subset but rather GFP+ MPP2 and ST-HSCs must have differentiated from TomatohighGFP+ MPP4s or MPP3s, where iCre expression was initiated.
Fig. 3. Functional heterogeneity of MPPs by TdT lineage tracing.
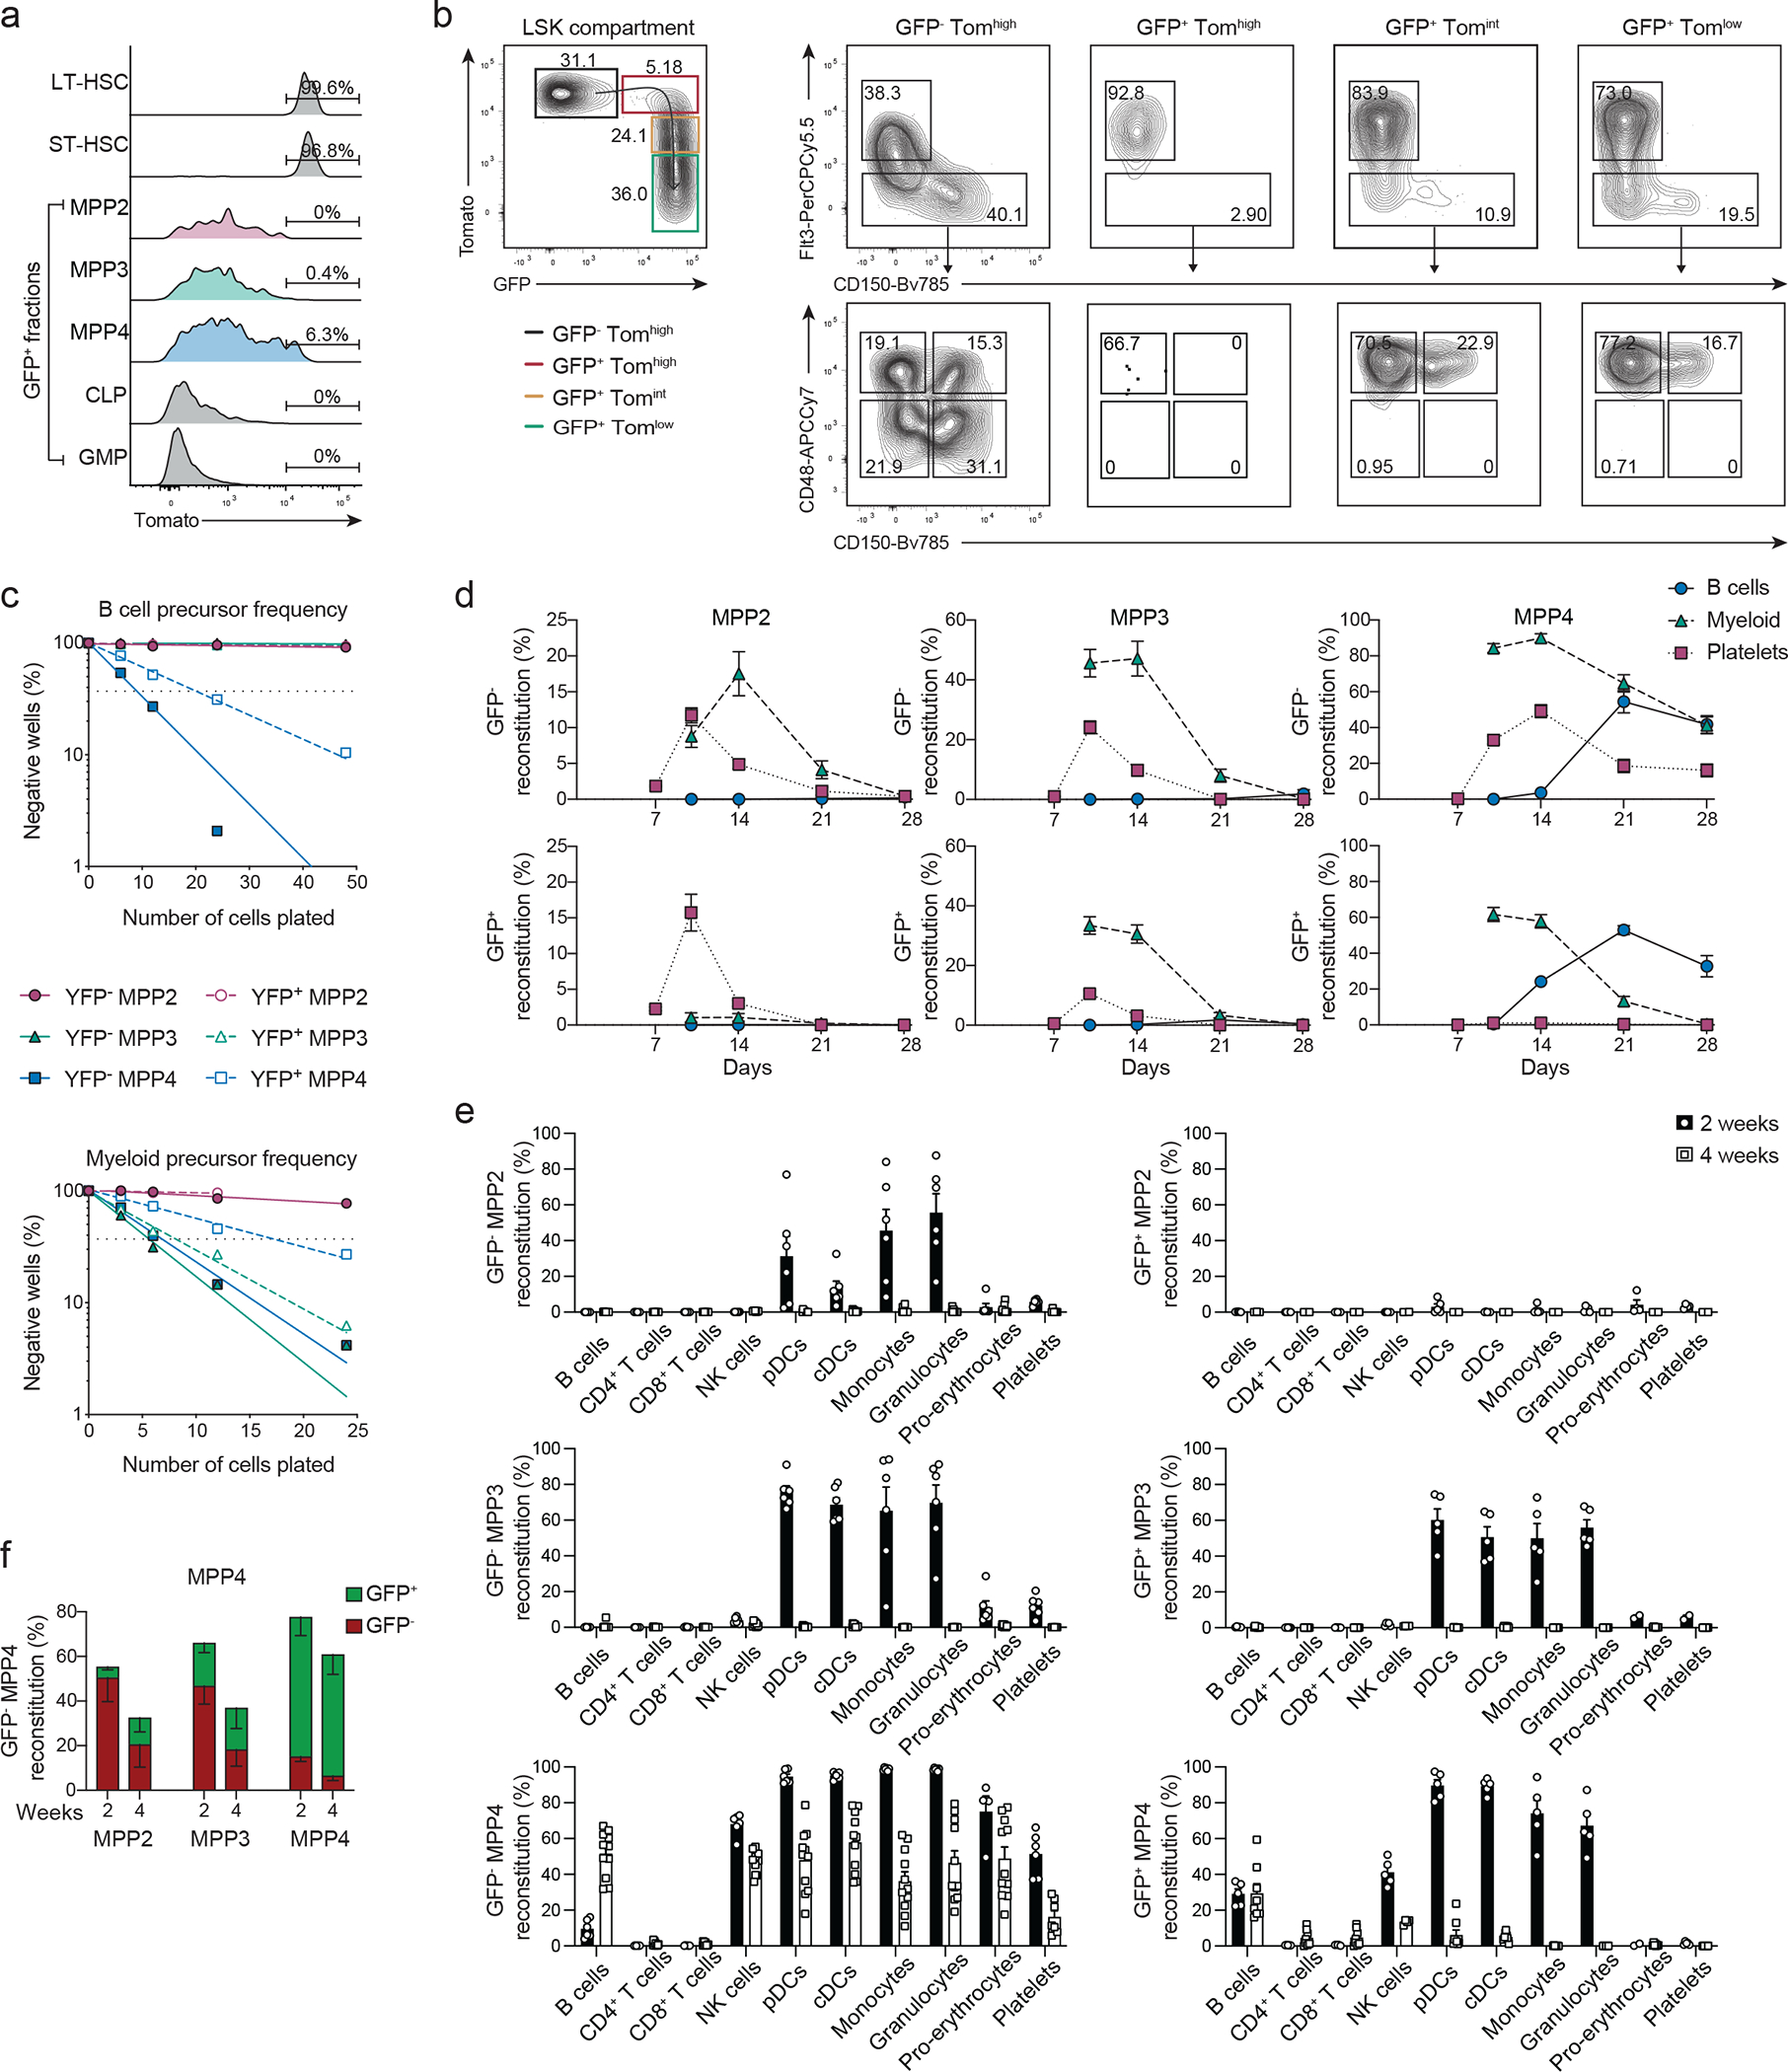
(a-b) BM cells from 6–8 weeks old TdTmTmG mice were analyzed for the expression of Tomato and GFP. (a) Shown are representative histograms for Tomato expression from 2 independent experiments (n=3) for LT-, ST-HSC and GFP+ MPPs, CLPs and GMPs gated as in Fig. 2c; Extended Data 2f. (b) Two color histograms showing the expression of FLT3 and CD150 (right panels top row) or CD48 and CD150 (right panels bottom row) of LSK pre-gated as TomatohiGFP− (black), TomatohiGFP+ (red), TomatointGFP+ (Yellow), TomatolowGFP+ (green) as shown in the left plot.
(c) B- (top plot) and myeloid (bottom plot) precursor frequency determined by in vitro limiting dilution assays for MPP2s, MPP3s, and MPP4s (gated as in Fig. 2c) isolated from the BM of 6–8 weeks old TdTYFP mice. MPP subsets are sorted as YFP− or YFP+ as indicated. Shown is one representative experiment (n=3).
(d-e) 4000 MPPs (gated as in Fig. 2c) were isolated from the BM of 6–8 weeks old TdTmTmG mice and transferred intra venously (i.v.) into sub-lethally irradiated WT recipients. Shown is the reconstitution for each GFP+ or GFP− MPP subset as indicated. (d) Percent reconstitution curves in peripheral blood of recipient animals for B cells (CD19+, CD11b−), myeloid cells (CD11b+, CD3−, NK1.1−) and platelets (FSClow, Ter119−, CD41+, CD61+) determined at the indicated timepoints after transfer: day 7, 10, 14, 21, and 28 for platelets and on days 10, 14, 21, and 28 for B and myeloid cells. Shown are cumulative data from 3–6 independent experiments n=2–17 (e) Shown are percent reconstitution of recipient animals for mature subsets (gated as in Extended Data 2a–d) after two and four weeks in the bone marrow (pro-Erythrocytes), peripheral blood (platelets) and spleen (all other subsets). Shown are cumulative data from 3 independent experiments per timepoint. Error bars indicate s.e.m.
(f) 4000 GFP− MPP4s were transferred into sub-lethally irradiated WT recipients. Shown are percent reconstitution in the bone marrow of recipient animals of Tomato+ (red bars) and GFP+ (green bars) MPP2s, MPP3s and MPP4s after two and four weeks. (Cumulative from 2 independent experiments. Two weeks n=10, four weeks n=7). Error bars indicate s.e.m.
To validate that multilineage potential was present within GFP+ MPP3s and/or GFP+ MPP4s in TdTmTmG mice or YFP+MPP3s and/or YFP+MPP4s in TdTYFP mice, we assessed their in vitro and in vivo differentiation potential. We established B and myeloid precursors frequency using limiting dilutions directly comparing YFP+ and YFP− MPP2, MPP3s and MPP4s isolated from TdTYFP mice. In contrast to previous reports12, 13, 15, 16, B cell potential was confined to MPP4s, with higher precursor frequency for YFP− cells (Fig. 3c). The exclusion of IL7R+ LSKs using an additional gate likely removed residual lymphoid precursors from MPP3s and MPP2s fractions (Extended Data 3e). Both YFP+ and YFP− MPP3s had myeloid potential (Fig. 3c), as previously reported 12, 15, 16. Importantly myeloid precursors were also present in MPP4s; with YFP− MPP4 showing comparable frequency to myeloid-biased MPP3 subsets (Fig. 3c), suggesting a possible superior multilineage potential compared to other MPPs. YFP− and YFP+ MPP2s had limited but consistent in vitro myeloid potential (Fig. 3c), as previously shown15, 16. To assess the in vivo reconstitution potential across all hematopoietic branches, including platelets and erythrocytes we had to used TdTmTmG instead of TdTYFP mice, where tomato be traces pro-erythro/megakaryocyte. We transferred individual GFP− and GFP+ MPP2s, MPP3s or MPP4s into sub-lethally irradiated CD45.1 congenic mice and monitored their progeny independently of GFP expression every week for 4 weeks (Extended Data 3f–h). GFP− MPPs had an overall higher and broader reconstitution potential (Fig. 3d,e) compared to their GFP+ counterpart. Within individual MPP subsets, GFP+MPP2s were mostly restricted to the megakaryocyte lineage, while GFP− MPP2s generated also myeloid progeny (Fig. 3d,e). Similarly, GFP− MPP3s were overall more efficient than GFP+ at reconstituting the erythro-myeloid compartment (Fig. 3d,e). Independently of GFP expression, both MPP2s and MPP3s lacked B cell potential in vivo validating the above mentioned in vitro obtained results. Only GFP− MPP4s showed multipotency, giving rise to all three: erythroid, myeloid and lymphoid lineages, whereas GFP+ MPP4s had no erythroid-megakaryocyte potential (Fig. 3d,e) suggesting that acquisition of GFP or YFP on MPP2s and MPP4s, lead to the extinction of their myeloid or platelet potential, respectively. As such, expression of TdT or GFP in TdTmTmG or YFP in TdTYFP mice marked the first step of lineage restriction.
Reconstitution of short-lived myeloid cells and pro-erythrocytes was maintained beyond 4 weeks post-transplantation only from GFP− MPP4s (figure 3d,e), suggesting that this subset was upstream of all other MPPs and possibly related to HSCs. GFP− MMP4s reconstituted not only mature subsets across all lineages, but also all MPP subsets 2 and 4 weeks after transfer (Fig. 3f), while neither GFP+ MPP4s nor MPP3s or MPP2s, independently of their GFP expression, gave rise to MPPs (Extended data 3i).
To assess the long-term potential of YFP− MPP4s, we co-transferred them with equal numbers of CD45.1/2 LT-HSCs (Extended Data 3j) or ST-HSCs (Extended Data 3k) into CD45.1 congenic mice. As shown, myeloid progeny, which is devoid of self-renewal capacity, derived from YFP− MPP4s is extinguished after 4 weeks, suggesting multilineage potential but lack of self-renewal capacity.
Single-cell profiling of MPP subsets reveals heterogeneity
To assess the heterogeneity within the MPP and HSC compartments, we used single-cell RNA-sequencing, including cellular indexing of transcriptomes and epitopes by sequencing (CITE-Seq)30, of LSKs isolated from TdThCD4 crossed to TdTYFP mice (thereafter TdThCD4/YFP). For the CITE-Seq, we used oligo-coupled antibodies targeting hCD4; CD135 (FLT3), CD48 and CD150, to be able to back-gate on MPP subsets; markers known to be expressed on progenitors: CD9, CD41, CD55, CD105, CD115, CXCR4 and ESAM. 15,853 LSK cells were retained across four biological replicates, displaying an average of 3,999 detected genes/cell after filtering out proliferating cells and low-quality cells, to limit the influence of cell cycle (Methods, Extended Data 4a–d). Clustering analysis resulted in 8 clusters, illustrated on a Uniform Manifold Approximation and Projection (UMAP) 2D space (Fig. 4a). Using CD48, CD150 and CD135 together with the Flt3 transcript we achieved an optimal resolution to perform “a posteriori” gating of LSK and MPP subsets (Extended Data 4e,f). Gated HSCs and MPPs were projected into the UMAP space (Fig. 4b) and analyzed for their cluster distribution (Fig. 4b), allowing us to perform a direct comparison of the transcriptional profiles with the functional data obtained above (Extended Data 4g). This gating strategy confirmed that the excluded clusters of proliferating cells were enriched for the MPP2 and MPP3 subsets, and depleted for HSCs (Extended Data 4d)31. Further, to relate to previously published datasets, we performed a classical cell-type annotation based on the transcriptome similarity of each cell to reference bulk RNA-seq samples from the ImmGen platform (http://www.immgen.org/)32, 33 and from a progenitor-specific collection in ref12 (Fig. 4c; Extended Data 4h). Cells were color coded based on their ImmGen referenced annotation and projected into the transcriptional UMAP 2D space (Fig. 4c) or analyzed for their cluster distribution, as obtained from the single-cell transcriptional profiles (Fig. 4d–g; Extended Data 4g).
Fig. 4. CITE-Seq reveals heterogeneity and lineage bias within LSKs.
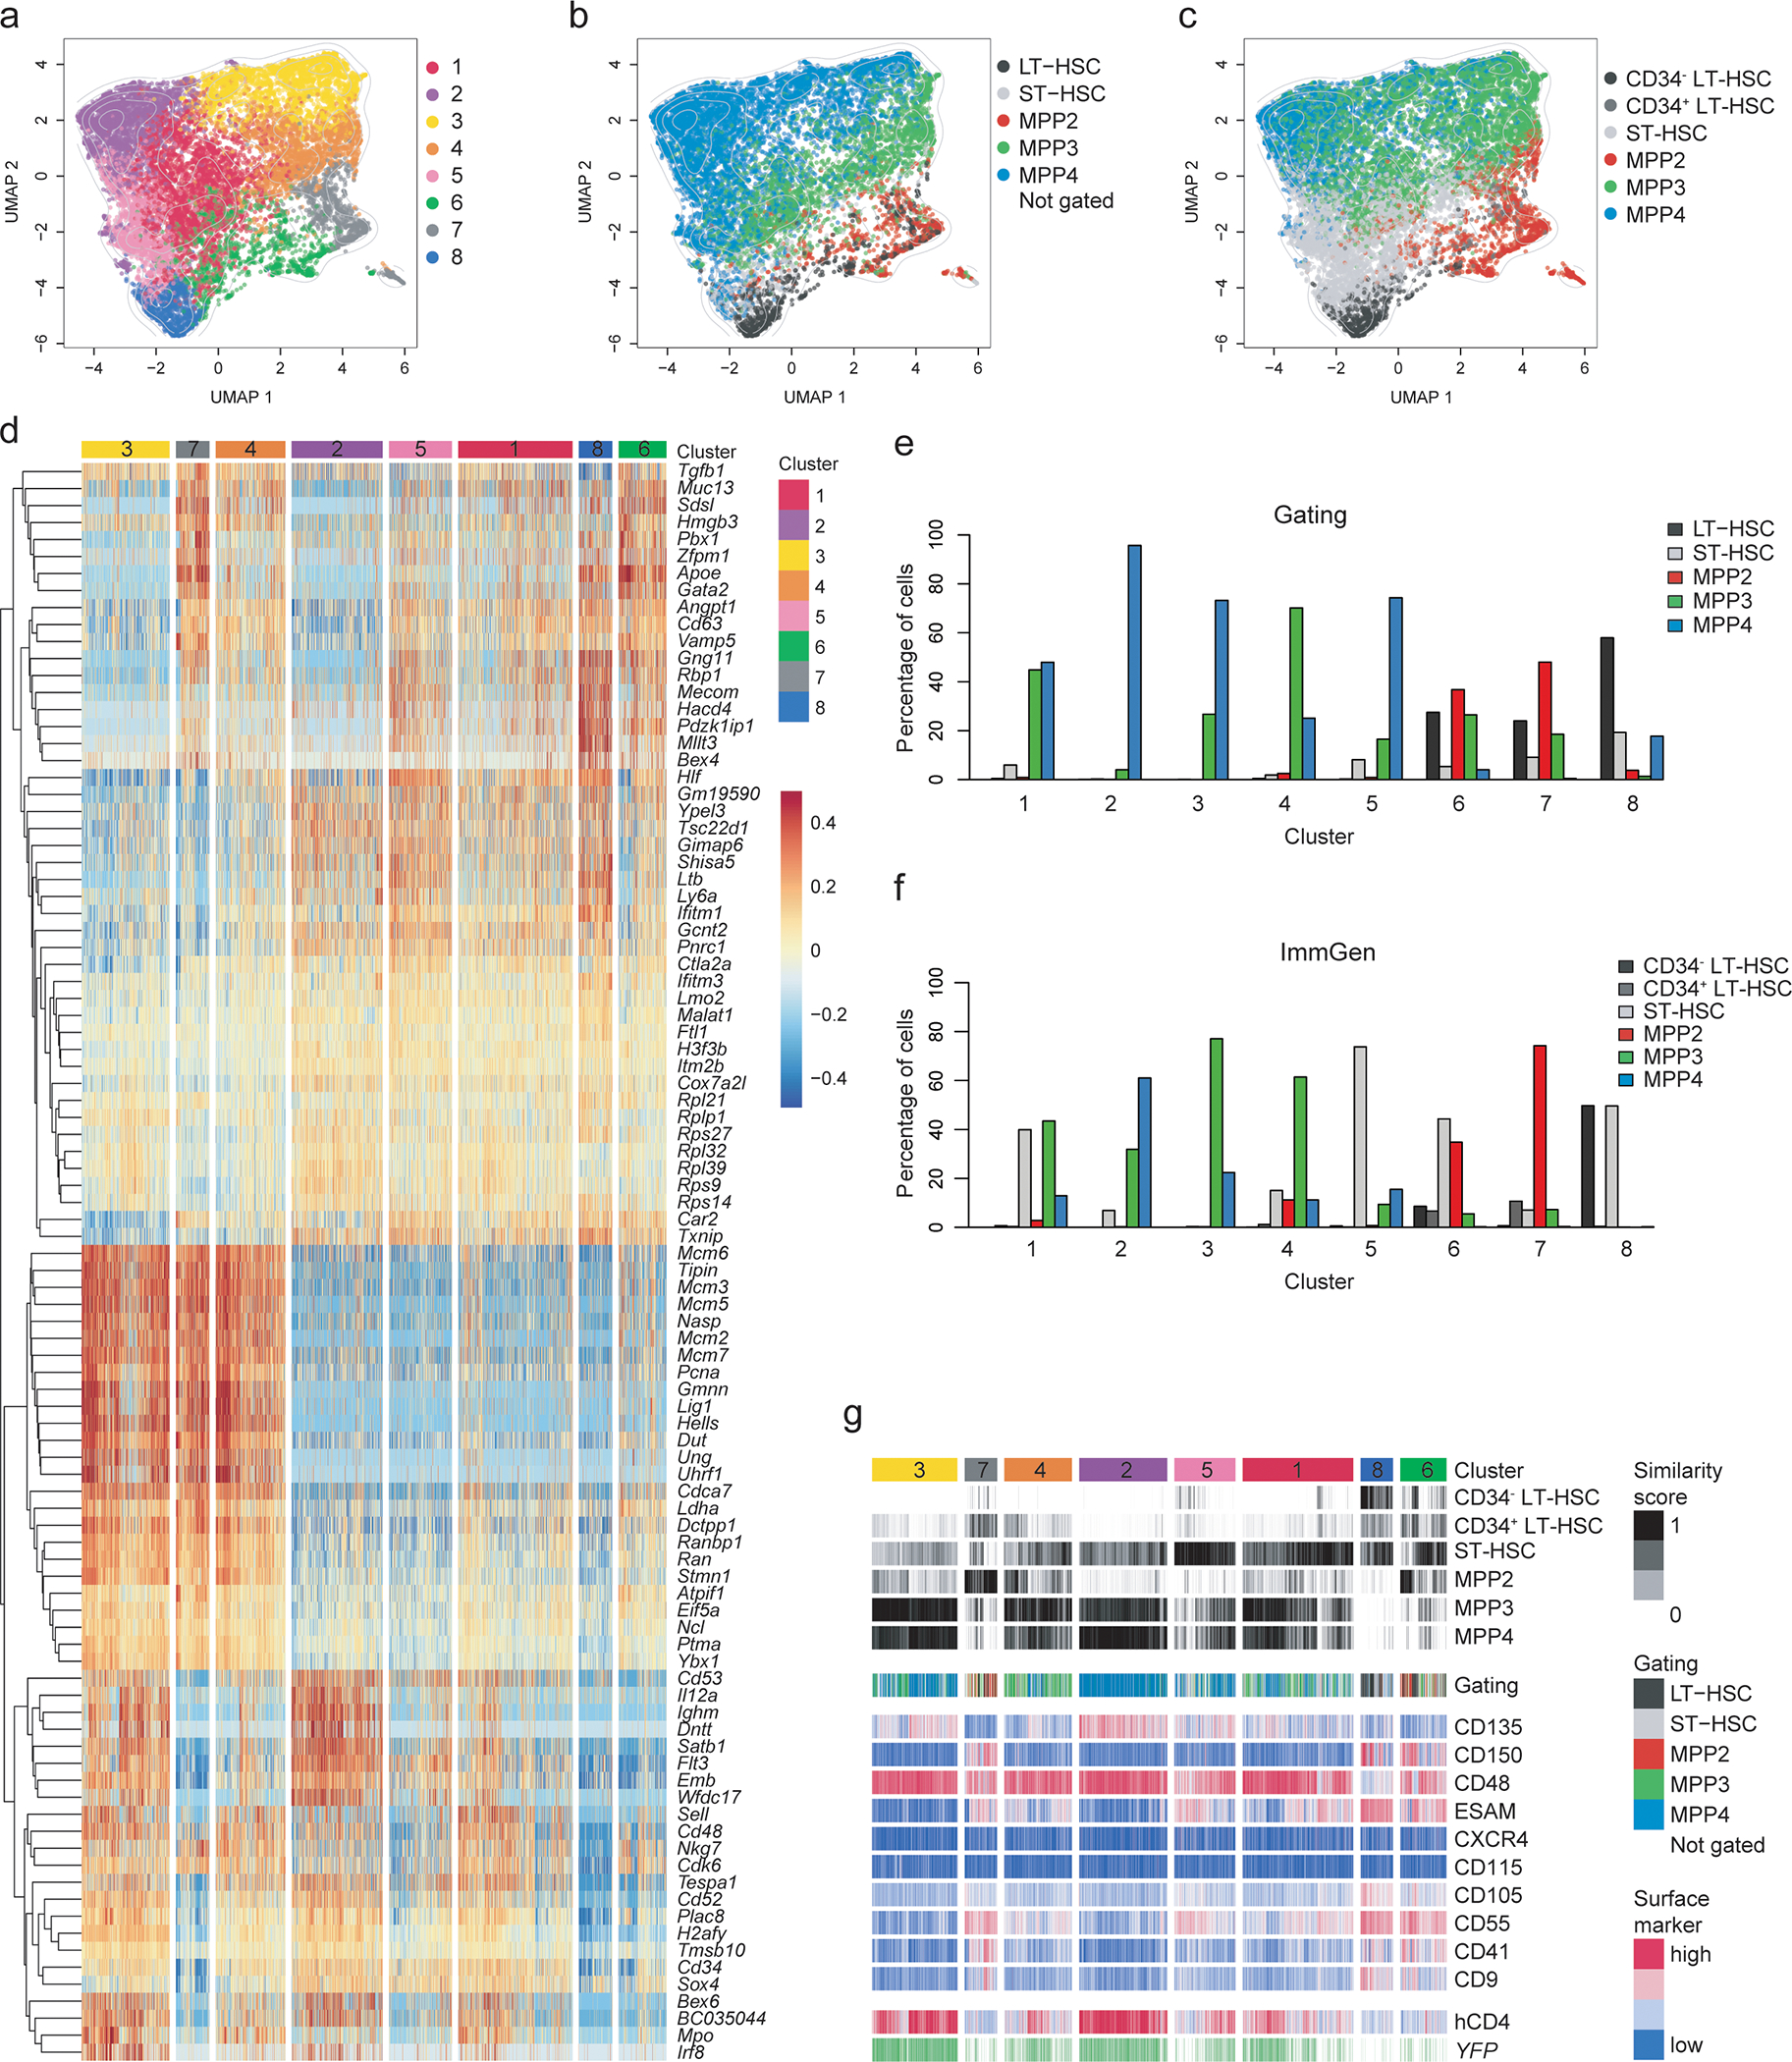
LSK cells isolated from the BM of four 6–8 weeks old TdThCD4/YFP double reporter mice were used for single-cell RNA sequencing in combination with CITE-Seq as described in the methods.
(a-c) Hierarchical clustering analysis was performed on 15,853 LSKs and projected in a 2-dimensional space using UMAP. Each color represents a specific cluster as indicated. (a) Hierarchical clustering identified 8 clusters. (b) Cells were annotated based on CITE-Seq antibody labeling applying an “a posteriori” gating strategy as shown in Extended Data 4e. (c) Cells were annotated based on transcriptional similarity to the ImmGen reference data set and annotated accordingly using the ImmGen subset definition applied for the sorting. (b-c) Cells which could not be assigned to a subset, or a reference population, are not shown. Contour lines display the 2D cell density obtained for (a) on the UMAP space.
(d) Heatmap displaying the centered and scaled expression of the top 30 markers upregulated in each cluster, defined as in (a). Shown are 104 markers. Cells were ordered following the hierarchical clustering tree.
(e-f) Bar graphs showing the percent of cells belonging to each cluster defined as in (a) and distributed according to the “a posteriori” gating strategy used in (b) or according to the ImmGen annotation as defined in (c) as shown in the legend.
(g) Compiled data showing the cluster distribution defined as in (a) (top row) in relation to the similarity score to reference samples from the ImmGen dataset defined as in (c) or the cell-type annotation based on the “a posteriori” gating strategy defined as in (b); The expression of CITE-Seq markers, YFP transcript and hCD4 is centered and scaled.
The heterogeneity of each gated subset observed in the TdThCD4/YFP mice reflected the transcriptional profiling, where heatmap of cluster-defining genes highlighted profound differences (Fig. 4d). While some genes appeared exclusively expressed in one cluster, most transcripts had shared expression patterns (Fig. 4d; Extended Data 4g), suggesting a dynamic range of expression. Clusters 8 and 5 best represented HSCs based on their expression profiles, their similarity to the ImmGen profiles and their gating profiles (Fig. 4; Extended Data 4g–i,5a). Cluster 2 identified with the lymphoid-biased population; clusters 6 and 7 contained erythroid-related transcripts and were therefore erythro-megakaryocyte biased; cluster 4 showed a myeloid profile, while cluster 3 appeared to display a wide range of lineage specific genes, suggesting a yet uncommitted transcriptional profile (Fig. 4d–g; Extended Data 4g). Cluster 1 showed low expression of lineage-specific genes and some transcriptional similarity to the HSC-like cluster 5 (Fig. 4a,d).
The clustering analysis based on scRNA-seq only partially overlapped with the analysis using the gated subsets (Fig. 4e; Extended Data 4g) or the ImmGen assignment (Fig. 4f,g). It confirmed the similarity of clusters 8 and 5 to LT- and ST-HSC, but also revealed that a significant part of gated MPP4s included cells belonging to these HSC representing clusters (Fig. 4e; Extended Data 4g). Gated MPP2 were mostly represented by the transcriptional clusters 6 and 7, both highly enriched in erythroid-megakaryocyte transcripts such as Gata1, Klf1, Vwf, and Pf434 (Fig. 4d–g; Extended Data 4g,5b).
Cluster 4 was highly enriched for myeloid-related genes: Mpo, Irf8, Ctsg and Elane (Extended Data 5c), and appeared to be mostly represented by gated MPP3s (Fig. 4d). However, when gated, MPP3s distributed predominately across clusters 1, 3 and 4, revealing their transcriptional heterogeneity (Fig. 4e, Extended Data 4g, 5b). Cluster 2, which expressed lymphoid hallmark genes: Ighm, Ighd, Notch1 and Lck (Fig. 4d; Extended Data 4g, 5c), contained exclusively MPP4s (Fig. 4e). However, when gated, lymphoid biased MPP4s comprised multiple clusters besides cluster 2 (Fig. 4b,e; Extended Data 4g), validating their multilineage capacity. The ability of sorted MPP4 to generate myeloid progeny could be ascribed to the inclusion of clusters 3 and 4 (Fig. 4d). Similarly, the capacity of MPP4s to give rise to erythroid progeny as well as developing into all MPP subsets could be explained by the presence of clusters 1, 5 and 8 (Fig. 4e; Extended Data 4g). The transcriptional profile of cluster 1, owing to its “central” position in the UMAP space, had a lineage-undefined profile (Fig. 4d), which was reflected in a mixed gating distribution (Fig. 4e,f). Collectively, this analysis showed the transcriptional heterogeneity of the individual MPP but enabled us to identify within the gated MPP4 compartment a fraction of cells that transcriptionally aligned with HSCs.
Multi-lineage potential is present within MPP4s
Since YFP− MPP4 had the broadest in vivo and in vitro potential, we specifically focused our computational analysis taking advantage of Dntt, hCD4 and YFP expression using transcript as well as CITE-Seq antibody-mediated detection. Hypothetically, Dntt and hCD4 (CITE-Seq) should be equally expressed, however antibody tagging showed a higher detection (Extended Data 6a). To relate the functional data obtained above by sorting YFP+ and YFP− MPPs, we directly compared the transcriptional profiles of each MPP subset based on YFP expression (Fig. 5a–c). Within MPP2s we did not observe any major differences in their transcriptome aside YFP (Fig. 5a). YFP− MPP2s expressed slightly higher levels of CD41 (Fig. 5a), which had been previously associated with early hematopoiesis35. Both subsets were equally represented by clusters 6 and 7 (Fig. 5b,c), suggesting that the functional difference observed above for GFP+ and GFP− MPP2 was not explained by a different cluster distribution for YFP− and YFP+ MPP2s, nor by major transcriptional difference. It is however possible that more subtle differences in the transcriptional landscape may exist at chromatin landscape. Gated MPP3s comprised clusters 1, 3 and 4, however only YFP+ MPP3s included the myeloid-biased cluster 3, resulting in 1574 DEG between YFP+ and YFP− MPP3s (Fig. 5a–c). Furthermore, YFP− MPP3s, showed higher percentage of the erythroid primed clusters 6 and 7, and the more transcriptionally uncommitted clusters 1 and 5 (Fig. 5c).
Fig. 5. Plasticity and multi-lineage potential of MPP4s.
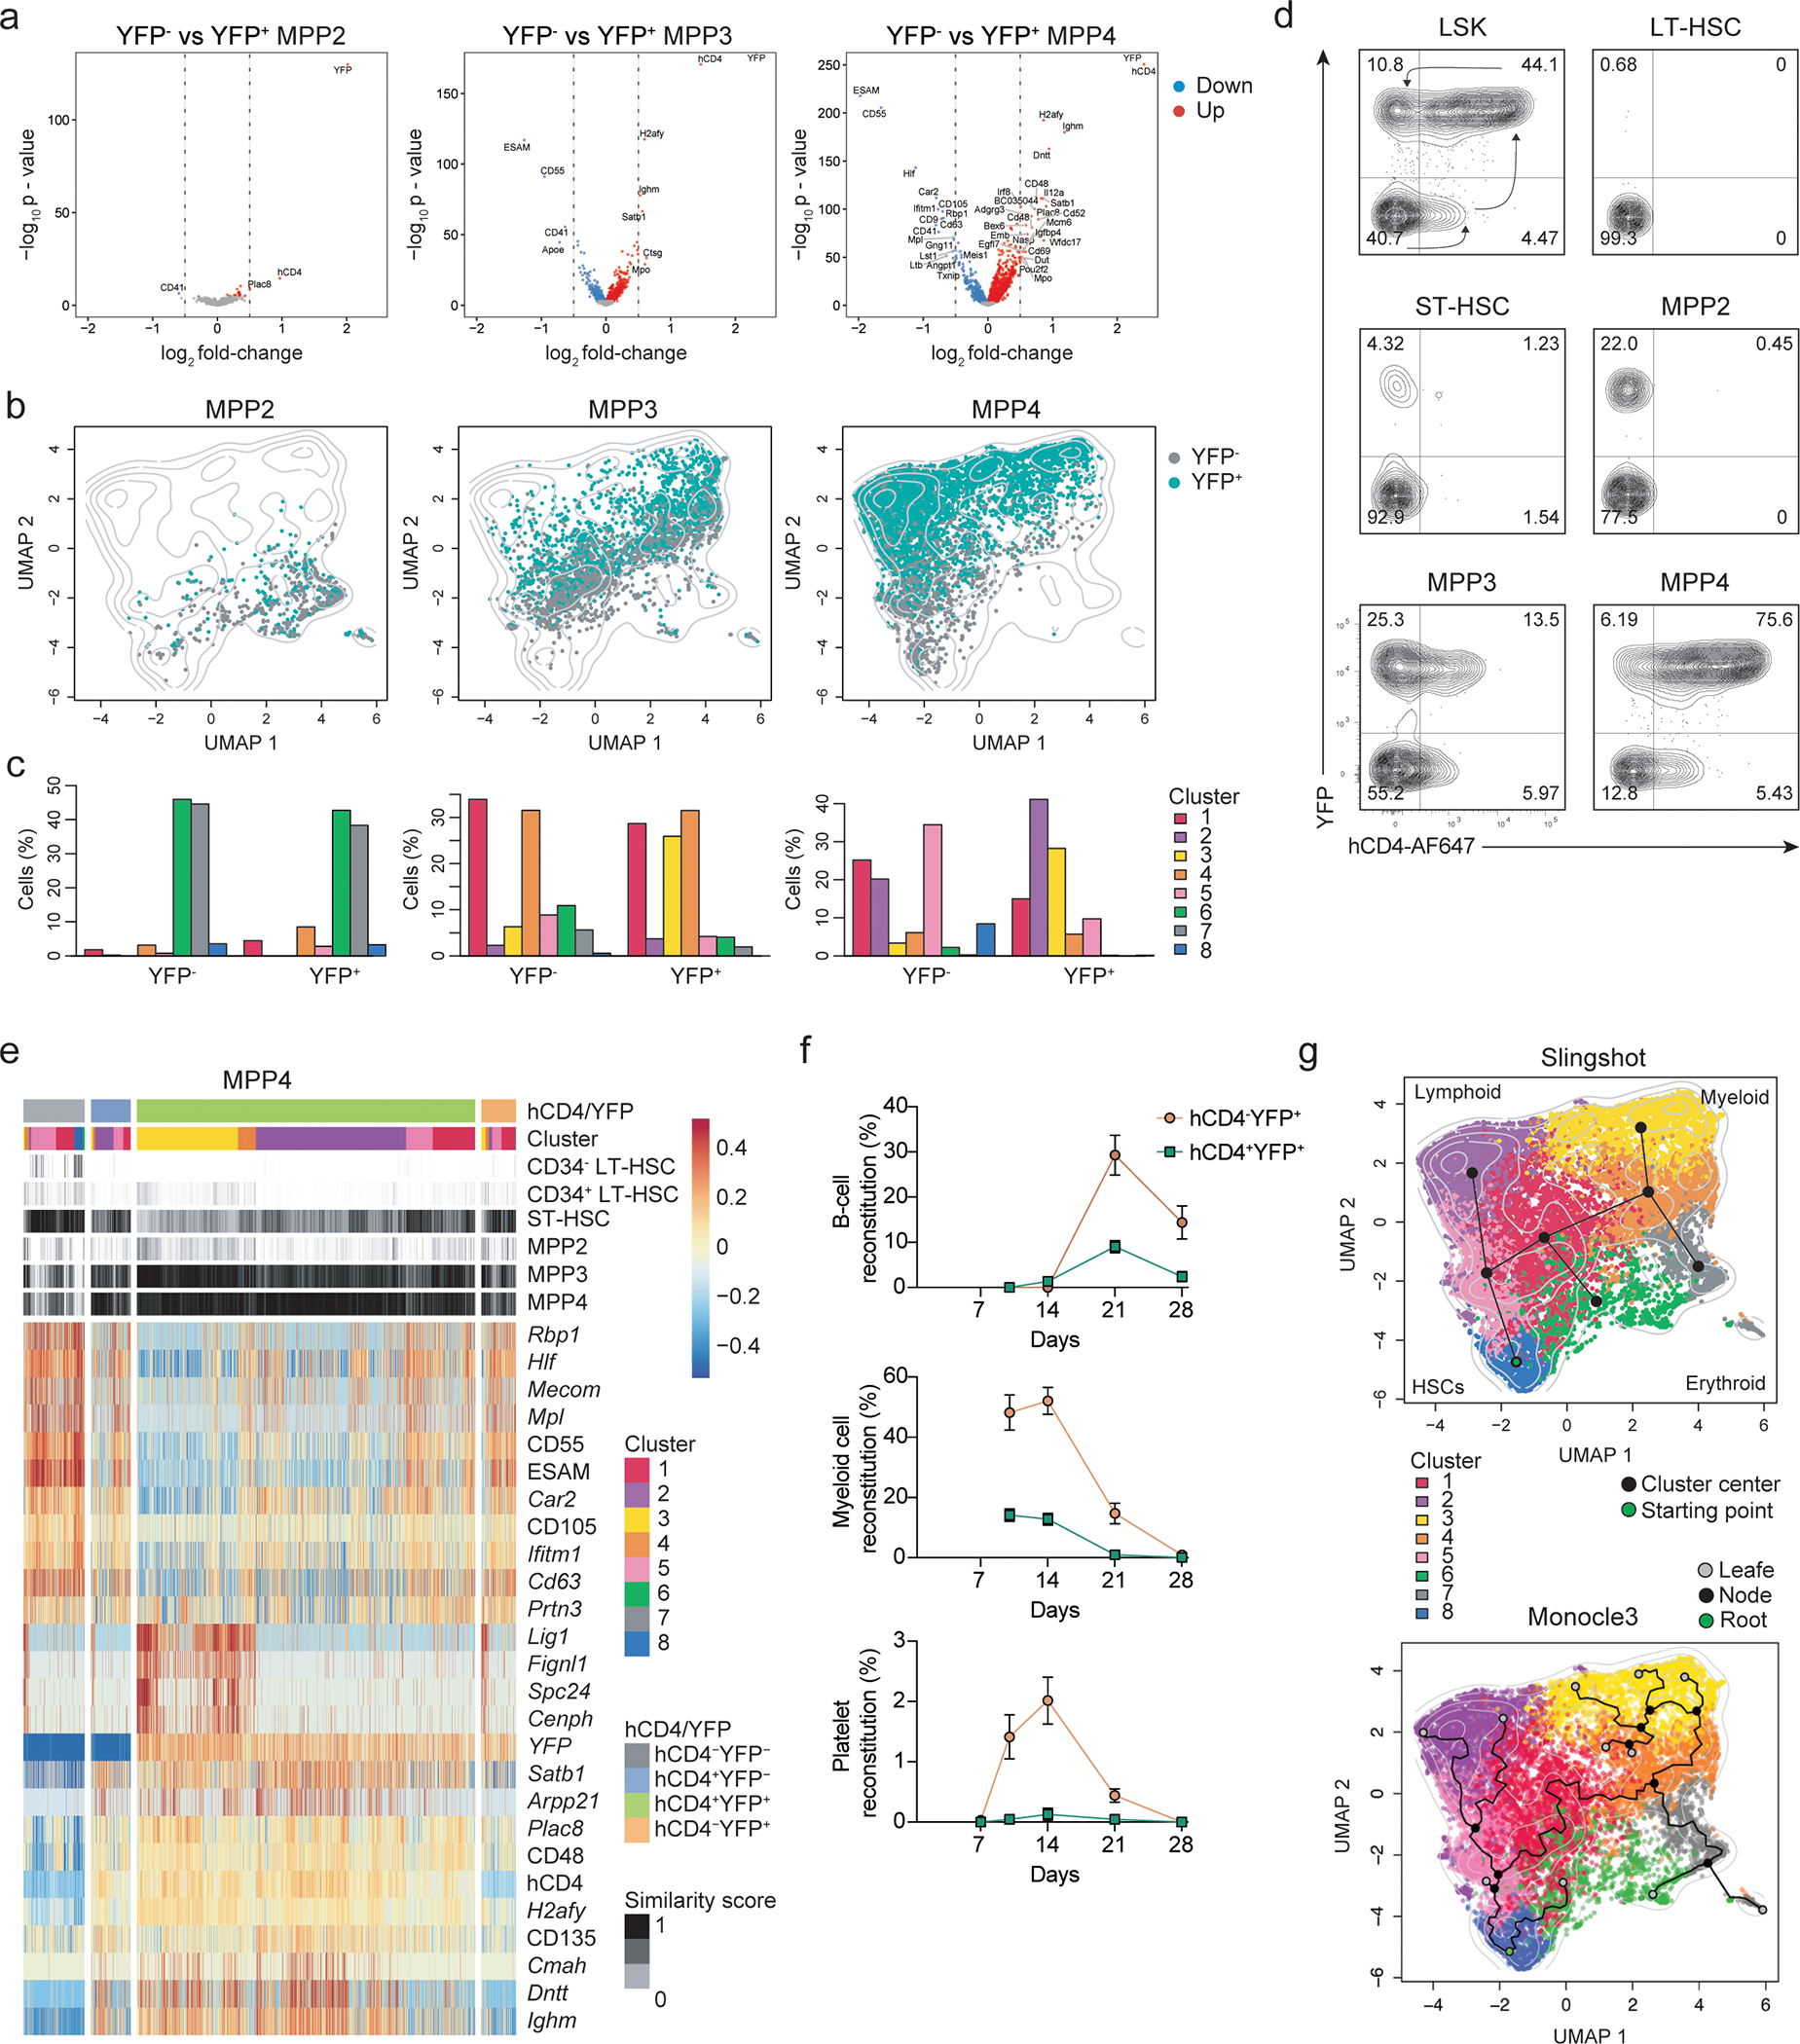
(a-c) MPP2s, MPP3s and MPP4s defined using the “a posteriori” gating strategy (Extended Data 4f) were subdivided based on YFP expression and (a) analyzed for differential gene expression. Shown are volcano plots as indicated for YFP−/+ MPP2s, YFP−/+ MPP3s and YFP−/+ MPP4s. Genes downregulated in the YFP+ fractions with an FDR<0.01 are marked in blue and genes upregulated in the YFP+ fractions are marked in red. Genes with an abs log2 fold change (FC)>0.5 are labeled. (b) Distribution of YFP−/+ MPP2s, MPP3s, and MPP4s in (b) UMAP plots displayed as YFP− (grey) or YFP+ (turquoise) within the contour lines of the UMAP density obtained in (Fig. 4a). (c) Bar graphs showing the percent distribution across the transcriptionally defined clusters as shown in Fig. 4a of YFP−/+ MPP2s, MPP3s, and MPP4s the distribution of cells within each cluster defined as in Fig. 4a for YFP−/+ MPP2s, MPP3s, and MPP4s, as indicated.
(d) Representative FACS plots showing the expression of hCD4 and YFP within the BM LSK compartment of TdThCD4/YFP mice. The gating strategy to identify the corresponding populations is shown in Fig. 2c.
(e) Compiled data showing hierarchical distribution of hCD4−YFP−, hCD4+YFP−, hCD4+YFP+, and hCD4−YFP+ MPP4s, annotated based on the “a posteriori” gating as in described in Extended Data 4f. The data is displayed in relation to their cluster distribution defined as in Fig. 4a; the similarity score to reference samples from the ImmGen dataset defined as in Fig. 4c; The expression of CITE-Seq markers, YFP transcript and hCD4 is centered and scaled, shown are the top 26 markers differentially expressed between subsets.
(f) 1000 hCD4+YFP+ or hCD4−YFP+ MPP4s were transferred into sub-lethally irradiated recipient animals. Shown are percent reconstitutions in peripheral blood of CD19+CD11b− B cells, CD11b+CD3−NK1.1− myeloid cells, and platelets (FSClow, Ter119−, CD41+, CD61+) at the indicated timepoints. Data were collected from 2 independent experiments (hCD4−YFP+ MPP4 n=6; hCD4+YFP+ MPP4 n=7). Error bars indicate s.e.m.
(g) UMAP plots displaying the differentiation trajectories for the 8 clusters defined as in Fig. 4a inferred by Slingshot or Monocle 3.
Within MPP4s 3,596 DEGs characterized the YFP− and YFP+ fractions (Fig. 5a–c). YFP+MPP4s expressed genes linked to lymphoid-lineage specification and loss of stemness (CD48/Cd48, Mpo, Irf8, Ighm and Dntt), defined by clusters 2 and 3 (Fig. 5a–c). Consistent with the lack of erythroid potential, YFP+MPP4s had no cells from clusters 6 and 7 (Fig. 5c). YFP− MPP4s mostly contained clusters 1, 2 and 5, and a small fraction of cluster 8 (Fig. 5b,c). These results indicated that YFP− MPP4s were the most undifferentiated MPP subset and were transcriptionally characterized by a multilineage potential.
Lineage gene induction is uncoupled from lineage restriction
Since we had generated the heterozygous TdThCD4/YFP mice for the sequencing experiment and given that YFP expression was independent of lymphoid specification, we could computationally and functionally re-analyze all MPP subsets presuming the timeline of Dntt expression as hCD4−YFP−/hCD4+YFP−/hCD4+YFP+/hCD4−YFP+. LT-HSCs were all hCD4−YFP− (Fig. 5d). 4% of ST-HSCs and 22% of MPP2s were hCD4−YFP+ (Fig. 2f,5d), validating the hypothesis that these cells originated from progenitors not included within these gates. MPP3s and MPP4s could be separated into four subsets based on hCD4 and YFP expression (Fig. 5d). We next assessed their cluster distribution, UMAP localization, and in vivo reconstitution potential. All fractions included within the MPP3 compartment contained a variable distribution of clusters 1, 3 and 4, displaying myeloid/lymphoid and HSCs related transcripts (Extended Data 6b–d). YFP−MPP3 correlated with higher similarity scores to HSCs, while YFP+MPP3 had higher similarity scores to the ImmGen-based MPP3/MPP4 subsets (Extended Data 6b) In transplantation experiments, hCD4−YFP− MPP3s were the most immature, while hCD4−YFP+ MPP3s represented the most advanced population, with the lowest reconstitution capacity (Extended Data 6e). Since MPP3 were devoid of B cell potential (Extended Data 6e), we could assume that B cell precursors where only contained within the lymphoid cluster 2, or the HSC-related clusters 5 and 8.
hCD4−YFP− MPP4s contained the uncommitted and HSC-related clusters 1, 5 and 8 (Fig. 5e; Extended Data 6f,g). Transition to hCD4+YFP− MPP4 associated with an increased proportion of lymphoid cluster 2, while hCD4+YFP+ MPP4s gained cluster 3 (Extended Data 6f,g), suggesting the initial induction of the lymphoid program and validating their ability to generate both myeloid and lymphoid progeny, respectively (Extended Data 6h). Downregulation of TdT in hCD4−YFP+ MPP4s was characterized by a re-distribution of clusters 1, 2, 3 and 5 frequencies and loss of HSC-related cluster 8 (Fig. 5e, Extended Data 6f,g). Based on the transplantation results obtained that show a robust and multi-lineage reconstitution for hCD4−YFP+ (Fig. 5f; Extended Data 6h), we can hypothesize that MPP4s that remained hCD4+YFP+ presumably continued their commitment to the lymphoid lineage (cluster 2), while transition to the hCD4−YFP+ stage reflected reversion to a more multipotent stage (clusters 1 and 5). hCD4−YFP+ MPP4s represented only a minor fraction (6%) within the YFP+ MPP4s (Fig. 5d), possibly explaining why erythro-megakaryocyte potential was not detected in GFP+ MPP4s from the TdTmTmG mice.
Computational analysis using the Slingshot algorithm and Monocle 336, specifying cluster 8 as the starting point, inferred developmental progression from cluster 8 to cluster 5, followed by divergence into the different lineages (Fig. 5g). This analysis also inferred parallel YFP+ and YFP− pathways for the development of myeloid and erythroid subsets (Fig. 5g), independent from TdT expression. Collectively, we showed that induction of lymphoid transcripts such as Dntt did not translate into lineage commitment, but rather highlighted a dynamic range of expression of lineage specific transcripts within progenitors. Based on the genetics of the line, the transcriptional profiles and the multi-lineage potential, we can hypothesize developmental progression from LT-HSC to ST-HSC to hCD4−YFP− MPP4. Following hCD4 induction (hCD4+YFP+ MPP4s), reversion to the hCD4−YFP+ MPP4 that reflects downregulation of lineage specific genes, re-opens multipotential developmental options.
ESAM+ MPP4s are the only bona fide MPPs
Among the most DEG between YFP− and YFP+ MPP4 we identified ESAM (Fig. 5a), that was previously shown to label all LT-HSCs and part of the MPP compartment (Fig. 6a, Extended Data 7a)13, 14, 15, 20, 37, 38. In the context of UMAP projection, ESAM+ MPPs partially overlapped with YFP− MPPs from TdThCD4/YFP mice (Fig. 6b; Extended Data 7b,c). The enrichment in ESAM+MPP4s for HSC transcripts and clusters 5 and 8 (Fig. 6c; Extended Data 7b) prompted us to test their in vivo and in vitro reconstitution potential. ESAM+ and ESAM− MPP2, MPP3, and MPP4 were transferred into sub-lethally irradiated congenic CD45.1 mice. For all subsets downregulation of ESAM resulted in lineage restriction: ESAM− compared to ESAM+ MPP2s had no myeloid potential; ESAM− compared to ESAM+ MPP3s and MPP4s had no platelet potential (Fig. 6d). Only ESAM+ MPP4s reconstituted all lineages and all MPPs (Fig. 6d,e; Extended Data 7d; and data not shown), indicating that ESAM+MPP4s were the only multipotent progenitors (MPPs).
Fig. 6. ESAM expression defines developmental hierarchy in MPPs.
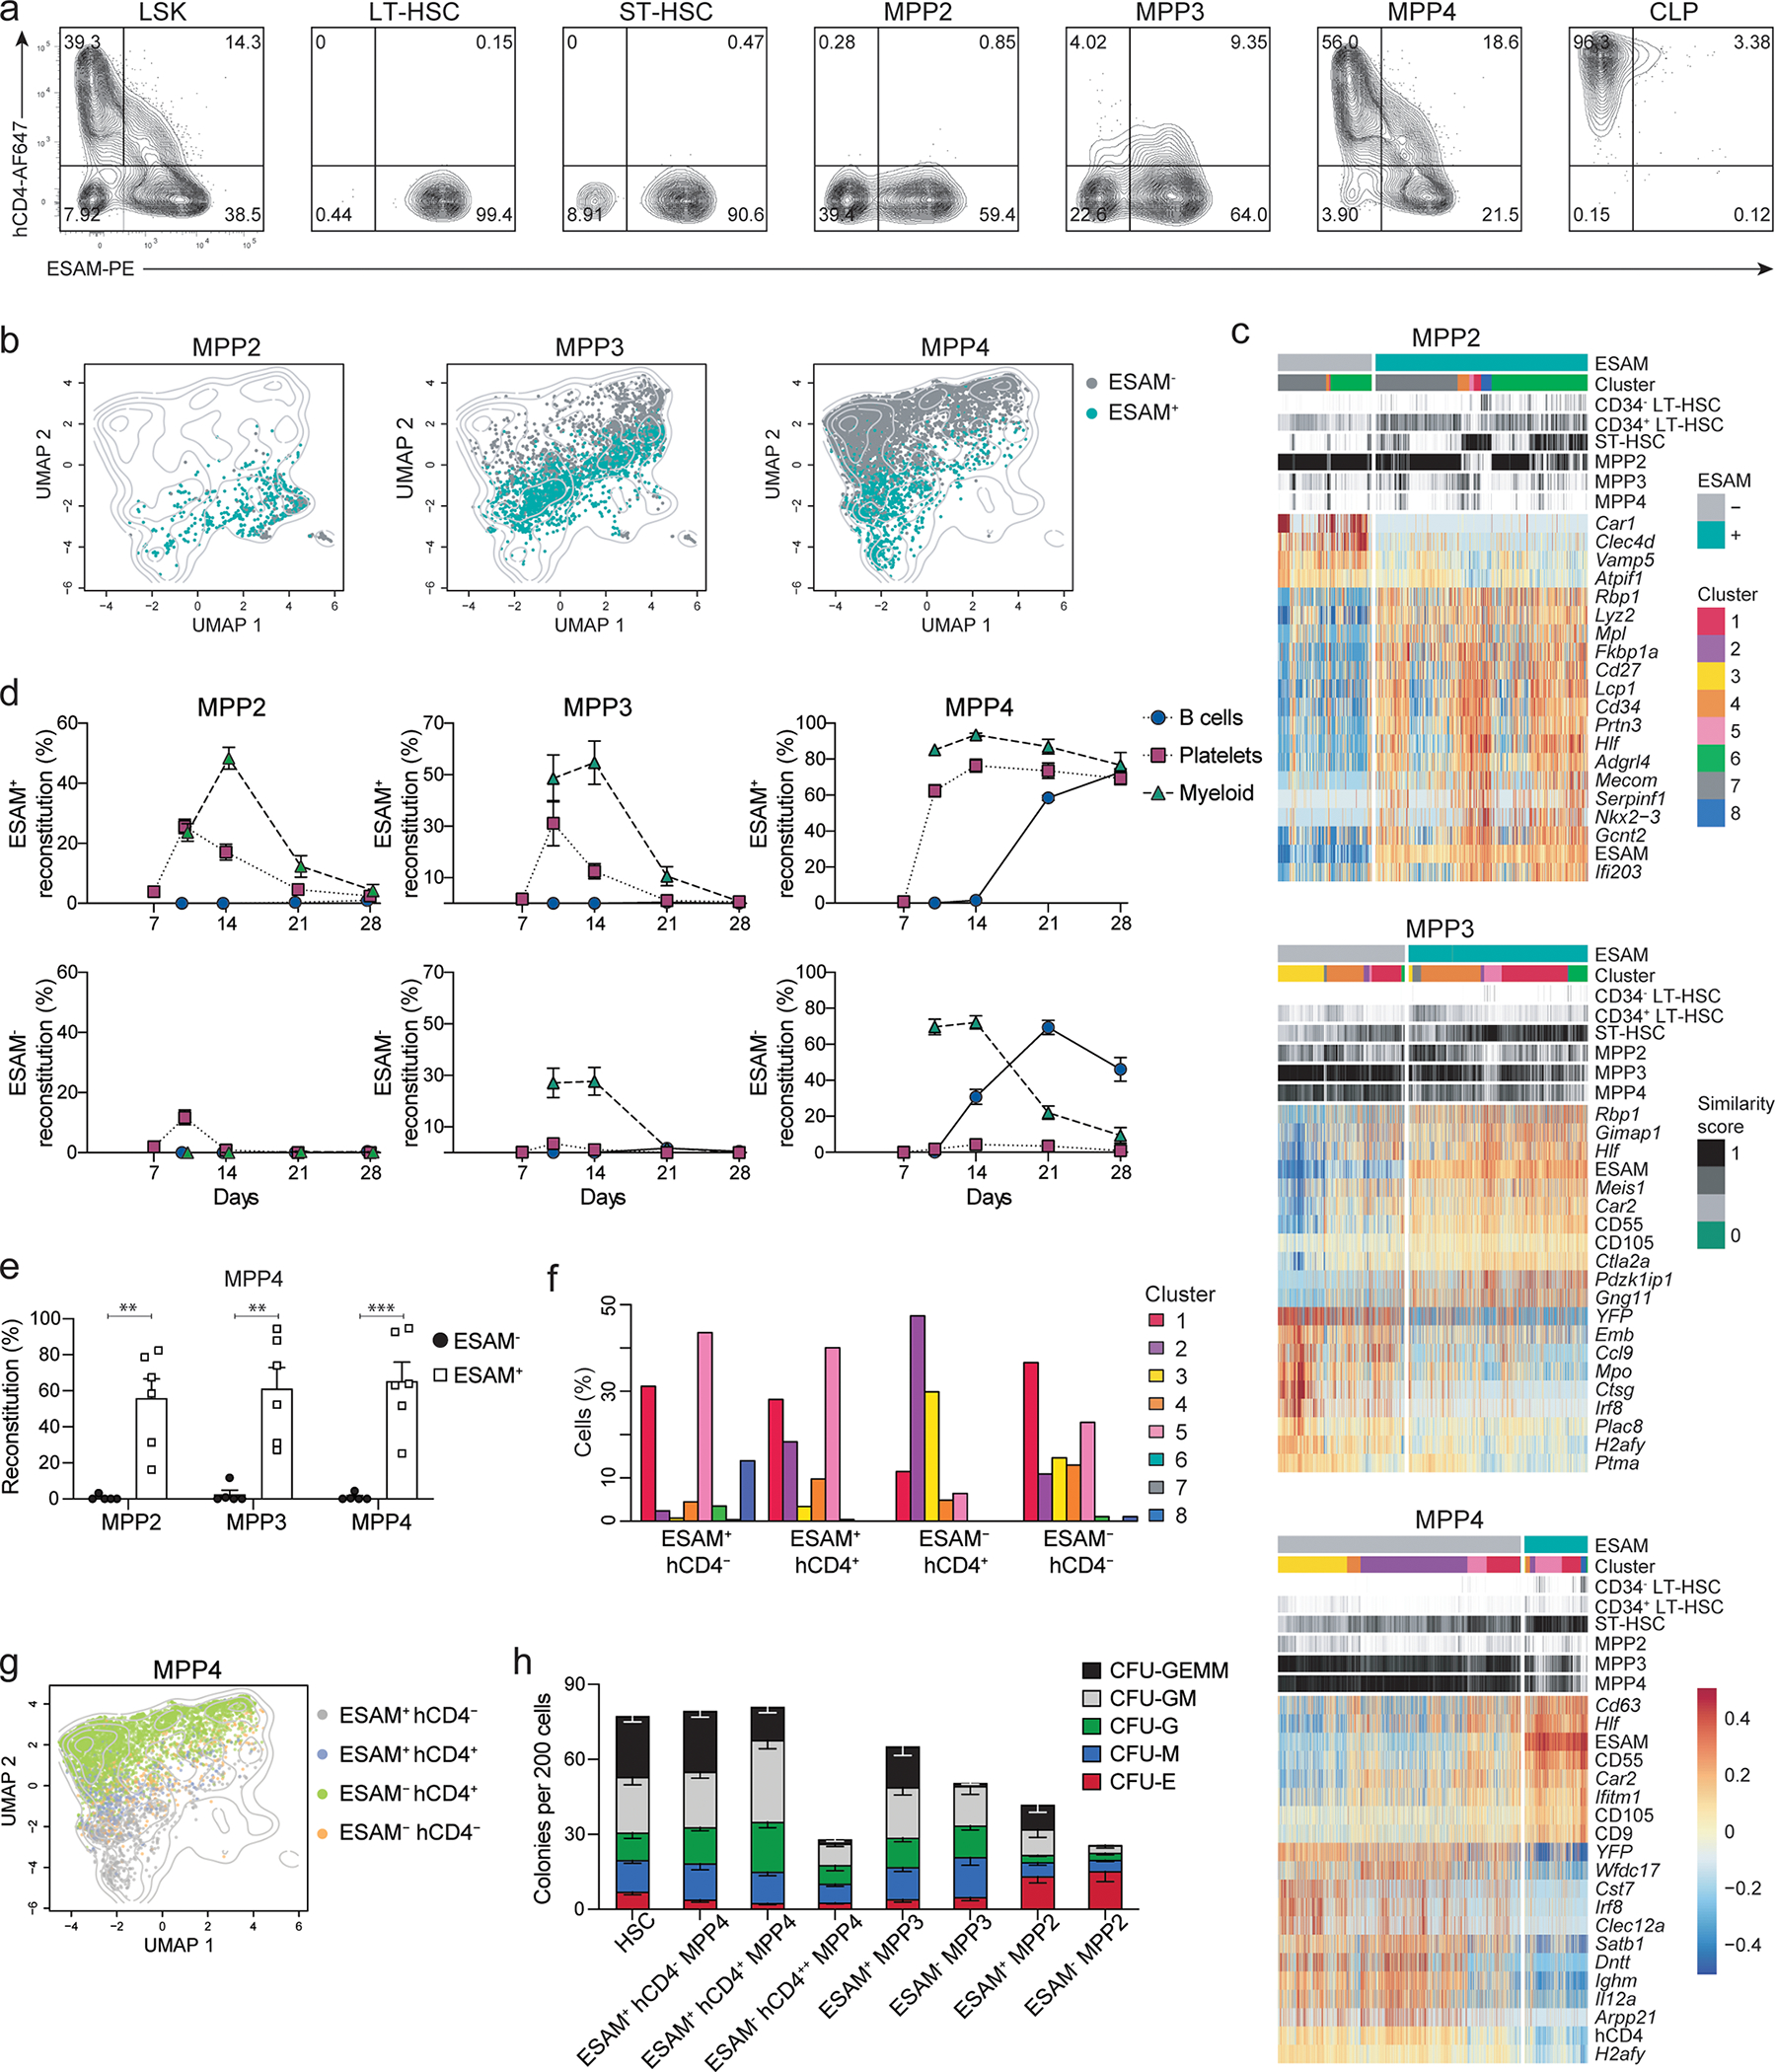
(a) Two color histograms depicting the expression of hCD4 and ESAM on BM progenitors isolated from 6–8 weeks old TdThCD4/YFP mice pre-gated as shown in Fig. 2c.
(b) UMAP plots illustrating the distribution of ESAM−/+ MPP2s, MPP3s, and MPP4s. The colors represent the classification as ESAM− (grey) or ESAM+ (turquoise).
(c) Compiled data showing ESAM−/+ MPP2s, MPP3s, and MPP4s, annotated as shown in Fig. 4b and Extended Data 4f in relation to their cluster distribution defined as in Fig. 4a, and to the ImmGen similarity score as defined as in 4c; Heatmap for the expression of markers is centered and scaled for the top 20 differentially expressed genes between subsets.
(d-e) 4000 ESAM−/+ MPP2s, MPP3s and MPP4s were isolated from the BM of 6–8 weeks old Rosa26mTmG mice and transferred i.v. into sub-lethally irradiated WT recipients. Shown is percent reconstitution of the mature subsets in peripheral blood (d) or MPP subsets in the BM gated as CD19+CD11b− B cell; CD11b+CD3−NK1.1− myeloid cell; and FSClowTer119−CD41+CD61+ platelets; MPP subsets as shown in Fig. 2c at the indicated time points. Shown are cumulative data from 3 (d) or 2 (e) independent experiments ((d) n=3–7; (e) n=3). Error bars indicate s.e.m. A multiple two-tailed unpaired Student`s t test was performed (MPP2 P=0.0013, MPP3 P=0.0016, MPP4 P=0.0004). **, P < 0.01; ***, P < 0.001.
(f) Percent cluster distribution for ESAM+hCD4−, ESAM+hCD4+, ESAM−hCD4+, and ESAM−hCD4− MPP4s, annotated as shown in Fig. 4b and Extended Data 4f.
(g) UMAP plot illustrating the distribution of ESAM+hCD4− (gray), ESAM+hCD4+(blue), ESAM−hCD4+(green), and ESAM−hCD4− (orange) MPP4 subsets, as indicated.
(h) 200 HSCs (ESAM+CD48− LSK), and 200 MPPs pre-gated as shown in Fig. 2c and further subdivided based on ESAM and hCD4 expression as indicated were sorted from the BM of 6–8 weeks old TdThCD4 mice and analyzed for multilineage colony forming potential. Shown are bar graphs enumerating the obtained CFUs. Shown are cumulative data from 3 independent experiments. Error bars indicate s.e.m.
Since ESAM expression was linked to multipotential and hCD4 and YFP expression allowed us to follow to the up and downregulation regulation of lineage specific genes in TdThCD4/YFP mice, we analyzed the expression of these markers across HSCs and MPPs by flowcytometry, within the UMAP projections, and looked at cluster distributions (Fig. 6a,b,f,g; Extended Data 7a,b,e,f,g). ESAM− ST-HSC, that correspond to YFP+ST-HSC clustered away from LT-HSCs in a t-SNE distribution plot (Extended Data 7a,f), corroborating that they may not represent true stem cells. Expression of hCD4 is high on ESAM− MPP4, while ESAMhigh MPP4s are hCD4−, indicating that lymphoid commitment was characterized by progressive stabilization and upregulation of the lineage-specific transcript Dntt (Fig. 6a,g; Extended Data 7e,g). Parallel to increased hCD4 induction was the progressive loss of erythroid potential, the reduced frequency of myeloid precursors and myeloid in vivo reconstitution, while we observed increased early B cell potential (Extended Data 7h–k).
Transcriptionally, ESAM+hCD4− MPP4s identified almost exclusively with the uncommitted clusters 1, 5 and 8 (Fig. 6f,g; Extended Data 7e), suggesting a profound overlap with HSCs. To define their potential at a clonal level we sorted HSC and MPPs based on ESAM expression and performed colony-forming units (CFU) assays. Multilineage CFU-GEMM (granulocyte-erythrocyte-macrophage-megakaryocyte) colonies were exclusive of the ESAM+ MPP fractions (Fig. 6h) further corroborating that downregulation of ESAM mirrors lineage restriction. Based on these findings we introduced a new gating strategy that considers the expression of ESAM for WT mice and hCD4 on TdThCD4 mice for the gating of HSCs and MPPs (Extended data 8a–c).
Irradiation pauses the lymphoid transcriptional program
To define the changes that occur during emergency haematopoiesis, we monitored reconstitution in TdTYFP mice after sub-lethal irradiation, which favors myelopoiesis. It required about 4 weeks to re-establish the steady-state frequency of YFP+MPPs and YFP expressing mature subsets (Fig. 7a,b). Erythro- and myelopoiesis had a transient shut down of the developmental pathway that goes via YFP+MPPs, suggesting that there is an overall downmodulation of transcripts related to lymphoid specification and of lymphopoiesis. Lymphoid development remained YFP+ (Fig. 7a) but was compromised beyond week 4 (Fig. 7b). These observations suggest that the increased erythroid and myeloid cell production after irradiation most likely occurred through the induction of environmental changes that affected early precursors and forced lineage specifications upon demand. We collectively propose a new hierarchy of early hematopoiesis at steady state and following perturbation (Extended data 8d,e)
Fig. 7. Irradiation pauses the lymphoid program in MPPs.
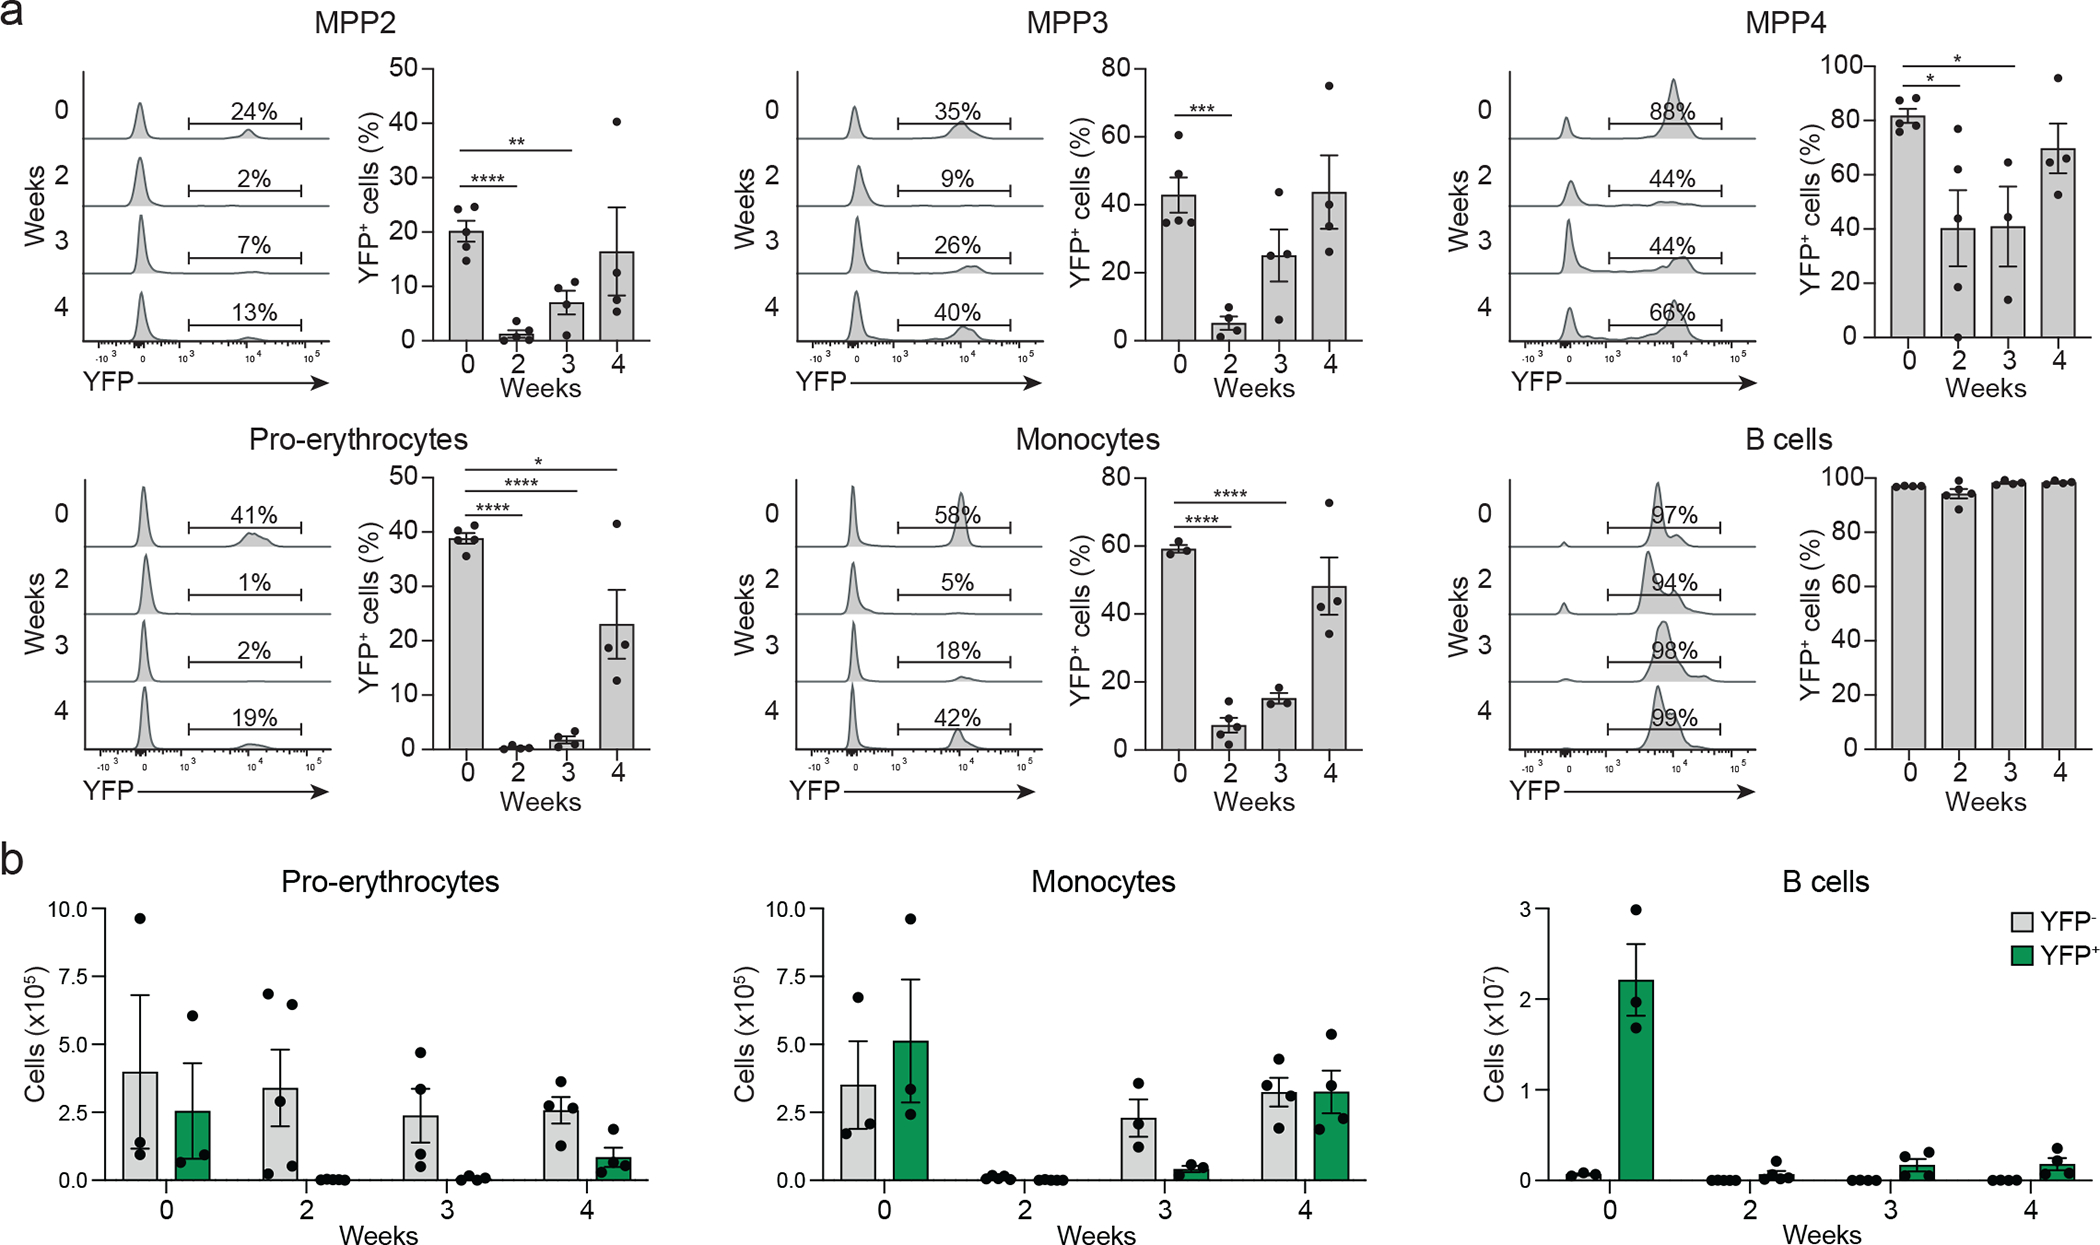
(a, b) 6–8 weeks old TdTYFP mice were left untreated or sub-lethally irradiated (600 rad) to induce emergency hematopoiesis. Mice were analyzed for the frequency of YFP−/+ MPPs (top row) gated as in shown in Fig. 2c, and pro-erythrocytes (middle row left) found in BM and for the frequency of YFP−/+ monocytes and B cells found in spleen (middle row center and right) at the indicated timepoints. Shown are percent (a) and absolute numbers (b) of YFP negative and positive cells for the indicated subsets. Shown are representative histograms and cumulative data from 2 independent experiments (n=3–5). Statistical analysis was done with two-tailed unpaired Student`s t test (MPP2: weeks 0 and 3 P=0.0028; MPP3: weeks 0 and 3 P=0.0005; MPP4: weeks 0 and 2 P=0.019, weeks 0 and 3 P=0.011; pro-erythrocytes: weeks 0 and 4 P=0.027). *, P < 0.05; **, P < 0.01; ***, P < 0.001; ****, P < 0.0001. Error bars indicate s.e.m.
Discussion
Through the generation of two new mouse lines reporting and tracing the expression of the lymphoid specific gene Dntt, here we tracked key steps during early hematopoiesis beyond lymphopoiesis and identified a new MPP progenitor with an MPP4 profile and capable of multilineage reconstitution. Further, single cell CITE-Seq of the LSK compartment in the dual reporter and lineage-tracer mice revealed ESAM expression as the key marker for multipotency within ST-HSCs and MPP4 and for oligopotency in MPP2s and MPP3s.
Fate mapping, transposon and Cre-loxP mediated barcoding-systems studies have collectively contributed to our current understanding of early hematopoietic development. Clonal transposon tagging experiments revealed that, apart from HSCs, multilineage potential was primarily found in a fraction of MPP4s that could not be specifically identified16. It was reported that MPP2 are capable of multipotent reconsitution12. While different multipotent precursors have been proposed, there is general consensus that only a small fraction of HSCs generates most of the hematopoietic progeny39, 40. In line with this view, we showed that only a minor fraction of HSCs was cycling, and was therefore the likely source of most mature cells, potetially aligning with the recently described CD34+CD135−CD48−CD150− MPP541.
Our main goal was to pinpoint progenitors at the bifurcation of lymphoid versus myeloid-erythroid lineage, which represents a major branchpoint during hematopoietic development16, 42. In mice tracing the expression of Dntt, YFP labelled across all hematopoietic lineages, including the erythro-megakaryocyte and myeloid branch. We could exclude leakage based on the genetic construct of the line. A detailed computational and functional analysis of hCD4 and YFP expressing MPP2, MPP3 and MPP4 allowed us to trace the earliest multipotent progenitors within the MPP4 compartment and show that expression of lineage specific genes is uncoupled from commitment. These findings reconcile with the idea that all hematopoietic cells are labelled in FLT3-Cre crossed to Rosa26-YFP transgenic line 43, 44. Transient induction of TdT led to the labelling of a small fraction of hCD4−YFP+MPP4 that had multilineage potential, but were outcompeted by HSC in in vivo reconstitution experiments, suggesting that they are developmentally downstream the HSC compartment. The progeny derived from YFP+MPP4 accounted for about 20–30% of the erythro-megakaryocyte lineage and about 60–80% of the myeloid lineage. Neither MPP2s nor MPP3s mediated B cell engraftment when an IL-7R exclusion gate was introduced. YFP labeling in 60% of myeloid cells and 30% of erythro-megakaryocyte progeny suggested that one developmental pathway was marked by transient induction of lymphoid-associated transcripts, while the other one was independent. It is there possible to envision at least three developmental scenarios that would explain transient expression of lineage-specific genes in non-committed progenitors: in the first, the genomic landscape is plastic, and multipotency is maintained while lineage-specific genes such as Dntt can be turned on and off; in the second, there is simultaneous expression of lineage-specific genes that do not reach the necessary threshold of lineage regulators to ensure specification; or lineage branching is set in place, but the presence or lack of specific internal or external cues may re-direct cells to alternative fates. TdT was reported on immature leukemic blasts with both lymphoid as well as myeloid features, suggesting that also in humans TdT can be expressed in uncommitted precursor and that transient induction of lineage genes can occur independently of lineage specification 45, 46, 47. Transient or low expression of TdT does reflect a permissive transcriptional state, in which exposure to cytokines (IL-7 for lymphoid, CSF-1 for myeloid and/or EPO for erythroid) or expression of selected transcription factors may influence commitment. The concept of lineage-defined niches is well known, and proliferation as well as migration will dictate which niche is likely to influence the fate of a given precursor. Gradients of cytokines and chemokines may intertwine, leading to the observed expression of lineage specific transcripts in still uncommitted progenitors. It is possible that both intrinsic and extrinsic aspects are influencing HSCs, such as chromatin accessibility, receptor expression, as well as the cytokine or niche availability. The identification of ESAM as an ideal marker for multipotency and the observation that its downregulation is linked to lineage restriction may suggest that gene accessibility and chromatin landscape will mirror its expression. Collectively, we here redefine the hierarchy of early hematopoietic progenitors, validating experimentally and transcriptionally key stages that associate with multipotency and progressive lineage restriction across all three lineages.
Methods
Mice
C57BL/6 wild-type (CD45.1, CD45.1/2 and CD45.2), TdThCD4, TdTiCre, Rosa26LSL-YFP and Rosa26mTmG mice48,49 were bred and maintained in our animal facility under specific pathogen free conditions according to institutional guidelines (Veterinäramt BS, license number 2786_26606 and ASP Number: 19–896). All mice used as donors in transplantations and for analysis were 6–10 and recipient mice were 8–15 weeks old, and all were of the C57BL/6 strain.
TdThCD4 and TdTiCre mice were generated at the Center for Transgenic Models in Basel using Cas9/CRISPR technology. All Cas9 reagents were purchased from IDT. Briefly, RNPs consisting of Cas9 protein (40 ng/μl), trcrRNA (20 ng/μl) and crRNAs (10 ng/μl each) targeting the last exon of the Dntt gene just before the stop codon, together with a single stranded DNA template (IDT) encoding the P2A self-cleaving peptide 50 in front of the human CD4 or iCre coding sequence flanked by 200 base pair long homology arms, were microinjected into C57BL/6 zygotes essentially as described in 51. Embryos that survived the DNA and Cas9 RNP microinjections were transferred into pseudo-pregnant females generated by mating with genetically vasectomized males 52 and the offspring were allowed to develop to term. Extended Data 1a illustrates the strategy used to generate the TdThCD4 and TdTiCre mice by Cas9 mediated homology directed repair. Genotyping was performed by PCR using different sets of primers. To detect hCD4 and iCre integration forward and reverse primers were located within the transgenes: PCR1: hCD4 FW1 + hCD4 RV1 (200bp product); iCre FW1 + iCre RV1 (258bp product) (Supplementary Table 1). To distinguish between homozygous and heterozygous mice a forward primer located in the Dntt gene right before the transgenes and a reverse primer located in the untranslated region of the Dntt gene right after the transgenes were used: PCR2: Dntt FW1 + Dntt RV1 (291bp product) (see Table 1). In mice heterozygous for hCD4 or iCre insertion both PCRs are positive, while for homozygous animals PCR2 is negative (product too large for amplification). Furthermore, combinations of the primers allowed to confirm transgene integration at the designated site: PCR3+4: hCD4 FW1 or iCre FW1 + Dntt RV1; Dntt FW1 + hCD4 RV1 or iCre RV1. PCRs were performed with GoTaq Green Master Mix (Promega) according to the manufacturer`s instructions.
Cell harvest and flow cytometry
For analysis and sorting, bone marrow cells were flushed or extracted through fragmentated with a mortar and pestle from femurs and/or tibiae and/or pelvic bones of the two hind legs of mice with FACS buffer (PBS containing 0.5% BSA and 5 mM EDTA) and single-cell suspensions of spleen and thymus cells were made. Debris was removed by filtration through a 70 μm strainer. Red blood cells were lysed with ACK lysis buffer. Cells were counted and stained in FACS buffer with antibodies of interest (Table 1) for 30 min at 4°C. Cells were additionally stained with propidium iodide or 7AAD to exclude dead cells. For blood cell analysis 5 μL of blood were used for platelet and 50 μL for B cell and myeloid cell staining. After 30 min at room temperature 2 mL of FACS buffer were added to the platelet staining, which were then readily analyzed. To lyse red blood cells 2 mL of FACS lysing solution (BD Biosciences) were added to the B cell and myeloid cell staining before analysis. For intra-cellular staining, cells were fixed and permeabilized after cell-surface staining using a Fix/Perm buffer set (Invitrogen) according to the manufacturers protocol. Enrichment of progenitor cell populations prior to sorting was performed by Magnetic-Activated Cell Sorting (Milteny Biotec) using biotin labeled antibodies directed against lineage markers (CD3, CD19, B220, Ter119, NK1.1, and Ly6G) and anti-biotin MicroBeads (Milteny Biotec) according to the manufacturers protocol. For cell sorting, a BD FACSAria IIu instrument (BD Biosciences) with a custom built-in violet laser was used. Cells were sorted into Iscove’s modified Dulbecco’s medium (IMDM) supplemented with 5% fetal bovine serum, 5 × 10⁻⁵ M β-mercaptoethanol, 1mM glutamine, 0.03% (wt/vol) Primatone, 100 units/mL penicillin, and 100 μg/mL streptomycin. Cell purities of at least 95% were confirmed by post-sort analysis. Cells were analyzed on a BD LSR Fortessa instrument (BD Biosciences), and data were analyzed with FlowJo X software (TreeStar).
B- and T-cell progenitor populations were gated as previously described 27, 53 (Fig. 1a,d,e; Extended Data 1e). For the identification of the hematopoietic stem cell and multipotent progenitor compartment BM cells were gated as lineage negative (CD3, CD19, B220, CD11b, CD11c, GR-1, Ter119, and NK1.1), Sca-1+ and cKithigh (LSK compartment). LSK cells were further separated into FLT3−CD48−CD150+ LT-HSC, FLT3−CD48−CD150− ST-HSC, FLT3−CD48+CD150+ MPP2, FLT3−CD48+CD150− MPP3, and FLT3+ MPP4 (Fig. 2c)15. GMP, CFU-E and MkP progenitor populations were identified as lineage negative (see LSK compartment) and cKit+Sca-1−CD127−. GMPs were further gated as CD41−CD16/32highCD150−, CFU-E as CD41−CD16/32lowCD150−CD105+ and MkP as CD41+ (Extended Data 2f) 54. MDP, CDP and cMoP progenitor populations were identified by excluding cells stained positive for the following lineage markers: CD3, CD19, B220, Ter119, and NK1.1. MDPs and CDPs were further defined as Ly6C−FLT3+CD115+ and distinguished as cKithigh and cKitlow/int, respectively, while cMoPs were defined as cKithighLy6C+CD115+ (Extended Data 2g). Mature cell populations were defined as the following: B cells (CD3−CD19+), NK cells, (CD3−CD19−NK1.1+), CD4 T cells (CD3+CD4+CD8−), CD8 T cells (CD3+CD4−CD8+), γδ T cells (CD3+CD4−CD8−TCRγδ+), pro-erythrocytes (CD3−CD19−Ter119+CD71highCD105+), platelets (FSClowTer119−CD41+CD61+), pDCs (CD3−CD19−CX3CR1−Siglec-H+ and/or Bst2+), cDCs (CD3−CD19−CD11chighMHCIIhigh, if indicated cDCs were split into XCR1+ cDC1 and Sirpα+ or CD11b+ cDC2), monocytes (CD3−CD19−CD11b+Ly6Chigh), and granulocytes (CD3−CD19−CD11b+Ly6Clow) (Extended Data 2a–d).
Transplantations
For transplantation experiments recipient mice were either sub-lethally (600 rad) or lethally (900 rad) irradiated using a Cobalt source (Gammacell 40, Atomic Energy of Canada, Ltd) ~3 hours prior to transplantation. Indicated numbers of purified donor cells were injected intravenously. At indicated timepoints blood was collected from the tail vein (50–75 μL) and stained for platelet, myeloid cell and B-cell reconstitution. Recipient mice were euthanized at indicated timepoints after cell transfer and their spleen and bone marrow were analyzed for the presence of donor cells.
Limiting dilution assays
Limiting dilution assays were adapted from55. In brief, ST2 6 or OP9 56 stromal cells were plated at a concentration of 4000 cells per well in a 96-well flat-bottom plate one day prior to plating. One day later, the s.e.m.i-confluent stromal cells were γ-irradiated with 2000 rad using a Cobalt source (Gammacell 40, Atomic Energy of Canada, Ltd). Populations of interest were sorted and plated at different concentrations (3, 6, 12, 24, or 48 cells per well). Cultures were maintained in supplemented IMDM, for ST2 co-cultures, or Opti-MEM (Gibco) supplemented with 10% fetal bovine serum, 100 units/mL penicillin, 100 μg/mL streptomycin, 50 ng/mL murine IL-7 (PeproTech), 50 ng/mL human FLT3-ligand (produced in-house) and 25 ng/mL murine stem cell factor (produced in-house) for OP9 co-cultures, at 37°C in a humidified atmosphere containing 10% CO2 in the air. After 14 or 18 days in culture, for ST2 or OP9 co-cultures, respectively, wells were inspected under an inverted microscope, and wells containing colonies of more than 50 cells were scored as positive.
Methylcellulose cultures
For BFU-E methylcellulose assays, 500–2000 cells in 1 mL SF M3436 (StemCell Technologies) supplemented with 100 units/mL penicillin, 100 μg/mL streptomycin were cultured in a 3 cm petri dish. For simultaneous assessment of multilineage CFU-GEMM, CFU-GM, CFU-G, CFU-M and CFU-E colonies, 200 cells were cultured in 1 mL M3231 (StemCell Technologies) supplemented with 5% FBS, L-Glutamine (2 mM), 100 units/mL penicillin, 100 μg/mL streptomycin, and the following cytokines: SCF (25 ng/mL), FLT3-ligand (25 ng/mL), GM-CSF (10 ng/mL), EPO (25 ng/mL), TPO (25 ng/mL), IL-3 (10 ng/mL), and IL-11 (25 ng/mL). Colonies were counted after 10 days of culture under an inverted microscope. Colonies are defined as CFU-GEMM (colonies forming units containing granulocytes, macrophages and erythrocytes or megakaryocyte progenitors), CFU-GM (mixed granulocyte and macrophage colonies), CFU-G (granulocyte colonies), CFU-M (macrophage colonies), and CFU-E (erythroid colonies).
Quantitative RT-PCR
Total RNA was extracted using RNAqueous Micro Kit (Invitrogen) followed by cDNA synthesis using GoScript reverse transcription (Promega) according to the manufacturer’s protocols. Quantitative PCR was performed using SYBR green PCR Master Mix (Applied Biosystems), and samples were run on an Applied Biosystems StepOnePlus qPCR machine.
Cellular indexing of transcriptomes and epitopes by sequencing (CITE-Seq)
Bone marrow cells from four TdThCD4/YFP double reporter mice were isolated and enriched for progenitor cells by MACS by the usage of antibodies directed against CD3, CD19, B220, Ter119, and Ly6G. Subsequently cells were stained with antibodies directed against additional lineage markers (CD11b, CD11c, NK1.1, GR-1), Sca-1, and CD117 in order to identify LSK cells. In addition, cells were stained with antibodies coupled to oligonucleotides directed against hCD4, FLT3, CD48, CD150, CD9, CD41, CD55, CD105, CD115, CXCR4, and ESAM (Biolegend, see Table 1). LSK cells were sorted and an estimate of 4’000–6’000 cells per mouse were loaded on one well each of a single 10x Genomics Chromium Single Cell Controller. Single-cell capture and cDNA and library preparation were performed at the Genomics Facility Basel of the ETH Zurich, Basel, with a Single-Cell 3’ v3 Reagent Kit (10x Genomics) according to the manufacturer’s instructions with the changes as described in 30 to capture cDNA and produce libraries from antibody derived oligos (ADT). Sequencing was performed on 4 lanes (2 flow-cells) of an Illumina NovaSeq 6000 instrument, with a mix of 90% cDNA library and 10% ADT library for the 2 first lanes, and 95% cDNA library and 5% ADT library for the 2 last lanes, to produce 91nt-long R2 reads.
The dataset was analyzed by the Bioinformatics Core Facility, Department of Biomedicine, University of Basel. Read quality was controlled with the FastQC tool (version 0.11.5). Sequencing files of both cDNA and ADT libraries were jointly processed using the Cell Ranger Software (v3.1.0), and the “Feature Barcoding Analysis” instructions (https://support.10xgenomics.com/single-cell-geneexpression/software/pipelines/latest/using/feature-bc-analysis) were followed to perform quality control, sample demultiplexing, cell barcode processing, alignment of cDNA reads to the mm10 genome with STAR (version 2.6.1.a) 57 and counting of UMIs for cDNAs and CITE-Seq antibody barcodes. Default parameters were used for Cell Ranger, except for the STAR parameters outSAMmultNmax set to 1 and alignIntronMax set to 10000. The reference transcriptome refdata-cellranger-mm10–3.0.0 using Ensembl 93 gene models (https://support.10xgenomics.com/single-cell-gene-expression/software/downloads/latest) was used, and supplemented by the sequences of the YFP, human CD4 and iCre constructs from the TdThCD4/YFP double reporter mice.
Filtering for high-quality cells was done based on library size (at least 1,000 UMI counts per cell), the number of detected genes (at least 1,000 genes detected) and the percentage of reads mapping to mitochondrial genes (larger than 0% and lower than 7%), based on the distribution observed across cells. Low-abundance genes with average counts per cell lower than 0.015 were filtered out. After quality filtering, the resulting dataset consisted of UMI counts for 12,165 genes and 20,595 cells, ranging from 3,932 to 6,286 per sample.
Further analyses were performed using R (version 3.6), and Bioconductor (version 3.10) packages, notably dropletUtils (version 1.6.1) 58, scran (v1.14.6) 59 and scater (v1.14.6) 60, and the Seurat package (v4.0.5), 61 mostly following the steps of the workflow presented at https://osca.bioconductor.org/ (Amezquita et al., 2019). Clustering of cells was performed on normalized 59 and denoised log-count values with hierarchical clustering on the Euclidean distances between cells (with Ward’s criterion to minimize the total variance within each cluster 62; package cluster version 2.1.0). The number of clusters used for following analyses was identified by applying a dynamic tree cut (package dynamicTreeCut, version 1.63–1) 63, resulting in 12 clusters and an average silhouette width of 0.09. As complementary clustering approach we used the Seurat graph-based clustering, using the FindNeighbors() function on the 10 first principal components of the PCA results, and a k of 20, followed by calling the FindClusters() function with a resolution of 0.6 (Data not Shown).
Cell cycle phase was assigned to each cell using the cyclone function from the scran package and the available pre-trained set of marker pairs for mouse 64. The vast majority of the cells classified in G2M or S phase belonged to a subset of three clusters, so to best eliminate the effects of cell-cycle we filtered out cells from these clusters, and in the other clusters only retained the cells classified in G1 phase (Extended Data 4a,b,d). Cells from an additional cluster were filtered out because it was heterogenous and composed of cells with elevated percentage of reads mapping to mitochondrial genes (e.g., likely of lower quality; Extended Data 4c). The final filtered dataset was composed of 15,853 cells, ranging from 3,081 to 4,849 per sample. Re-clustering of these cells resulted in 8 clusters and an average silhouette width of 0.1. The findMarkers function of the scran package was used to find markers (genes, constructs or CITE-Seq antibodies) up-regulated in any of the clusters. The top 30 markers for each cluster were extracted and pooled to from a list of 104 markers (Fig. 4d). DEG are displayed in Table 2.
The Bioconductor package SingleR (version 1.0.5) was used for cell-type annotation of the cells 65 using as reference the relevant samples from the Immunological Genome Project (ImmGen) mouse RNA-seq dataset (LTHSC.34-.BM”, “LTHSC.34+.BM”, “STHSC.150-.BM”, “MPP2.150+48+.BM”, “MPP3.48+.BM” and “MPP4.135+.BM”) 32, 33, 66, 67, 68, 69 and the HSC, MPP1, MPP2, MPP3, and MPP4 bulk RNA-seq samples from Cabezas-Wallscheid et al. 12. For the visualization of SingleR scores across cells on heatmaps, the scores were scaled between 0 and 1 across populations for each cell and cubed to improve dynamic range next to 1 65. A posteriori gating of cells to the LT-HSC, ST-HSC, MPP2, MPP3 and MPP4 subpopulations was performed based on the surface protein signal from the CITE-Seq antibodies (except for FLT3/CD135 which displayed a continuous gradient, leading us to use also the Flt3 transcript expression level to recover gating results most similar to the FACS analyses as shown in Extended Data Fig. 4e,f. For classification of YFP+/−, hCD4+/− and ESAM+/− cells, a similar thresholding approach was used, and the findMarkers function of the scran package was used to find differentially expressed markers between positive and negative populations at a false discovery rate (FDR) of 1% (in both directions).
A uniform manifold approximation and projection (UMAP) dimensionality reduction was used for visualizing single cells on 2 dimensions 70, calculated using the runUMAP function from the scater package and default parameters (using the 10 components of the denoised principal component analysis as input, the 500 most variable genes, and a neighborhood size of 15). For visualization, the y-axis coordinates were adjusted which led to exclusion of 8 cells separating from the bulk of other cells on the second dimension. Contour lines displaying the 2D cell density on the UMAP space were calculated with the MASS package (version 7.3–51.5).
Trajectory analysis was performed with the Bioconductor package Slingshot (version 1.4.0) 36, a choice based on the very good performances of this tool in a recent benchmark of 45 single-cell trajectory inference 71. We ran the analysis using the UMAP coordinates and the hierarchical clustering labels. Cluster 8 (HSCs) was set up as the start cluster. The cluster-based minimum spanning tree and the reconstructed smooth curves are shown in Fig. 5g. We compared this trajectory to the Monocle 3 results, where a cell from cluster 8 was also set as starting point of the trajectory (Fig 5g) 72.
Integration of our dataset with a scRNA-seq dataset of sorted subsets from Rodriguez-Fraticelli et al 16, 69 was done using the findIntegrationAnchors function from the Seurat package 73. A newly generated UMAP projection of the joint dataset is shown as Extended Data Fig. 4i.
Statistical analysis
A two-tailed unpaired Student`s t test was performed comparing frequency of YFP+ subsets in BM and spleen at steady state and following sublethal irradiation (Fig. 7a). *, P < 0.05; **, P < 0.01; ***, P < 0.001; ****, P < 0.0001.
A multiple two-tailed unpaired Student`s t test was performed for Experiments shown in Fig. (6e) *, P < 0.05; **, P < 0.01; ***, P < 0.001; ****, P < 0.0001. Error bars indicate s.e.m.
Extended Data
Extended Data Fig. 1. Generation of TdThCD4 and TdTicre mice.
(a) Representative FACS plots showing the gating strategy for T-cell progenitors in the thymus: double negative (DN), double positive (DP) and CD4/CD8 single positive (SP).
(b-c) Representative histograms (left panels) and cumulative bar graphs (right panels) showing in (b) hCD4 (n=12) and in (c) YFP (n=6) expression in T-cell progenitors of 6–8 weeks old TdThCD4 “reporter” (b) and TdTYFP “Lineage tracer” (c) mice, respectively. Shown are cumulative results from 3 independent experiments (n=number of mice analyzed). Error bars indicate standard error of the mean (SEM).
(d) Representative FACS plot showing the gating strategy to identify BM Ly6D+EPLMs on cells pre-gated for Lin−B220+CD117+ as indicated.
(e) Representative FACS plots showing the gating strategy for B cells and B cell progenitors in BM. The identified subsets (pro-B, large and small pre-B, immature and recirculating B cells) cells pre-gated on live and PI negative.
(f-g) Representative histograms (left panels) and cumulative bar graphs (right panels) showing in (f) hCD4 (Ly6D+ EPLM, immature B n=6; pro-B, large pre-B, small pre-B n=3; recirculating B n=4) and in (g) YFP (n=6) expression in B-cell progenitors of 6–8 weeks old TdThCD4 “reporter” (f) and TdTYFP “Lineage tracer” (g) mice, respectively. Shown are cumulative results from 3 independent experiments (n=number of mice analyzed). Error bars indicate s.e.m.
Extended Data Fig. 2. Gating strategies to identify progenitors and mature cells.
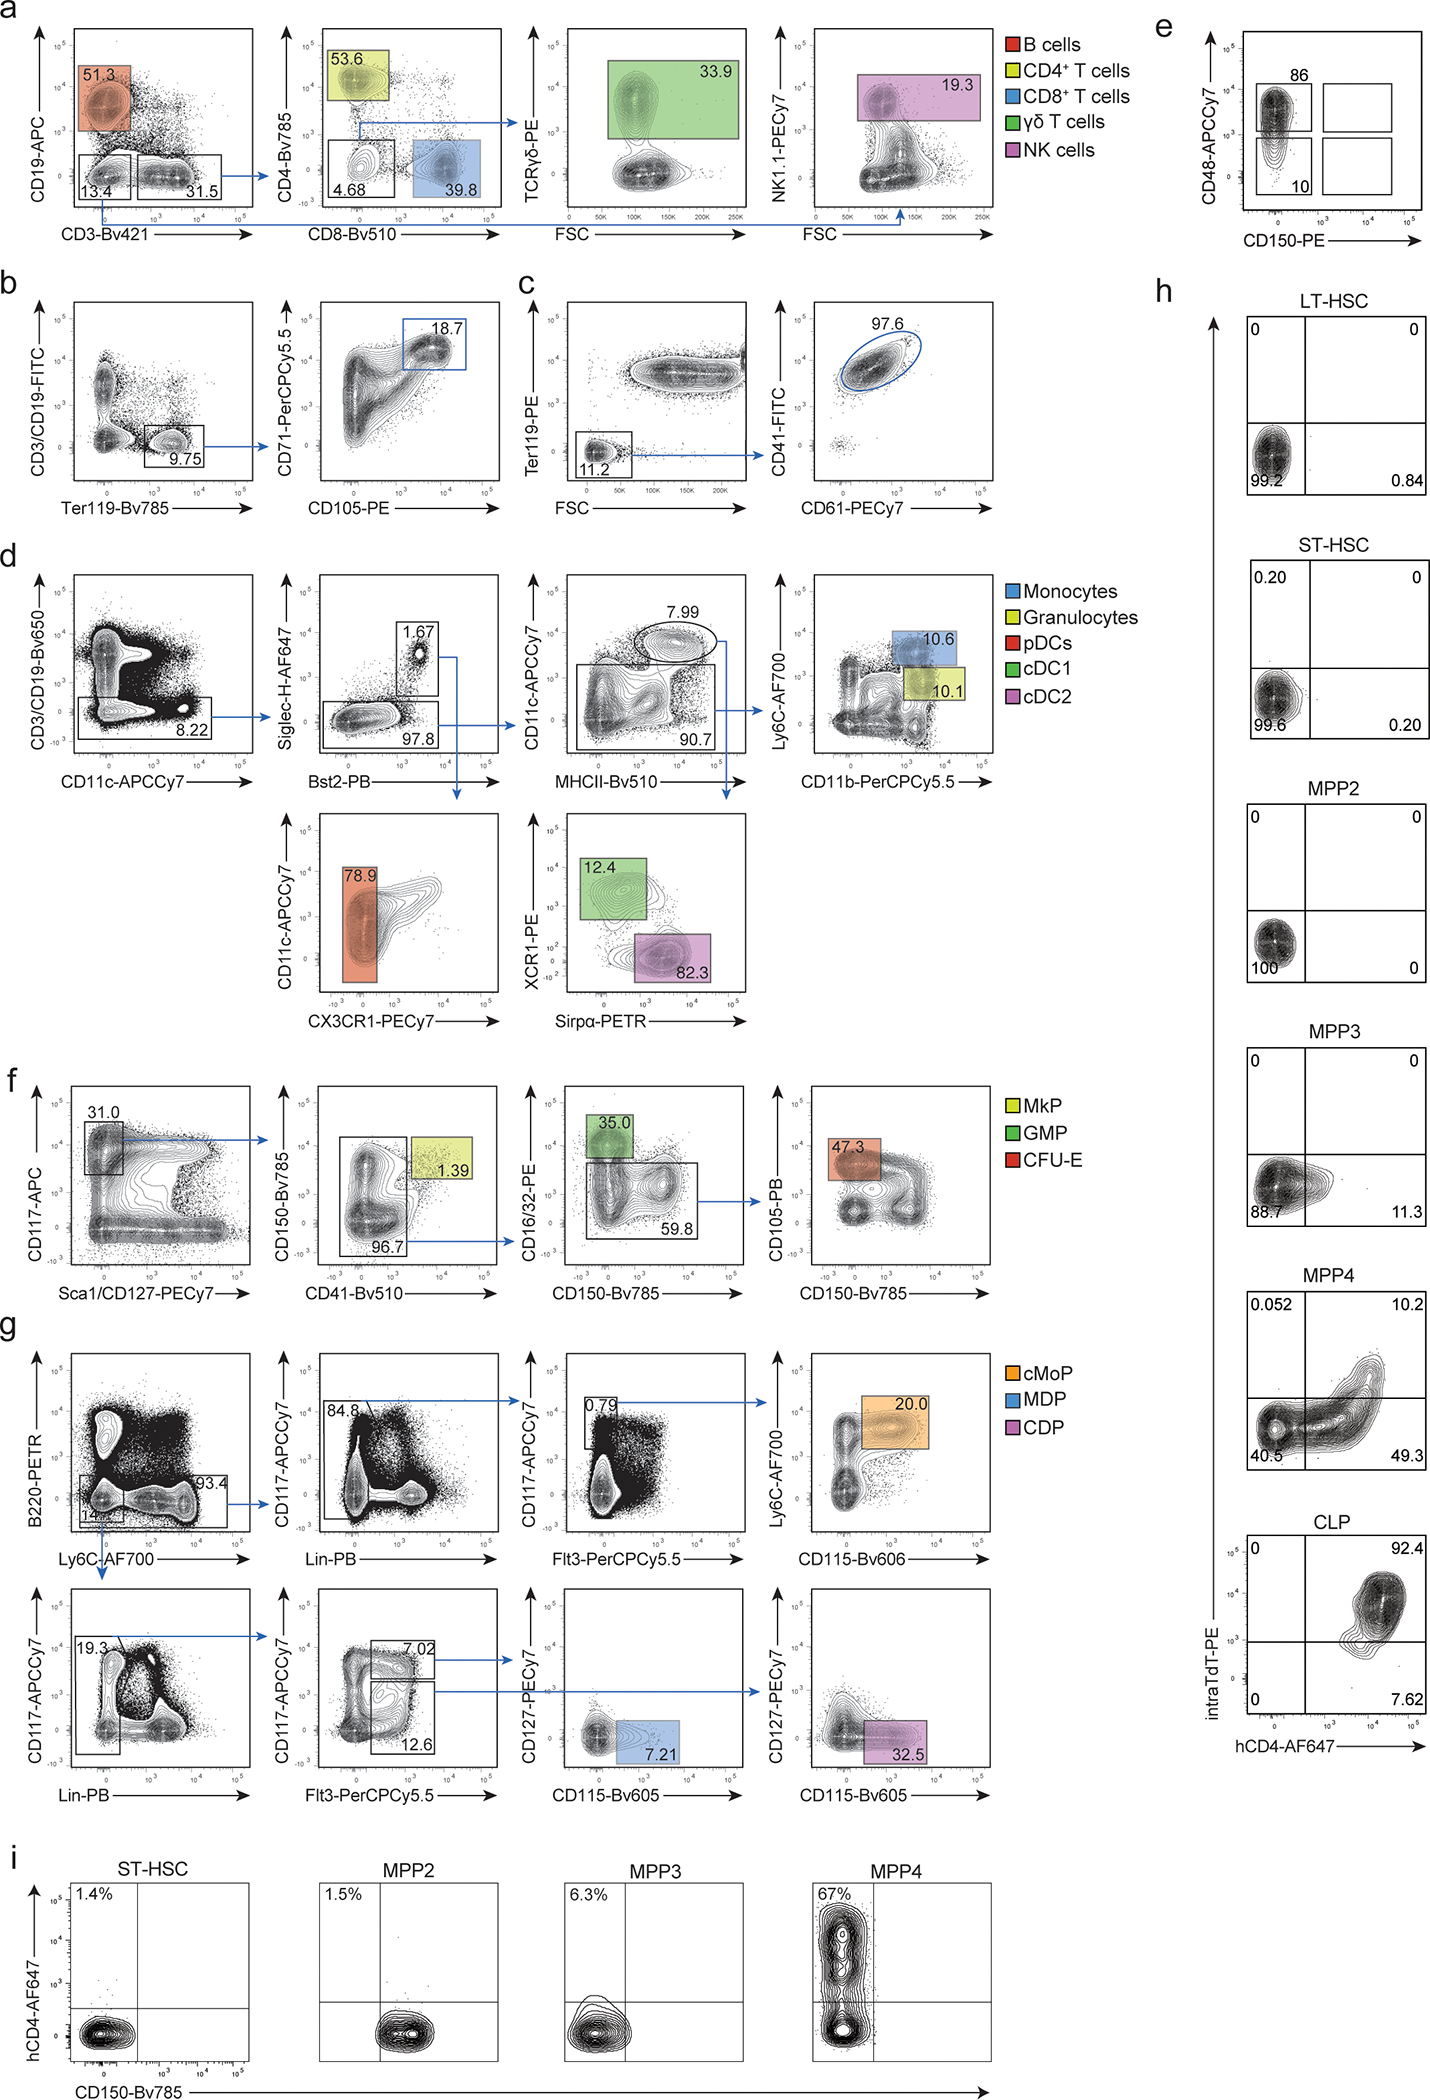
(a-b) Representative histogram plots (upper panels) and cumulative bar graphs (lower panels) showing in (a) hCD4 (Platelets n=4; pro-erythrocytes n=7; granulocyte, monocyte, cDC1, cDC2, pDC, NK cells n=6; CD4+ T cells, CD8+ T cells, γδ T cells n=12; B cells n=9) and in (b) YFP (n=6) expression for different mature hematopoietic subsets in 6–8 weeks old TdThCD4 “reporter” (a) and TdTYFP “Lineage tracer” (b) mice, respectively. Shown are BM cells for pro-erythrocytes, blood mononuclear cells for platelets, and splenocytes for all other subsets. The gating strategies to identify the corresponding cell types are shown in Extended Data 2a–d. Shown are cumulative results from 3 independent experiments. Error bars indicate s.e.m.
(c-g) BM progenitors gated as shown in (c) and in Extended Data 2f,g were analyzed for the expression of hCD4 (d, e) and YFP (f, g) in 6–8 weeks old TdThCD4 “reporter” (d, e) and TdTYFP “Lineage tracer” (f, g) mice. (c) HSC, MPP subsets and CLPs were identified by the indicated gates. (d-g) Representative histograms (left panels) and cumulative bar graphs (right panels) showing in (d, e) hCD4 and in (f, g) YFP expression for the indicated progenitor subsets. (d) n=12; (e) n=3; (f) n=6; (g) n=6. Shown are cumulative results from 3 independent experiments. Error bars indicate s.e.m.
Extended Data Fig. 3. Reduced self-renewal capacity of YFP− MPP4s.
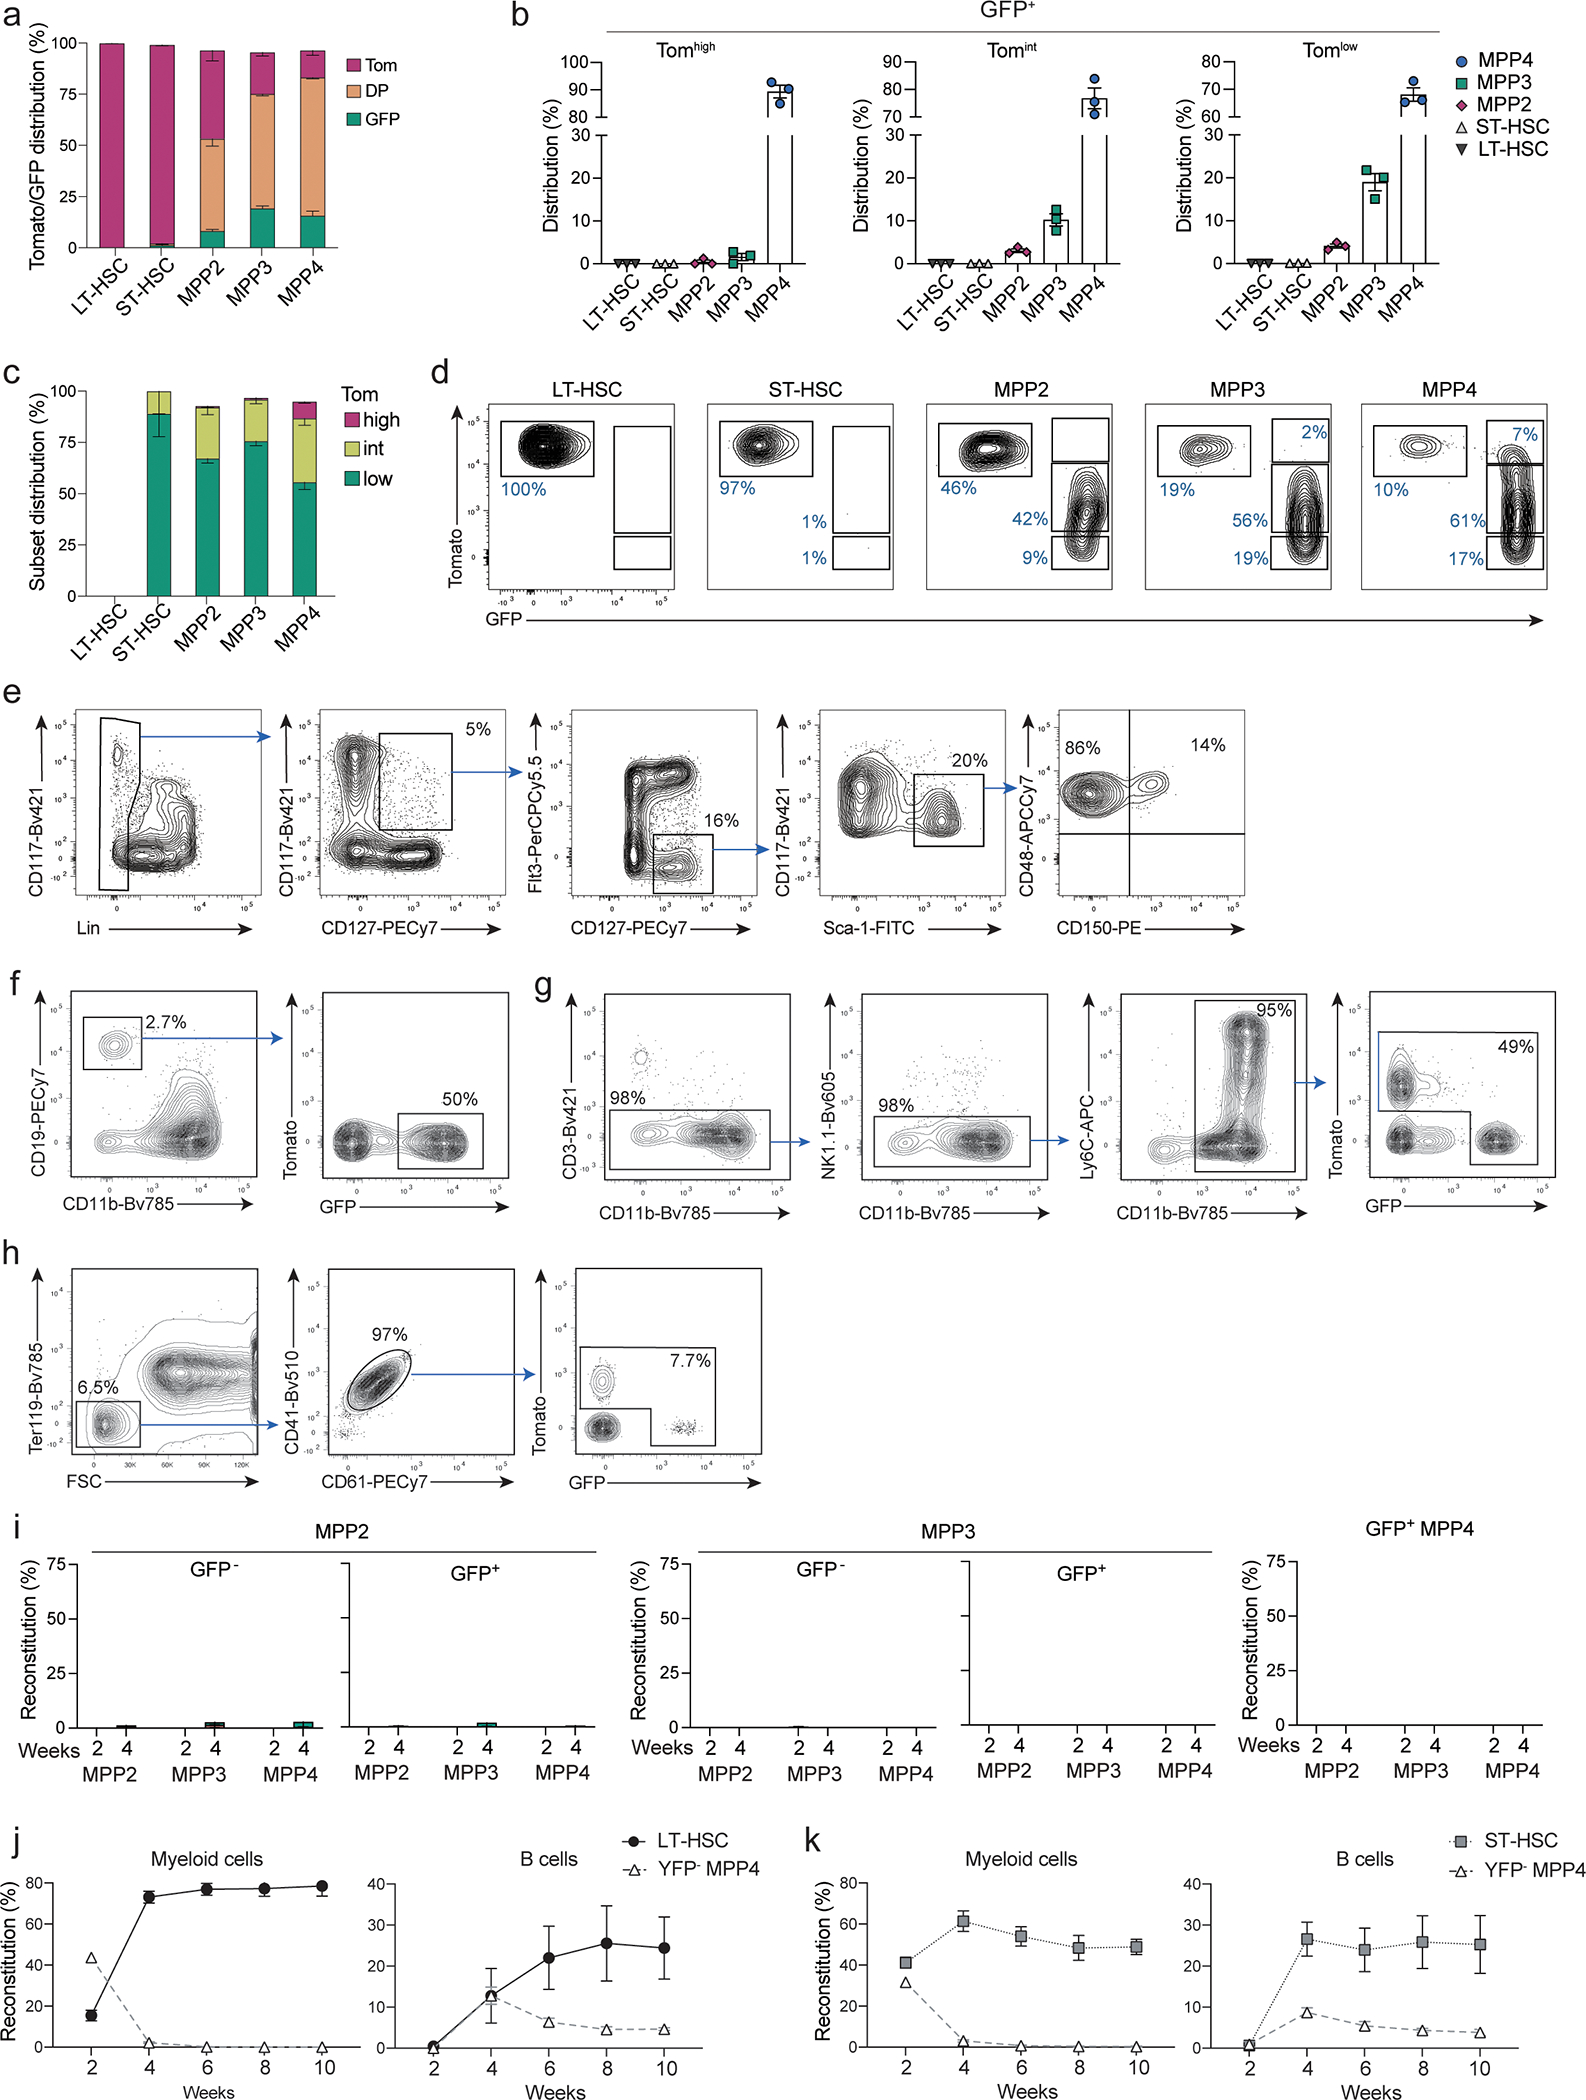
(a-b) BM cells from 6–8 weeks old TdTmTmG mice were analyzed for the expression of Tomato and GFP. (a) Shown are representative histograms for Tomato expression from 2 independent experiments (n=3) for LT-, ST-HSC and GFP+ MPPs, CLPs and GMPs gated as in Fig. 2c; Extended Data 2f. (b) Two color histograms showing the expression of FLT3 and CD150 (right panels top row) or CD48 and CD150 (right panels bottom row) of LSK pre-gated as TomatohiGFP− (black), TomatohiGFP+ (red), TomatointGFP+ (Yellow), TomatolowGFP+ (green) as shown in the left plot.
(c) B- (top plot) and myeloid (bottom plot) precursor frequency determined by in vitro limiting dilution assays for MPP2s, MPP3s, and MPP4s (gated as in Fig. 2c) isolated from the BM of 6–8 weeks old TdTYFP mice. MPP subsets are sorted as YFP− or YFP+ as indicated. Shown is one representative experiment (n=3).
(d-e) 4000 MPPs (gated as in Fig. 2c) were isolated from the BM of 6–8 weeks old TdTmTmG mice and transferred intra venously (i.v.) into sub-lethally irradiated WT recipients. Shown is the reconstitution for each GFP+ or GFP− MPP subset as indicated. (d) Percent reconstitution curves in peripheral blood of recipient animals for B cells (CD19+, CD11b−), myeloid cells (CD11b+, CD3−, NK1.1−) and platelets (FSClow, Ter119−, CD41+, CD61+) determined at the indicated timepoints after transfer: day 7, 10, 14, 21, and 28 for platelets and on days 10, 14, 21, and 28 for B and myeloid cells. Shown are cumulative data from 3–6 independent experiments n=2–17 (e) Shown are percent reconstitution of recipient animals for mature subsets (gated as in Extended Data 2a–d) after two and four weeks in the bone marrow (pro-Erythrocytes), peripheral blood (platelets) and spleen (all other subsets). Shown are cumulative data from 3 independent experiments per timepoint. Error bars indicate s.e.m.
(f) 4000 GFP− MPP4s were transferred into sub-lethally irradiated WT recipients. Shown are percent reconstitution in the bone marrow of recipient animals of Tomato+ (red bars) and GFP+ (green bars) MPP2s, MPP3s and MPP4s after two and four weeks. (Cumulative from 2 independent experiments. Two weeks n=10, four weeks n=7). Error bars indicate s.e.m.
Extended Data Fig. 4. HSC and MPP transcriptional profiling using a posteriori gating.
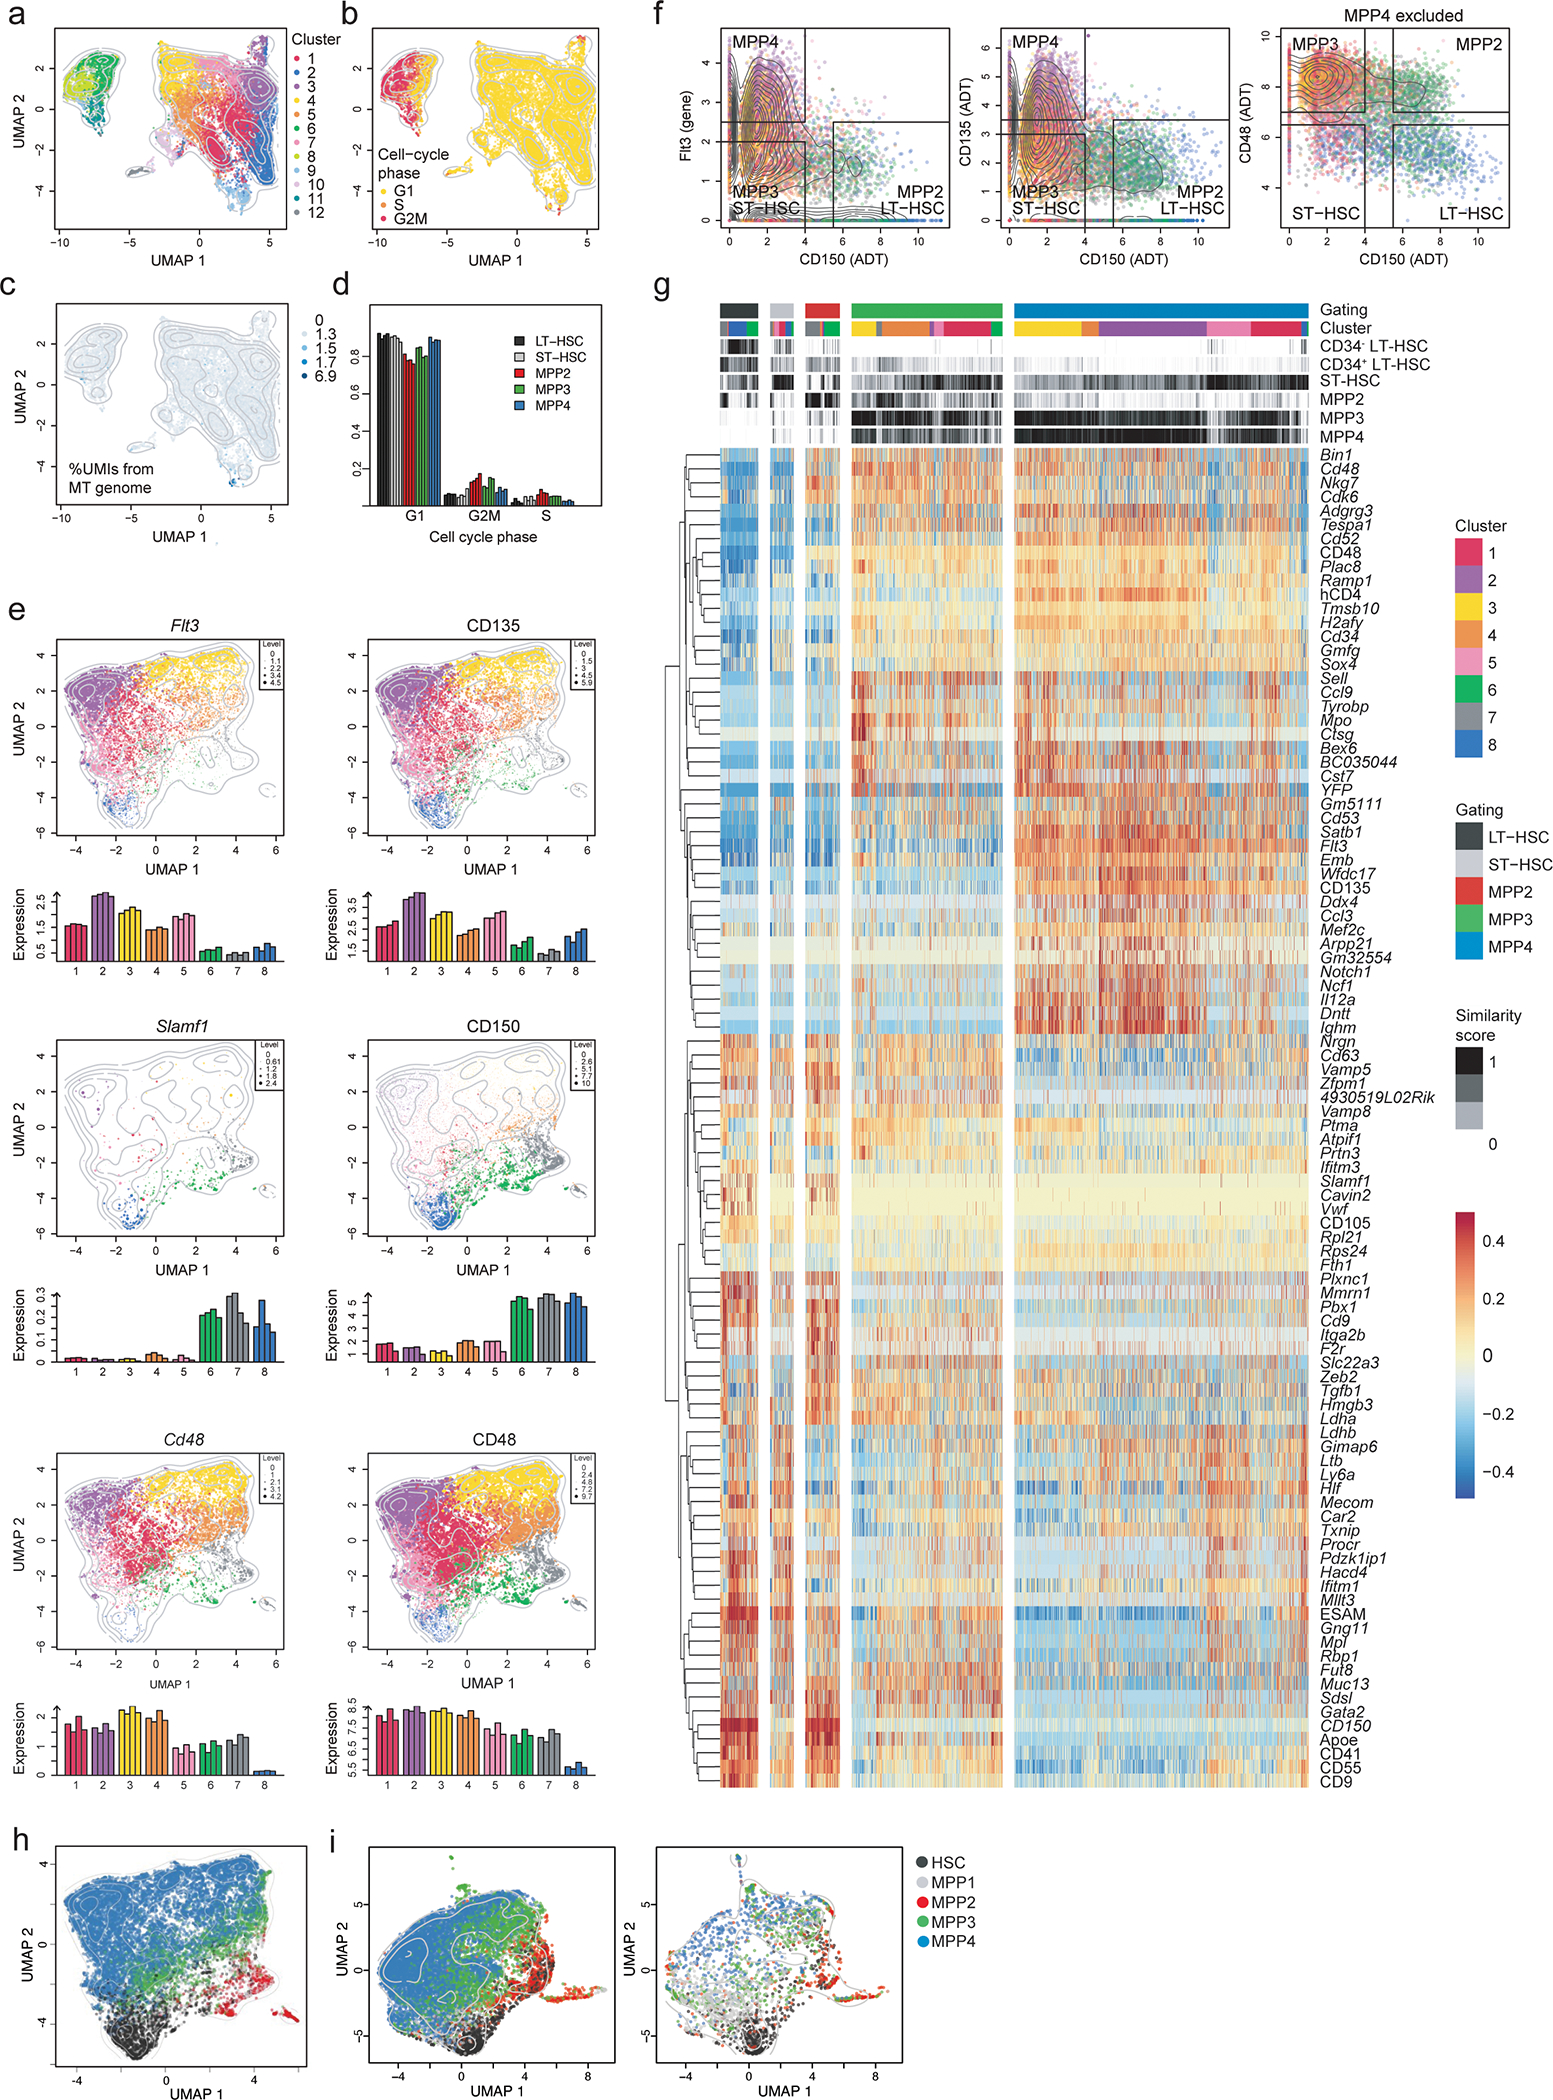
LSK cells isolated from BM of four 6–8 weeks old TdThCD4/YFP double reporter mice were used for single-cell RNA sequencing in combination with CITE-Seq labelling as described in the methods.
(a-c) Hierarchical clustering analysis was performed and projected in a 2-dimensional space using UMAP as explained in the methods. Each color represents a specific cluster as indicated. (a) Hierarchical clustering identified 12 clusters. (b) Cell-cycle phase, represented by the colors yellow (G1), orange (S) and red (G2), of each cell was determined as described in the methods. (c) Unique molecular identifiers (UMIs) coming from the mitochondrial (MT) genome were quantified across cells, reflected by the color intensity. Contour lines display the 2D cell density on the UMAP space.
(d) Shown is a bar plot distribution indicating the frequency of cells in the different phases of the cell cycle across subsets obtained for the “a posteriori gating defined as in Fig. 4b.
(e) UMAP and bar graphs illustrating the scaled expression of the Flt3, Slamf1, and Cd48 mRNA (left panels), as well as the expression of their corresponding surface markers used for CITE-Seq (right panels). The colors represent cells from the different clusters. Dot size and color intensity indicate expression levels. Bar height in bar graphs indicate the average expression across cells from each biological replicate across clusters.
(f) A posteriori gating strategy used to define HSC and MPP populations within the CITE-Seq data. For MPP4: Flt3 > 2.5, CD135 > 3.5, and CD150 < 4. For MPP3: Flt3 < 2, CD135 < 3, CD150 < 4, and CD48 > 7. For MPP2: Flt3 < 2.5, CD135 < 3.5, CD150 > 5.5, and CD48 > 7. For LT-HSC: Flt3 < 2.5, CD135 < 3.5, CD150 > 5.5, and CD48 < 6.5. For ST-HSC: Flt3 < 2, CD135 < 3, CD150 < 4, and CD48 < 6.5. The colors represent cells from the different clusters.
(g) Heatmap displaying the centered and scaled expression of the top differentially expressed genes between the gated populations defined as in (e), resulting in a list of 96 markers. Cells were ordered following the hierarchical clustering tree. Cluster assignment and similarity score of each cell to reference ImmGen RNA-seq samples is shown on top of the heatmap.
(g) Shown is the UMAP distribution of our single cell dataset assigned using the previously published bulk RNA-Seq obtained from sorted progenitors (see gates below) from ref 29.
(i) Shown is the UMAP distribution for the integrated analysis of our dataset with the previously published scRNA-Seq obtained from ref34 obtained using the Seurat package (findIntegrationAnchors function) 35. On the left the overlay of the two data sets on the right the scRNA-Seq obtained from ref34.
Extended Data Fig. 5. Single-cell gene expression profiling of LSKs.
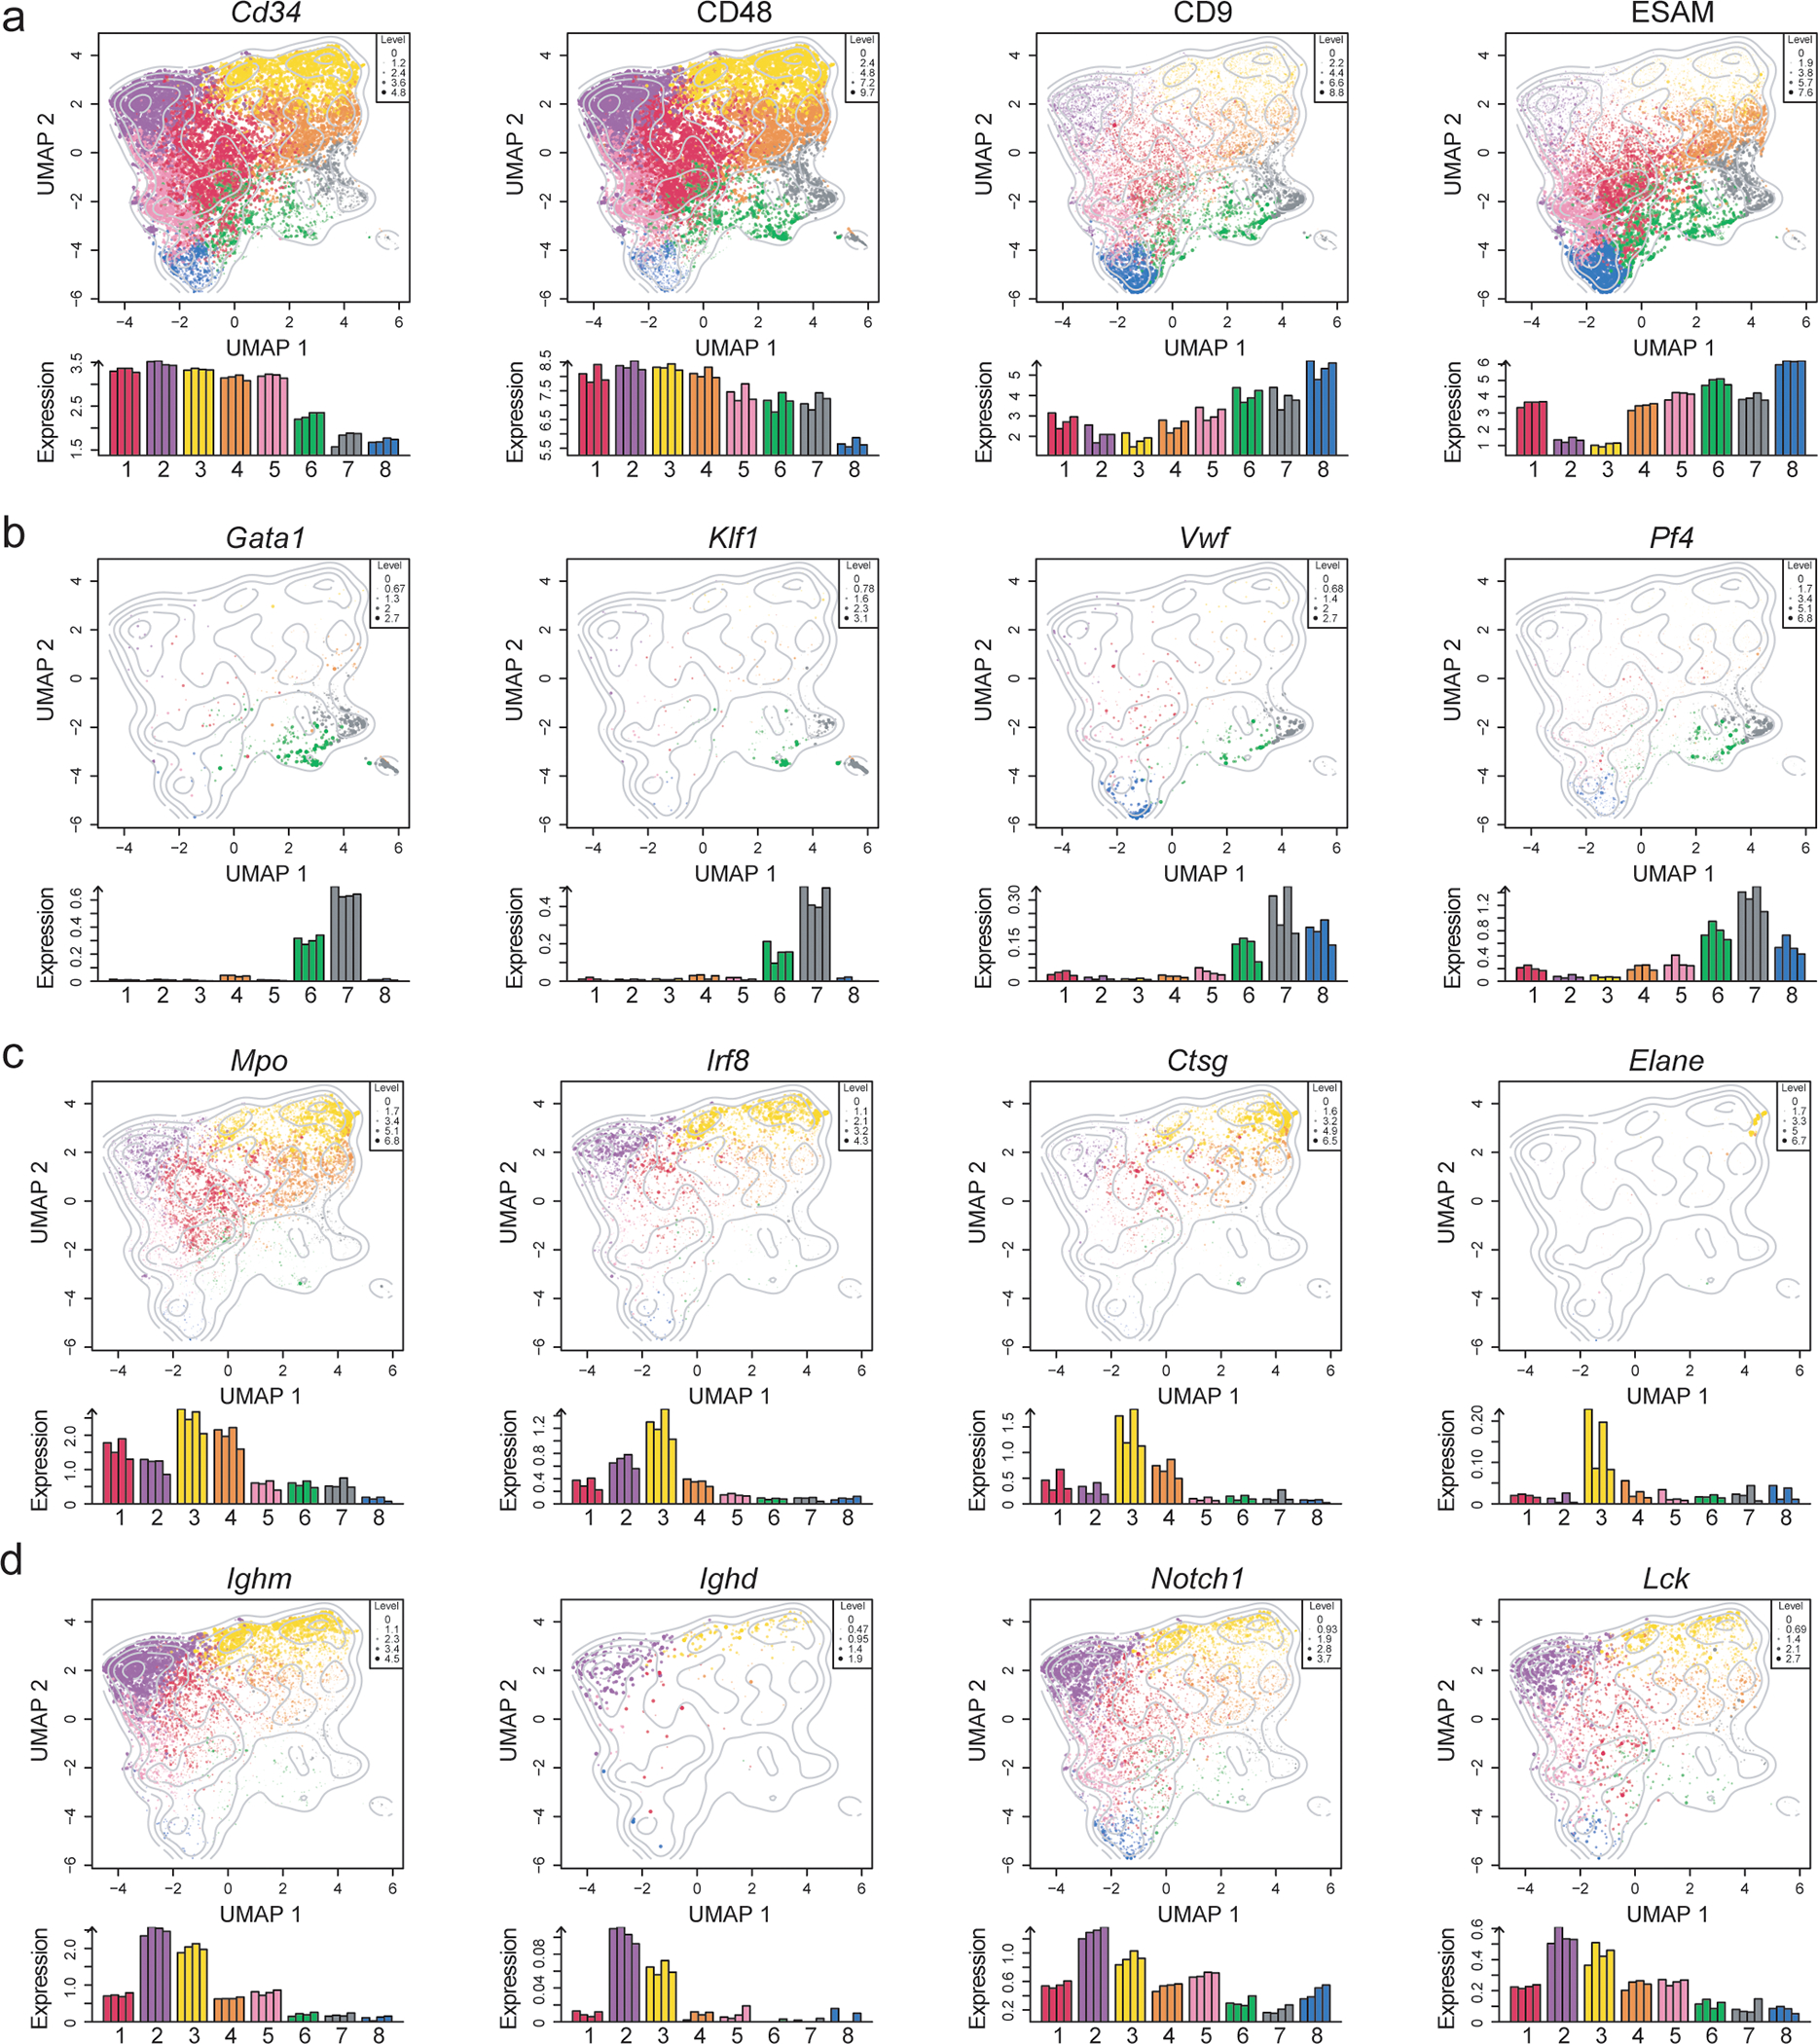
(a-d) UMAP and bar graphs illustrating the scaled expression for selected (a) stem cell-related markers and surface receptors (Cd34, CD48, CD9, ESAM); (b) erythroid (Gata1, Klf1, Vwf, and Pf4), (c) myeloid (Mpo, Irf8, Ctsg, Elane), (d) lymphoid (Ighm, Ighd, Notch1, Lck). The colors represent cells from the different clusters. Dot size and color intensity indicate expression levels. Below is the distribution across clusters where bar height indicates the average expression across cells from each biological replicate across clusters.
(e) Cluster distribution within the UMAP space obtained performing Graph-based clustering as described in the Seurat package.
(f) Correlation heatmap between the clusters obtained as in (e) based on the Seurat package and as in Fig. 4a, based on hierarchical clustering and dynamicTreeCut.
Extended Data Fig. 6. Single cell profiling and functional characterization of MPP3s.
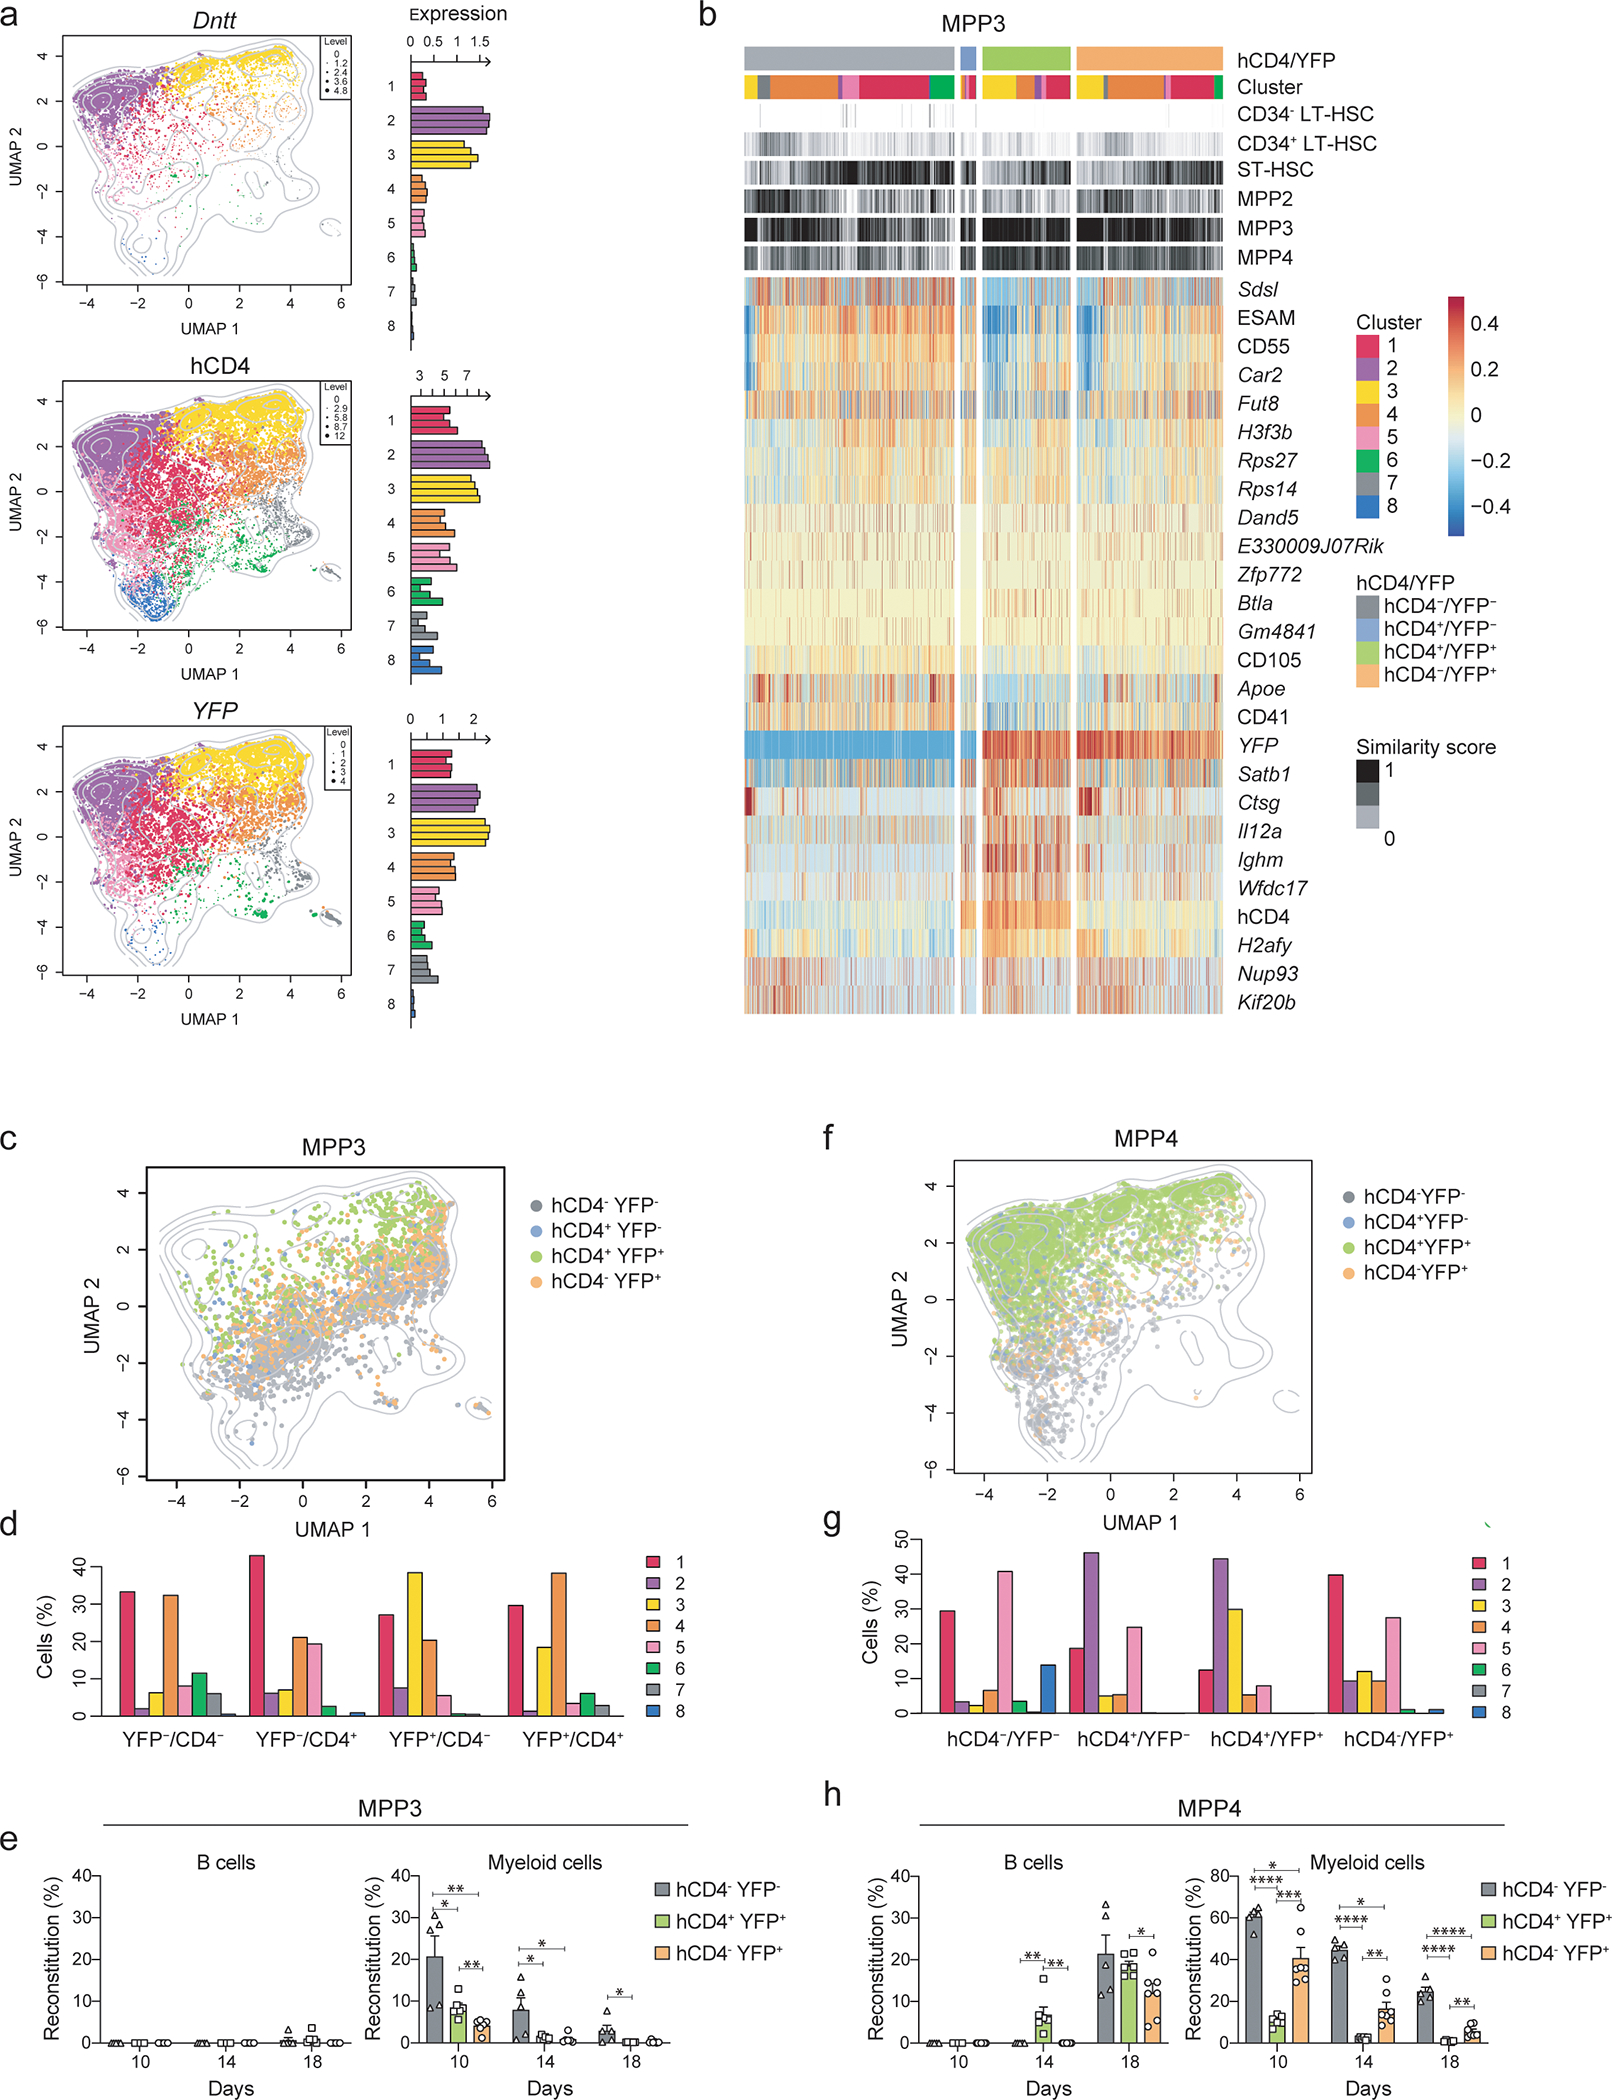
(a) UMAP and bar graphs illustrating the scaled expression of the Dntt mRNA, hCD4 surface marker, and YFP. The colors represent cells from the different clusters. Dot size and color intensity indicate expression level. Bar height in bar graph indicate the average expression across cells from each biological replicate across clusters.
(b) Compiled data showing hCD4−YFP−, hCD4+YFP−, hCD4+YFP+, and hCD4−YFP+ MPP3s, annotated based on a posteriori gating as in Fig. 4b, in relation to their cluster distribution defined as in Fig. 4a; the similarity score to reference samples from the ImmGen dataset defined as in Fig. 4c; centered and scaled expression for the top 26 markers differentially expressed between subsets.
(c) UMAP plot illustrating the distribution of hCD4−YFP− (grey), hCD4+YFP− (blue), hCD4+YFP+ (green), and hCD4−YFP+ (orange) MPP3 cells.
(d) Bar graph showing the distribution of the subsets as in (c) across clusters defined as in Fig. 4a. The colors represent the different clusters.
(e) hCD4−YFP−, hCD4+YFP+, and hCD4−YFP+ MPP3s were sorted from the BM of 6–8 weeks old TdThCD4/YFP mice and 1500 cells were transferred i.v. in competition with 1500 ST-HSCs sorted from the BM of 6–8 weeks old WT-CD45.1/2 mice into sub-lethally irradiated WT-CD45.1 recipients. Shown are the percent peripheral blood reconstitutions for B cells (CD19+CD11b−) and myeloid cells (CD11b+, CD3−, NK1.1−) at the indicated timepoints after transfer. Data were collected from 2 independent experiments (hCD4−YFP− MPP3 n=5; hCD4+YFP+ MPP3 n=6; hCD4−YFP+ MPP3 n=6). A multiple two-tailed unpaired Student`s t test was performed. (Myeloid cells: hCD4−YFP− and hCD4+YFP+ day 10 P=0.026, day 14 P=0.03, day 18 P=0.049; hCD4−YFP− and hCD4−YFP+ day 10 P=0.005, day 14 P=0.026; hCD4+YFP+ and hCD4−YFP+ day 10 P=0.004). *, P < 0.05; **, P < 0.01; ***, P < 0.001; ****, P < 0.0001. Error bars indicate s.e.m.
(f) UMAP plot illustrating the distribution of hCD4−YFP− (grey), hCD4+YFP− (blue), hCD4+YFP+ (green), and hCD4−YFP+ (orange) MPP4 cells.
(g) Bar graph showing the distribution of the subsets as in (f) across clusters defined as in Fig. 4a. The colors represent the different clusters.
(h) hCD4−YFP−, hCD4+YFP+, and hCD4−YFP+ MPP4s were sorted from the BM of 6–8 weeks old TdThCD4/YFP mice and 1500 cells were transferred i.v. in competition with 1500 ST-HSCs sorted from the BM of 6–8 weeks old WT-CD45.1/2 mice into sub-lethally irradiated WT-CD45.1 recipients. Shown are the percent peripheral blood reconstitutions for B cells (CD19+CD11b−) and myeloid cells (CD11b+, CD3−, NK1.1−) at the indicated timepoints after transfer. Data were collected from 2 independent experiments (hCD4−YFP− MPP4 n=5; hCD4+YFP+ MPP4 n=6; hCD4−YFP+ MPP4 n=7). A multiple two-tailed unpaired Student`s t test was performed (B cells: hCD4−YFP− and hCD4+YFP+ day 14 P=0.008; hCD4+YFP+ and hCD4−YFP+ day 14 P=0.002, day 18 P=0.03; Myeloid cells: hCD4−YFP− and hCD4−YFP+ day 10 P=0.011, day 14 P=0.00003, day 18 P=0.000004; hCD4+YFP+ and hCD4−YFP+ day 10 P=0.00021, day 14 P=0.0012, day 18 P=0.002). *, P < 0.05; **, P < 0.01; ***, P < 0.001; ****, P < 0.0001. Error bars indicate s.e.m.
Extended Data Fig. 7. ESAM defines the developmental hierarchy of MPPs.
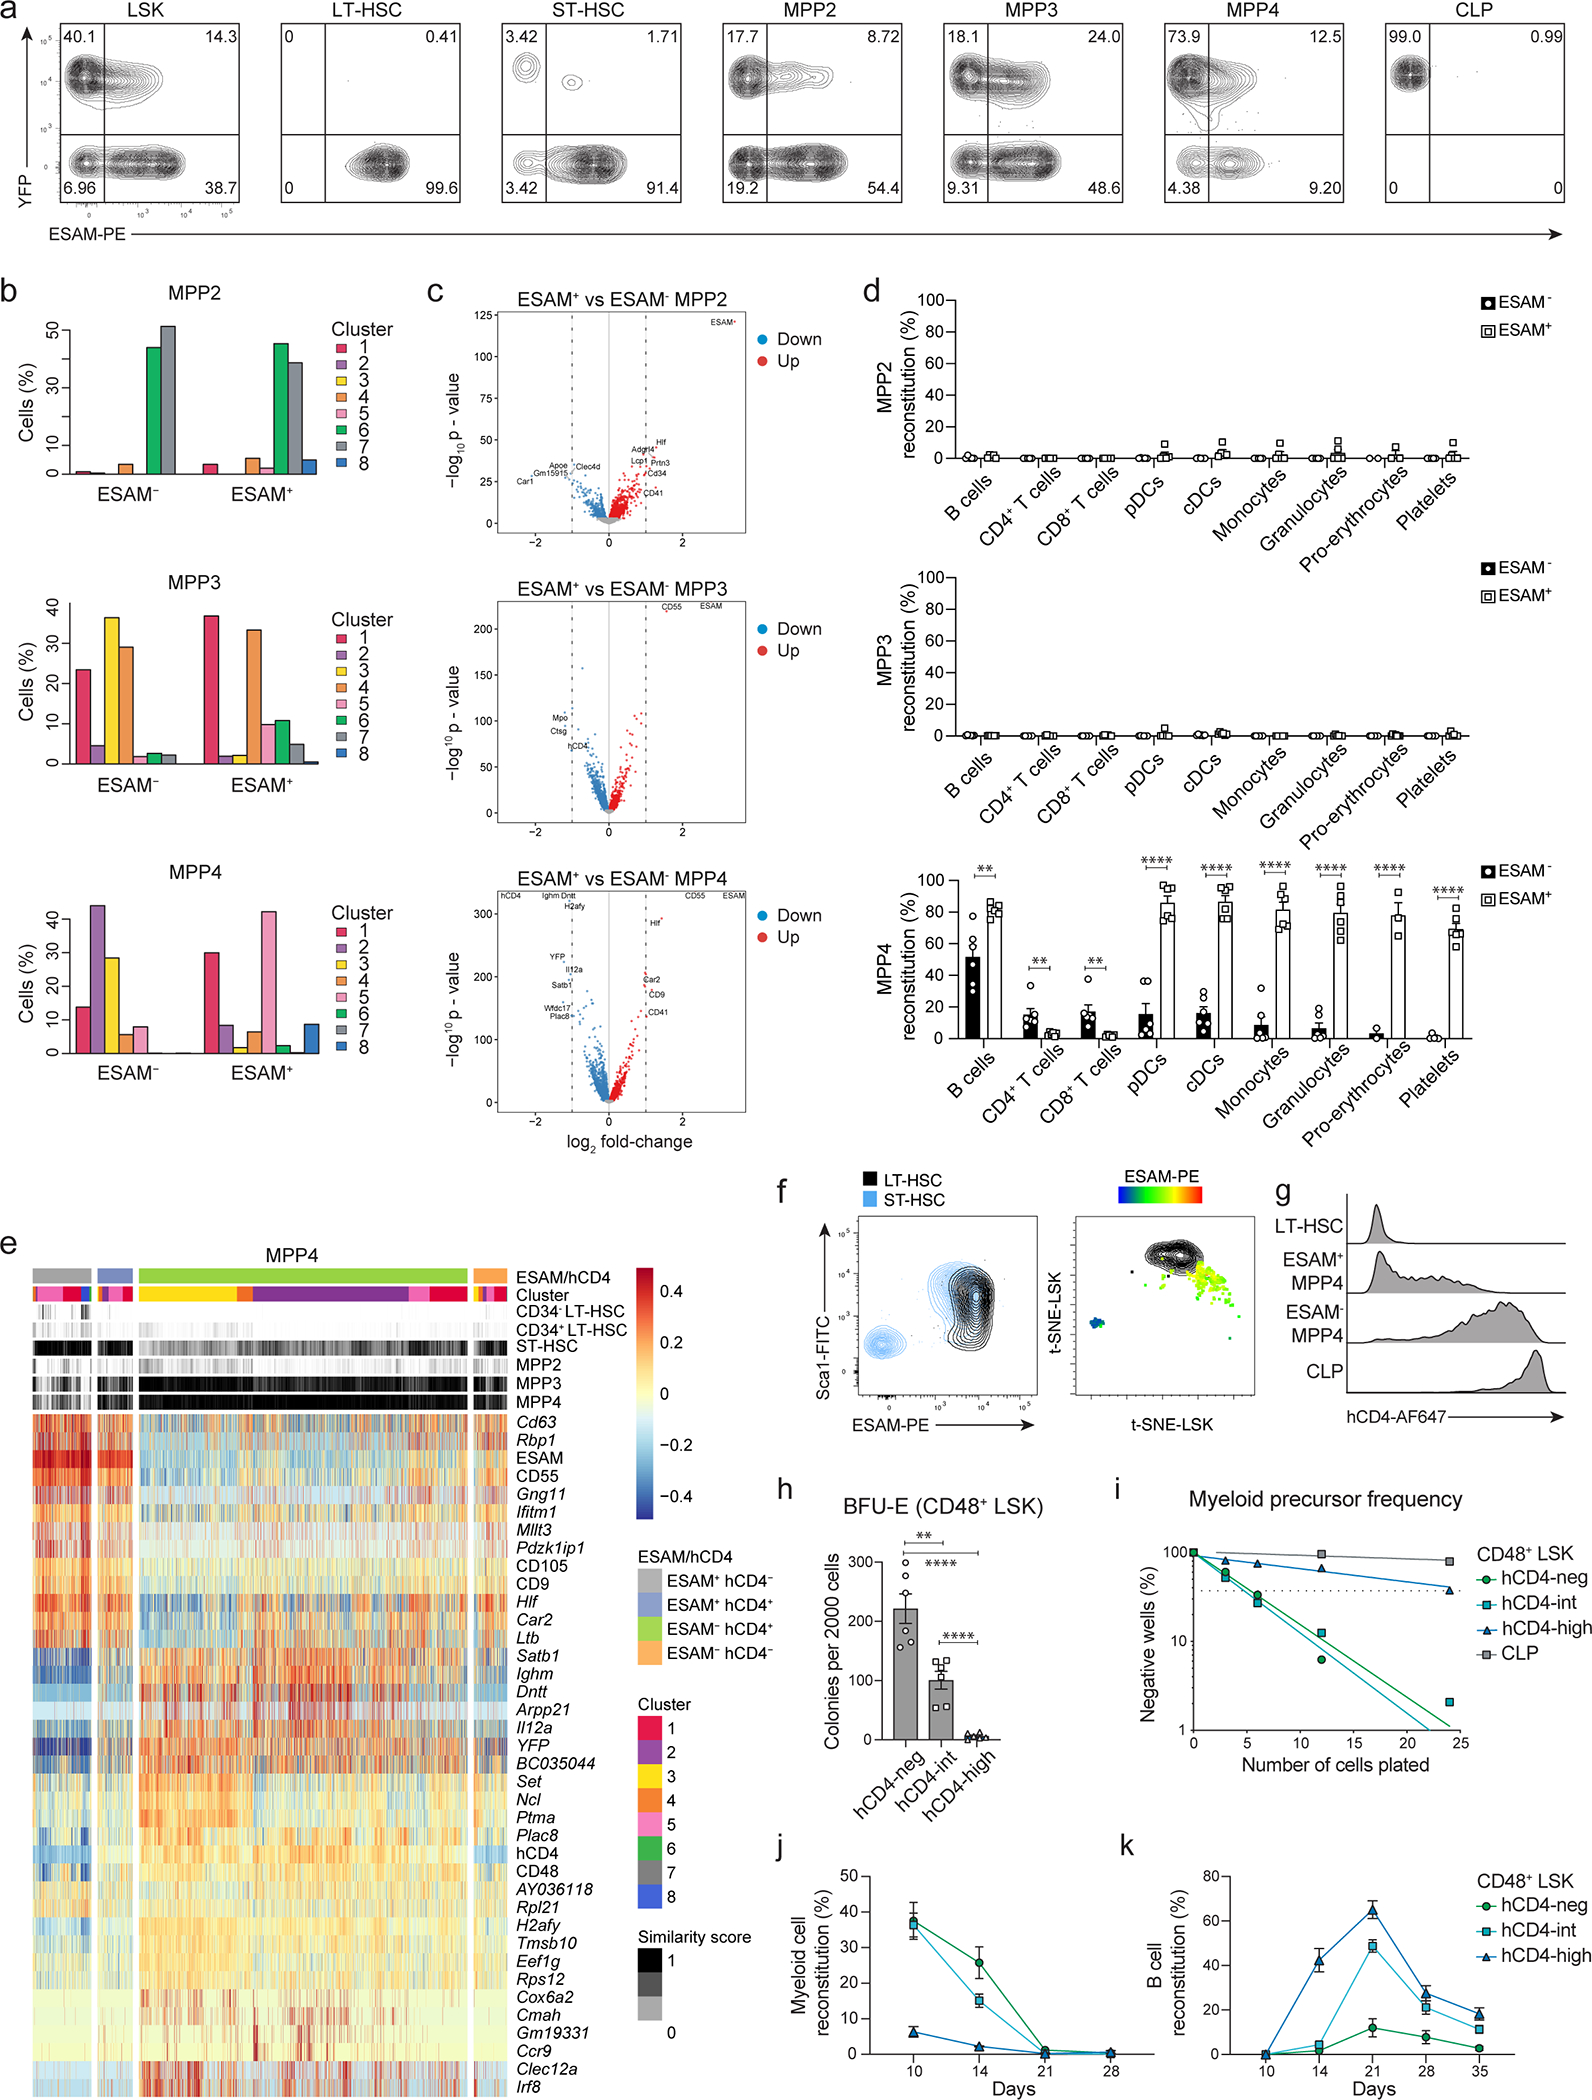
(a) Two color histograms depicting the expression of YFP and ESAM from BM cells of 6–8 weeks old TdThCD4/YFP mice. Cells are pre-gated as shown in Fig. 2c.
(b-c) Progenitors were defined using the “a posteriori” gating (Extended Data 4f) as ESAM negative and positive MPP2s (top) MPP3s (middle) and MPP4s (bottom). (b) Shown is the distribution with the frequency across clusters for each subset. (c) Shown are volcano plots projecting the difference in gene expression for each subset. Genes downregulated in the ESAM− fractions with an FDR<0.01 are marked in blue and genes upregulated in the ESAM+ fractions are marked in red. Genes with an abs log2 FC>1 are labeled.
(d) 4000 ESAM negative and positive MPP2s (top) MPP3s (middle) and MPP4s (bottom) were isolated from the BM of 6–8 weeks old Rosa26mTmG mice and transferred i.v. into sub-lethally irradiated WT recipients. Shown are cumulative data with percent reconstitution of recipient animals for mature subsets (gated as shown in Extended Data 2a–d) after four weeks in the bone marrow (pro-Erythrocytes), peripheral blood (platelets) and spleen (all other subsets). Data were collected from 3 independent experiments. A multiple two-tailed unpaired Student`s t test was performed (MPP4: B cells P=0.003, CD4+ T cells P=0.0097, CD8+ T cells P=0.005, pDCs P=0.000005, monocytes P=0.000001, pro-erythrocytes P=0.006). **, P < 0.01; ****, P < 0.0001. Error bars indicate s.e.m.
(e) Compiled data showing ESAM+hCD4−, ESAM+hCD4+, ESAM−hCD4+, and ESAM−hCD4− MPP4s, annotated based on the “a posteriori” gating as in (Extended Data 4f), in relation to their cluster distribution defined as in Fig. 4a; the similarity score to reference samples from the ImmGen dataset defined as in Fig. 4c; The top 38 differentially expressed markers and genes between subsets is centered and scaled.
(f) Representative histograms illustrating the expression levels of hCD4 within LT-HSCs, ESAM+ and ESAM− MPP4s, and CLPs isolated from the BM of 6–8 weeks old TdThCD4 mice.
(g) Shown is the expression of Sca-1 and ESAM for LT- and ST-HSCs (Left plot) gated as shown in Fig. 2c. LT- (in black) and ST-HSCs (color scale) are projected into a t-SNE plot. ST-HSCs are projected indicating the expression of ESAM.
(h-k) CD48+ LSKs isolated from the BM of 6–8 weeks old TdThCD4 mice were sorted based on the expression of hCD4 as indicated. (h) 2000 cells were analyzed for erythroid colony forming potential (BFU-E). Shown are the number of colonies obtained. Data were collected from 3 independent experiments (n=6). Statistical analysis was done with two-tailed unpaired Student`s t test (hCD4-neg and hCD4-int P=0.002). *, P < 0.05; **, P < 0.01; ***, P < 0.001; ****, P < 0.0001. Error bars indicate s.e.m.. (i) Myeloid precursor frequency was determined for the indicated subsets by in vitro limiting dilution analysis, as described in methods. Shown is one representative experiment (n=3). Error bars indicate s.e.m. (j, k) 4000 cells were transferred i.v. into sub-lethally irradiated WT-CD45.1 recipients in competition with 4000 hCD4-neg CD48+ LSK cells sorted from TdThCD4-CD45.1/2 mice. Shown is the percent peripheral blood reconstitution for CD11b+CD3−NK1.1− myeloid (j) and CD19+CD11b− B cells (k) at the indicated timepoints after transfer. Data were collected from 3 independent experiments. Error bars indicate s.e.m.
Extended Data Fig. 8. A new functional classification of early hematopoietic progenitors.
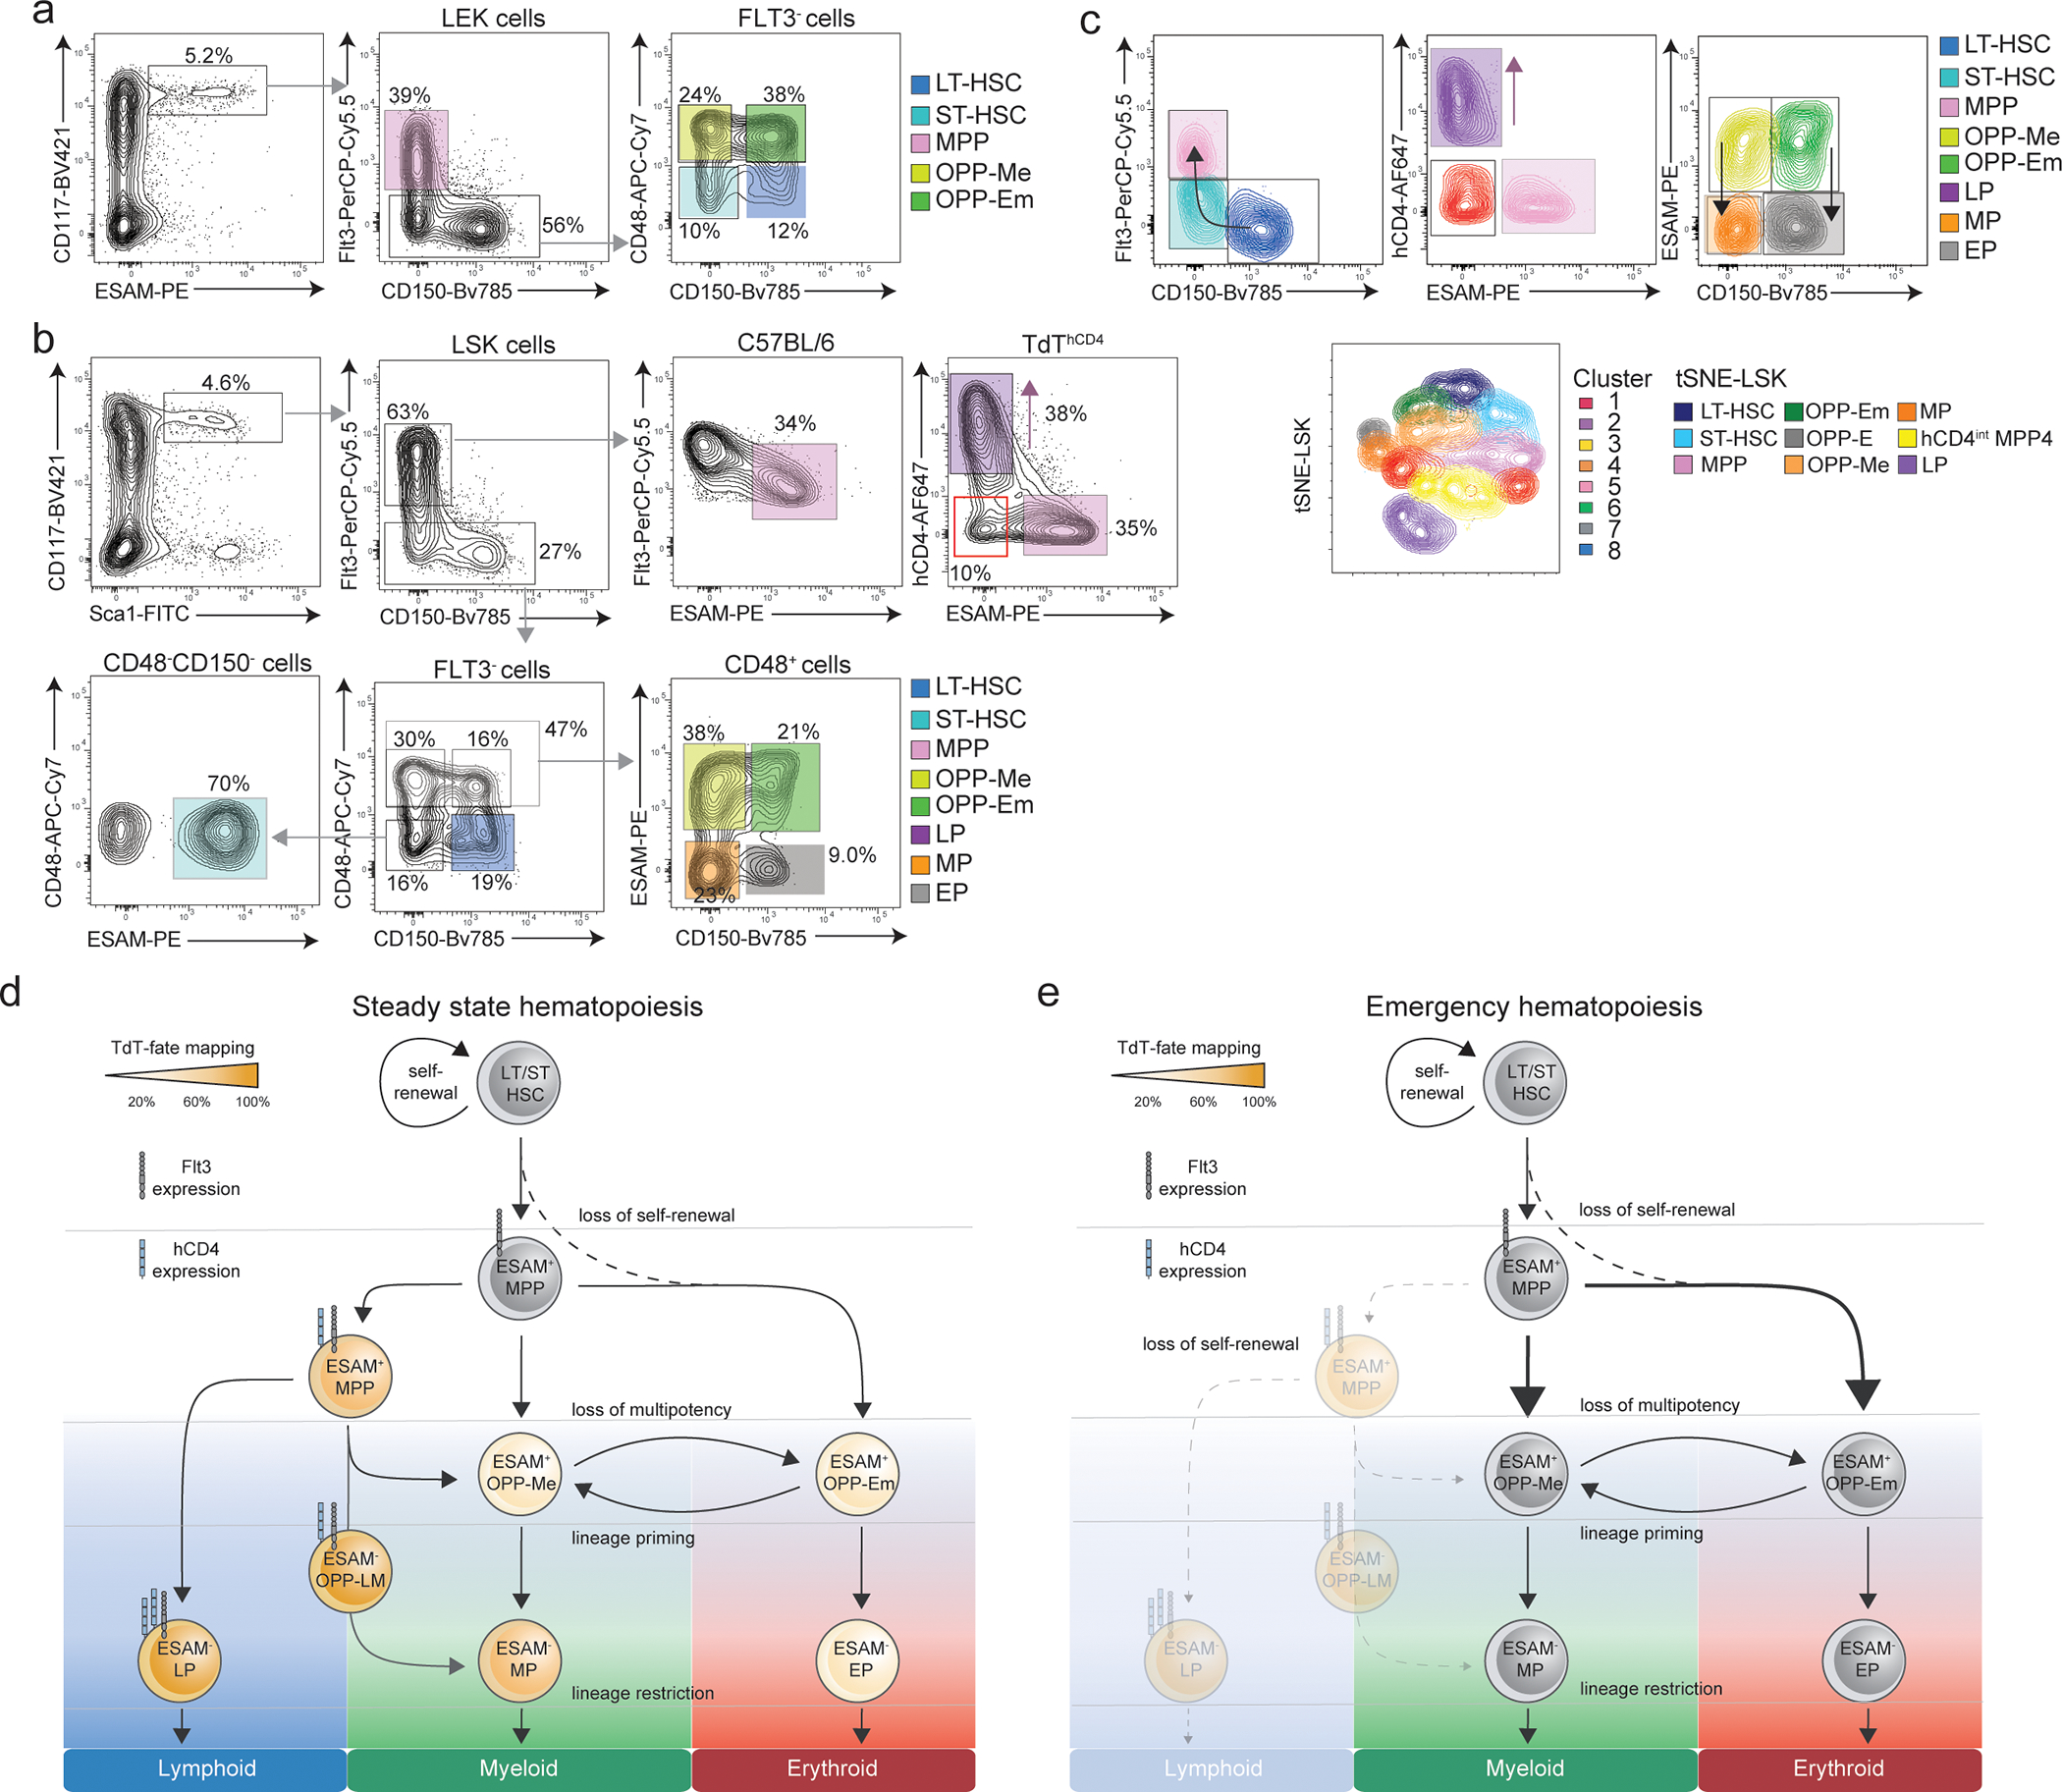
(a,b) Shown is the improved gating strategy depicting the use of ESAM to identify LT-, ST-HSCs, bona fide MPPs and oligopotent progenitors (OPP) with prominent myeloid and limited erythroid OPP-Me or prominent erythroid and limited myeloid OPP-Em potential. Lin− progenitors are pre-gated as IL-7R− and referred as LEKs (Lineage−ESAM+cKit+). LEKs are further subdivided based on FLT3 expression as bona fide MPPs (FLT3+ LEK), ST-HSCs (FLT3−CD48−CD150− LEK), LT-HSCs (FLT3−CD48−CD150+ LEK), Oligopotent Progenitors with prominent Myeloid- and limited erythroid (OPP-Me, FLT3−CD48+CD150− LEK) or prominent Erythroid and limited myeloid potential (OPP-Em, FLT3−CD48+CD150+ LEK) (c).
Progenitors pre-gated as IL-7R− and referred as LSK (lineage−Sca1+ckit+) can be further subdivided based on FLT3 expression as MPP4s (FLT3+). Within this MPP4 subset the expression of ESAM in C57BL/6 mice identifies bona fide MPPs (FLT3+ESAM+ LSK), whereas the combined use of ESAM and hCD4 in TdThCD4 reporter mice allows for the identification of Lymphoid Progenitors (LP, FLT3+hCD4highESAM− LSK), and Oligopotent Progenitors with Lyeloid- and Myeloid potential (OPP-LM) (FLT3+hCD4highESAM− LSK) besides MPPs (FLT3+ESAM+ LSK). FLT3−LSK can be further subdivided as shown into ST-HSCs (FLT3−ESAM+CD48−CD150− LSK), LT-HSCs (FLT3−CD48−CD150+ LSK), OPP-Me (FLT3−ESAM+CD48+CD150− LSK), OPP-Em (FLT3−ESAM+CD48+CD150+ LSK), Myeloid Progenitors (MP, FLT3−ESAM−CD48+CD150− LSK) and Erythroid Progenitors (EP, FLT3−ESAM−CD48+CD150+ LSK) as shown (d). Highlighted are the newly identified subsets.
(c) Each pre-gated subset as obtained from Extended Data 8a,b is color coded according to their transcriptionally most similar cluster as defined in Fig. 4a and gated using selected markers (upper panel) or projected in a two-dimensional t-SNE (lower panel) plot.
(d,e) Schematic model of steady state (d) and emergency (e) hematopoiesis illustrating the proposed hierarchy as observed for HSCs and MPPs in TdT-reporter and lineage tracer mice. Progenitors are labeled for hCD4, YFP, ESAM and FLT3 expression allowing for the new subset’s definition: OPP-LM, OPP-Me, OPP-Em, LP, MP and EP.
Supplementary Material
Acknowledgements
We dedicate this work to the memory T. Rolink, who has been a great mentor and a friend to all of us. His vision and passion for research will remain.
We would like to acknowledge C. Engdahl, G. Capoferri, M. Burgunder and S. Sikanjic for their contribution. We would like to thank A. Offinger and L. Davidson and both teams of animal care takers at the DBM Basel and NIDCR USA for constant support. Further we would like to acknowledge the Genomics Facility Basel (D-BSSE ETH Zürich) for generating the CITE-Seq dataset. Calculations were performed at sciCORE (http://scicore.unibas.ch/) scientific computing center at the University of Basel. We would also like to thank Y. Belkaid, G. Trinchieri, A. Bhandoola and C. Dunbar for their inputs and discussion.
This work was in part supported by the SNF grants PP00P3_179056, 310030_185193 and by the Research Fund of the University of Basel for the promotion of excellent junior researchers (FK). This research was in part supported by the Intramural Research Program of the NIH, NIDCR (ZIADE000752–02).
Footnotes
Competing Interests
The authors declare no competing interests.
Accession numbers
The CITE-Seq dataset is available at the Gene Expression Omnibus database under accession number GSE145491.
References
- 1.Sankaran VG et al. Human fetal hemoglobin expression is regulated by the developmental stage-specific repressor BCL11A. Science 322, 1839–1842 (2008). [DOI] [PubMed] [Google Scholar]
- 2.Sawai CM et al. Hematopoietic Stem Cells Are the Major Source of Multilineage Hematopoiesis in Adult Animals. Immunity 45, 597–609 (2016). [DOI] [PMC free article] [PubMed] [Google Scholar]
- 3.Eaves CJ Hematopoietic stem cells: concepts, definitions, and the new reality. Blood 125, 2605–2613 (2015). [DOI] [PMC free article] [PubMed] [Google Scholar]
- 4.Ikuta K & Weissman IL Evidence that hematopoietic stem cells express mouse c-kit but do not depend on steel factor for their generation. Proc Natl Acad Sci U S A 89, 1502–1506 (1992). [DOI] [PMC free article] [PubMed] [Google Scholar]
- 5.Morrison SJ & Weissman IL The long-term repopulating subset of hematopoietic stem cells is deterministic and isolatable by phenotype. Immunity 1, 661–673 (1994). [DOI] [PubMed] [Google Scholar]
- 6.Ogawa M et al. B cell ontogeny in murine embryo studied by a culture system with the monolayer of a stromal cell clone, ST2: B cell progenitor develops first in the embryonal body rather than in the yolk sac. EMBO J 7, 1337–1343 (1988). [DOI] [PMC free article] [PubMed] [Google Scholar]
- 7.Adolfsson J et al. Upregulation of Flt3 expression within the bone marrow Lin(−)Sca1(+)c-kit(+) stem cell compartment is accompanied by loss of self-renewal capacity. Immunity 15, 659–669 (2001). [DOI] [PubMed] [Google Scholar]
- 8.Christensen JL & Weissman IL Flk-2 is a marker in hematopoietic stem cell differentiation: a simple method to isolate long-term stem cells. Proc Natl Acad Sci U S A 98, 14541–14546 (2001). [DOI] [PMC free article] [PubMed] [Google Scholar]
- 9.Kiel MJ et al. SLAM family receptors distinguish hematopoietic stem and progenitor cells and reveal endothelial niches for stem cells. Cell 121, 1109–1121 (2005). [DOI] [PubMed] [Google Scholar]
- 10.Yang L et al. Identification of Lin(−)Sca1(+)kit(+)CD34(+)Flt3- short-term hematopoietic stem cells capable of rapidly reconstituting and rescuing myeloablated transplant recipients. Blood 105, 2717–2723 (2005). [DOI] [PubMed] [Google Scholar]
- 11.Arinobu Y et al. Reciprocal activation of GATA-1 and PU.1 marks initial specification of hematopoietic stem cells into myeloerythroid and myelolymphoid lineages. Cell Stem Cell 1, 416–427 (2007). [DOI] [PubMed] [Google Scholar]
- 12.Cabezas-Wallscheid N et al. Identification of regulatory networks in HSCs and their immediate progeny via integrated proteome, transcriptome, and DNA methylome analysis. Cell Stem Cell 15, 507–522 (2014). [DOI] [PubMed] [Google Scholar]
- 13.Oguro H, Ding L & Morrison SJ SLAM family markers resolve functionally distinct subpopulations of hematopoietic stem cells and multipotent progenitors. Cell Stem Cell 13, 102–116 (2013). [DOI] [PMC free article] [PubMed] [Google Scholar]
- 14.Ooi AG et al. The adhesion molecule esam1 is a novel hematopoietic stem cell marker. Stem Cells 27, 653–661 (2009). [DOI] [PMC free article] [PubMed] [Google Scholar]
- 15.Pietras EM et al. Functionally Distinct Subsets of Lineage-Biased Multipotent Progenitors Control Blood Production in Normal and Regenerative Conditions. Cell Stem Cell 17, 35–46 (2015). [DOI] [PMC free article] [PubMed] [Google Scholar]
- 16.Rodriguez-Fraticelli AE et al. Clonal analysis of lineage fate in native haematopoiesis. Nature 553, 212–216 (2018). [DOI] [PMC free article] [PubMed] [Google Scholar]
- 17.Wilson A et al. Hematopoietic stem cells reversibly switch from dormancy to self-renewal during homeostasis and repair. Cell 135, 1118–1129 (2008). [DOI] [PubMed] [Google Scholar]
- 18.Wilson NK et al. Combined Single-Cell Functional and Gene Expression Analysis Resolves Heterogeneity within Stem Cell Populations. Cell Stem Cell 16, 712–724 (2015). [DOI] [PMC free article] [PubMed] [Google Scholar]
- 19.Yamamoto R et al. Clonal analysis unveils self-renewing lineage-restricted progenitors generated directly from hematopoietic stem cells. Cell 154, 1112–1126 (2013). [DOI] [PubMed] [Google Scholar]
- 20.Yokota T et al. The endothelial antigen ESAM marks primitive hematopoietic progenitors throughout life in mice. Blood 113, 2914–2923 (2009). [DOI] [PMC free article] [PubMed] [Google Scholar]
- 21.Ng SY, Yoshida T, Zhang J & Georgopoulos K Genome-wide lineage-specific transcriptional networks underscore Ikaros-dependent lymphoid priming in hematopoietic stem cells. Immunity 30, 493–507 (2009). [DOI] [PMC free article] [PubMed] [Google Scholar]
- 22.Mansson R et al. Molecular evidence for hierarchical transcriptional lineage priming in fetal and adult stem cells and multipotent progenitors. Immunity 26, 407–419 (2007). [DOI] [PubMed] [Google Scholar]
- 23.Herman JS, Sagar & Grun D FateID infers cell fate bias in multipotent progenitors from single-cell RNA-seq data. Nat Methods 15, 379–386 (2018). [DOI] [PubMed] [Google Scholar]
- 24.Gilfillan S, Dierich A, Lemeur M, Benoist C & Mathis D Mice lacking TdT: mature animals with an immature lymphocyte repertoire. Science 261, 1175–1178 (1993). [DOI] [PubMed] [Google Scholar]
- 25.Alberti-Servera L et al. Single-cell RNA sequencing reveals developmental heterogeneity among early lymphoid progenitors. EMBO J 36, 3619–3633 (2017). [DOI] [PMC free article] [PubMed] [Google Scholar]
- 26.Balciunaite G, Ceredig R, Massa S & Rolink AG A B220+ CD117+ CD19- hematopoietic progenitor with potent lymphoid and myeloid developmental potential. Eur J Immunol 35, 2019–2030 (2005). [DOI] [PubMed] [Google Scholar]
- 27.Klein F et al. Accumulation of Multipotent Hematopoietic Progenitors in Peripheral Lymphoid Organs of Mice Over-expressing Interleukin-7 and Flt3-Ligand. Front Immunol 9, 2258 (2018). [DOI] [PMC free article] [PubMed] [Google Scholar]
- 28.Dress RJ et al. Plasmacytoid dendritic cells develop from Ly6D(+) lymphoid progenitors distinct from the myeloid lineage. Nat Immunol 20, 852–864 (2019). [DOI] [PubMed] [Google Scholar]
- 29.Rodrigues PF et al. Distinct progenitor lineages contribute to the heterogeneity of plasmacytoid dendritic cells. Nat Immunol 19, 711–722 (2018). [DOI] [PMC free article] [PubMed] [Google Scholar]
- 30.Stoeckius M et al. Simultaneous epitope and transcriptome measurement in single cells. Nat Methods 14, 865–868 (2017). [DOI] [PMC free article] [PubMed] [Google Scholar]
- 31.Melania Barile KB, Fanti Ann-Kathrin,Greco Alessandro,Wang Xi,, Oguro Hideyuki, Q.Z., Morrison Sean J., Rodewald Hans-Reimer, Thomas & Hofer. [Google Scholar]
- 32.Gazit R et al. Transcriptome analysis identifies regulators of hematopoietic stem and progenitor cells. Stem Cell Reports 1, 266–280 (2013). [DOI] [PMC free article] [PubMed] [Google Scholar]
- 33.Heng TS, Painter MW & Immunological Genome Project C The Immunological Genome Project: networks of gene expression in immune cells. Nat Immunol 9, 1091–1094 (2008). [DOI] [PubMed] [Google Scholar]
- 34.Carrelha J et al. Hierarchically related lineage-restricted fates of multipotent haematopoietic stem cells. Nature 554, 106–111 (2018). [DOI] [PubMed] [Google Scholar]
- 35.Mitjavila-Garcia MT et al. Expression of CD41 on hematopoietic progenitors derived from embryonic hematopoietic cells. Development 129, 2003–2013 (2002). [DOI] [PubMed] [Google Scholar]
- 36.Street K et al. Slingshot: cell lineage and pseudotime inference for single-cell transcriptomics. BMC Genomics 19, 477 (2018). [DOI] [PMC free article] [PubMed] [Google Scholar]
- 37.Ishibashi T et al. ESAM is a novel human hematopoietic stem cell marker associated with a subset of human leukemias. Exp Hematol 44, 269–281 e261 (2016). [DOI] [PubMed] [Google Scholar]
- 38.Sudo T et al. The endothelial antigen ESAM monitors hematopoietic stem cell status between quiescence and self-renewal. J Immunol 189, 200–210 (2012). [DOI] [PubMed] [Google Scholar]
- 39.Sun J et al. Clonal dynamics of native haematopoiesis. Nature 514, 322–327 (2014). [DOI] [PMC free article] [PubMed] [Google Scholar]
- 40.Busch K et al. Fundamental properties of unperturbed haematopoiesis from stem cells in vivo. Nature 518, 542–546 (2015). [DOI] [PubMed] [Google Scholar]
- 41.Sommerkamp P et al. Mouse multipotent progenitor 5 cells are located at the interphase between hematopoietic stem and progenitor cells. Blood 137, 3218–3224 (2021). [DOI] [PMC free article] [PubMed] [Google Scholar]
- 42.Pei W et al. Polylox barcoding reveals haematopoietic stem cell fates realized in vivo. Nature 548, 456–460 (2017). [DOI] [PMC free article] [PubMed] [Google Scholar]
- 43.Boyer SW, Schroeder AV, Smith-Berdan S & Forsberg EC All hematopoietic cells develop from hematopoietic stem cells through Flk2/Flt3-positive progenitor cells. Cell Stem Cell 9, 64–73 (2011). [DOI] [PMC free article] [PubMed] [Google Scholar]
- 44.Buza-Vidas N et al. FLT3 expression initiates in fully multipotent mouse hematopoietic progenitor cells. Blood 118, 1544–1548 (2011). [DOI] [PubMed] [Google Scholar]
- 45.Drexler HG, Sperling C & Ludwig WD Terminal deoxynucleotidyl transferase (TdT) expression in acute myeloid leukemia. Leukemia 7, 1142–1150 (1993). [PubMed] [Google Scholar]
- 46.Cuneo A et al. Clinical review on features and cytogenetic patterns in adult acute myeloid leukemia with lymphoid markers. Leuk Lymphoma 9, 285–291 (1993). [DOI] [PubMed] [Google Scholar]
- 47.Campagnari F, Bombardieri E, de Braud F, Baldini L & Maiolo AT Terminal deoxynucleotidyl transferase, TdT, as a marker for leukemia and lymphoma cells. Int J Biol Markers 2, 31–42 (1987). [DOI] [PubMed] [Google Scholar]
- 48.Srinivas S et al. Cre reporter strains produced by targeted insertion of EYFP and ECFP into the ROSA26 locus. BMC Dev Biol 1, 4 (2001). [DOI] [PMC free article] [PubMed] [Google Scholar]
- 49.Muzumdar MD, Tasic B, Miyamichi K, Li L & Luo L A global double-fluorescent Cre reporter mouse. Genesis 45, 593–605 (2007). [DOI] [PubMed] [Google Scholar]
- 50.Trichas G, Begbie J & Srinivas S Use of the viral 2A peptide for bicistronic expression in transgenic mice. BMC Biol 6, 40 (2008). [DOI] [PMC free article] [PubMed] [Google Scholar]
- 51.Jacobi AM et al. Simplified CRISPR tools for efficient genome editing and streamlined protocols for their delivery into mammalian cells and mouse zygotes. Methods 121–122, 16–28 (2017). [DOI] [PMC free article] [PubMed] [Google Scholar]
- 52.Haueter S et al. Genetic vasectomy-overexpression of Prm1-EGFP fusion protein in elongating spermatids causes dominant male sterility in mice. Genesis 48, 151–160 (2010). [DOI] [PMC free article] [PubMed] [Google Scholar]
- 53.Klein F et al. The transcription factor Duxbl mediates elimination of pre-T cells that fail beta-selection. J Exp Med 216, 638–655 (2019). [DOI] [PMC free article] [PubMed] [Google Scholar]
- 54.Pronk CJ et al. Elucidation of the phenotypic, functional, and molecular topography of a myeloerythroid progenitor cell hierarchy. Cell Stem Cell 1, 428–442 (2007). [DOI] [PubMed] [Google Scholar]
- 55.von Muenchow L et al. Permissive roles of cytokines interleukin-7 and Flt3 ligand in mouse B-cell lineage commitment. Proc Natl Acad Sci U S A 113, E8122–E8130 (2016). [DOI] [PMC free article] [PubMed] [Google Scholar]
- 56.Nakano T, Kodama H & Honjo T Generation of lymphohematopoietic cells from embryonic stem cells in culture. Science 265, 1098–1101 (1994). [DOI] [PubMed] [Google Scholar]
- 57.Dobin A et al. STAR: ultrafast universal RNA-seq aligner. Bioinformatics 29, 15–21 (2013). [DOI] [PMC free article] [PubMed] [Google Scholar]
- 58.Griffiths JA, Richard AC, Bach K, Lun ATL & Marioni JC Detection and removal of barcode swapping in single-cell RNA-seq data. Nat Commun 9, 2667 (2018). [DOI] [PMC free article] [PubMed] [Google Scholar]
- 59.Lun AT, Bach K & Marioni JC Pooling across cells to normalize single-cell RNA sequencing data with many zero counts. Genome Biol 17, 75 (2016). [DOI] [PMC free article] [PubMed] [Google Scholar]
- 60.McCarthy DJ, Campbell KR, Lun AT & Wills QF Scater: pre-processing, quality control, normalization and visualization of single-cell RNA-seq data in R. Bioinformatics 33, 1179–1186 (2017). [DOI] [PMC free article] [PubMed] [Google Scholar]
- 61.Hao Y et al. Integrated analysis of multimodal single-cell data. Cell 184, 3573–3587 e3529 (2021). [DOI] [PMC free article] [PubMed] [Google Scholar]
- 62.Murtagh FLP Ward’s Hierarchical Agglomerative Clustering Method: Which Algorithms Implement Ward’s Criterion?. Journal of Classification 31, 274–295 (2014). [Google Scholar]
- 63.Langfelder P, Zhang B & Horvath S Defining clusters from a hierarchical cluster tree: the Dynamic Tree Cut package for R. Bioinformatics 24, 719–720 (2008). [DOI] [PubMed] [Google Scholar]
- 64.Scialdone A et al. Computational assignment of cell-cycle stage from single-cell transcriptome data. Methods 85, 54–61 (2015). [DOI] [PubMed] [Google Scholar]
- 65.Aran D et al. Reference-based analysis of lung single-cell sequencing reveals a transitional profibrotic macrophage. Nat Immunol 20, 163–172 (2019). [DOI] [PMC free article] [PubMed] [Google Scholar]
- 66.Yoshida H et al. The cis-Regulatory Atlas of the Mouse Immune System. Cell 176, 897–912 e820 (2019). [DOI] [PMC free article] [PubMed] [Google Scholar]
- 67.Biddy BA et al. Single-cell mapping of lineage and identity in direct reprogramming. Nature 564, 219–224 (2018). [DOI] [PMC free article] [PubMed] [Google Scholar]
- 68.Dong F et al. Differentiation of transplanted haematopoietic stem cells tracked by single-cell transcriptomic analysis. Nat Cell Biol 22, 630–639 (2020). [DOI] [PubMed] [Google Scholar]
- 69.Rodriguez-Fraticelli AE et al. Single-cell lineage tracing unveils a role for TCF15 in haematopoiesis. Nature 583, 585–589 (2020). [DOI] [PMC free article] [PubMed] [Google Scholar]
- 70.Becht E et al. Dimensionality reduction for visualizing single-cell data using UMAP. Nat Biotechnol (2018). [DOI] [PubMed] [Google Scholar]
- 71.Saelens W, Cannoodt R, Todorov H & Saeys Y A comparison of single-cell trajectory inference methods. Nat Biotechnol 37, 547–554 (2019). [DOI] [PubMed] [Google Scholar]
- 72.Cao J et al. The single-cell transcriptional landscape of mammalian organogenesis. Nature 566, 496–502 (2019). [DOI] [PMC free article] [PubMed] [Google Scholar]
- 73.Stuart T et al. Comprehensive Integration of Single-Cell Data. Cell 177, 1888–1902 e1821 (2019). [DOI] [PMC free article] [PubMed] [Google Scholar]
Associated Data
This section collects any data citations, data availability statements, or supplementary materials included in this article.


