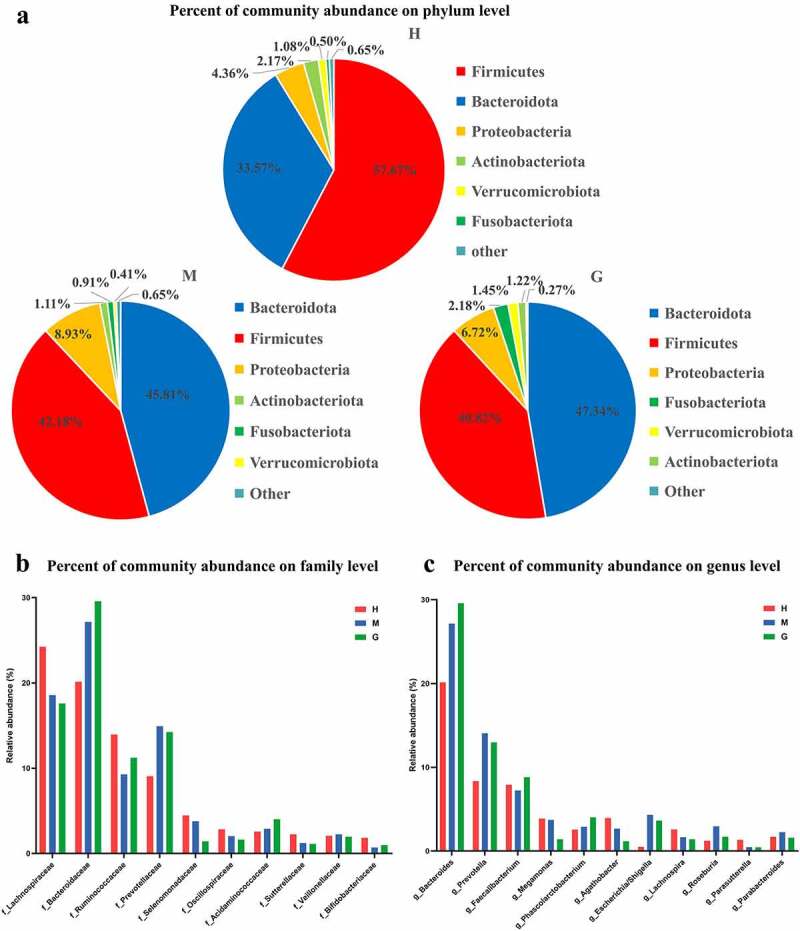
Figure 1.

The composition of intestinal flora and the comparison of microbial relative abundance. Pie chart of the dominant phylum-level intestinal flora in healthy subjects and patients with meningioma and glioma (a). The comparison of relative abundance of gut microbiome at the family level (b), and genus level (c) of the three groups. †H: healthy group. M: benign meningioma group. G: malignant glioma group.
