Abstract
Measuring cortisol levels as a stress biomarker is essential in many medical conditions associated with a high risk of metabolic syndromes such as anxiety and cardiovascular diseases, among others. One technology that has a growing interest in recent years is fiber optic biosensors that enable ultrasensitive cortisol detection. Such interest is allied with progress being achieved in basic interrogation, accuracy improvements, and novel applications. The development of improved cortisol monitoring, with a simplified manufacturing process, high reproducibility, and low cost, are challenges that these sensing mechanisms still face, and for which solutions are still needed. In this paper, a comprehensive characterization of a D-shaped fiber optic immunosensor for cortisol detection based on surface plasmon resonance (SPR) enabled by gold coating is reported. Specifically, the sensor instrumentation and fabrication processes are discussed in detail, and a simulation with its complete mathematical formalism is also presented. Moreover, experimental cortisol detection tests were performed for a detection range of 0.01 to 100 ng/mL, attaining a logarithmic sensitivity of 0.65 ± 0.02 nm/log(ng/mL) with a limit of detection (LOD) of 1.46 ng/mL. Additionally, an investigation of signal processing is also discussed, with the main issues addressed in order to highlight the best way to extract the sensing information from the spectra measured with a D-shaped sensor.
1. Introduction
Nowadays, daily lifestyle issues are the main reason for psychological stress. Several factors, such as globalization, changed lifestyles, competition, technological progress, among others, have significantly contributed to the increase in the level of psychological stress. This problem is becoming a serious concern that can affect individuals’ daily lives and their health. These challenges are being faced by the most developed countries, which leads to the increasing need for stress monitoring [1–4]. Nonetheless, stress is usually analyzed by applying questionnaires to patients, which can be unclear. Thus, currently, there is a difficulty related to stress diagnosis that is associated with the lack of quantitative parameters. Therefore, it is highly desirable to have a quantitative measurement of a stress biomarker to indicate abnormal stress states, if possible in a cheaply, easily and non invasive way.
The profound physiological stress consequences were empirically demonstrated for the first time by Hans Selye in 1936 [5]. Selye, after almost 40 years of overly productive research, declared: "Everybody knows what stress is and nobody knows what it is" [6], which demonstrates the dilemma in finding a definition for stress syndrome [6]. Nonetheless, pragmatic approaches define stress as a normal physiological and behavioral response to something that has happened or is about to happen and, in some way, disturbs the homeostasis of various physiological systems. Therefore, changes caused by stress range from behavioral to molecular adaptations [7]. Stress, physical injury, imminent danger, among others imply a large number of neuronal circuits, such as the prefrontal cortex, hippocampus, amygdala, septum, and hypothalamus, which results in the activation of the hypothalamic-pituitary-adrenocortical (HPA) axis and, in turn, in cortisol secretion. These multi-dynamic sets of processes are triggered to restore homeostasis.
Although cortisol is considered as the stress hormone, its abnormal secretion has a high impact on the immune, skeletal, cardiovascular, endocrine, and renal systems, as well as, on the metabolic levels of glucose, blood pressure, and carbohydrates [8]. Cortisol levels vary through a circadian rhythm over a 24-hour cycle, with higher levels occurring during dawn and lower levels during night-time sleep [9]. Blood cortisol levels present values of 50-250 ng/mL 30 minutes after waking up, and 30-130 ng/mL before bedtime [10,11]. Specifically, in sweat, a study showed that cortisol levels range from 8 ng/mL to 142 ng/mL, with the highest levels occurring in the morning and the lowest in the evening [12].
When cortisol values chronically fall outside the physiological range, some clinical conditions with great socio-economic importance, such as age-related cognitive decline, neurodegenerative diseases, cardiovascular disorders, diabetes, abdominal obesity, and mental health conditions are aggravated [7,13,14]. Besides biomedical purposes, cortisol is also considered an important stress biomarker in some marine biology applications. One example is in the field of aquaculture, where this hormone proved to be a reliable stress indicator in fishes. The assessment of the stress levels of fishes in aquaculture, directly in the water, is extremely important to understand the linking with growth, reproduction, the immune system, and the adequacy of fishes to the environment and water quality [15]. In the last decade, the production of aquaculture in intensive systems has increased rapidly, normally through recirculation aquaculture systems (RASs) with limited water exchange [16]. The RASs meet the European Union’s objectives for sustainable aquaculture, through food production and maintaining natural resources with minimal ecological impact [17].
However, RASs are complex systems in which fish’s biomass and water chemistry/quality interact and, thus, small variations can lead to non-ideal conditions, inducing stress, reducing food intake and growth performance, or can even conduct to mortality when high acute or chronic stress is present [18]. Therefore, critical parameters such as plasma cortisol need to be monitored to ensure the fish’s well-being. The traditional way to measure cortisol in fish is through blood collection and blood plasma analysis. However, this is an invasive method in which the results can be doubtful due to the stress caused by the measurement method itself [19,20]. On the other hand, an increase in the rate of cortisol released into the water in response to stress has been shown. Furthermore, this phenomenon has been correlated with plasma cortisol measurements, in which cortisol concentrations in water are significantly higher in groups with high fish density ( 3 ng/mL) than in groups with low density [19,20].
In both cases, cortisol levels can be measured by conventional laboratory techniques, but these are invasive, time consuming and require specialized people both to collect and transport the samples and to operate the complex equipment. To overcome these drawbacks, miniaturized biosensing devices capable of detecting and quantifying specific analytes are essential. The use of biosensors has advantages in point of care testing compared to traditional techniques. Regarding RASs, the monitoring of fish stress and the controlling of water quality are the key points for fish production with quality and promotion of fish well-being.
Focusing our attention on highly sensitive techniques for measuring physicochemical parameters, SPR is one that has attracted enormous attention over the last three decades. This technique enables a rapid and accurate optical detection of several parameters [21–23]. Specifically, when free electrons collectively oscillate in a metal, surface plasmons waves are created. These waves propagate along a dielectric-metal interface and can be excited by the evanescent waves generated from incident light. When the propagation constants (wave vector and frequency) of the evanescent waves are similar to those of the surface plasmons waves, the SPR phenomenon is triggered. This means that a strong absorption of light occurs and, the spectrum measured as a result of this process presents a sharp dip at a specific wavelength, typically denominated resonance wavelength. This resonance condition is highly sensitive to refractive index (RI) changes from the surrounding medium. As a result, these changes can be determined by analyzing the resonance condition [24], and robust sensor devices can be built from this SPR phenomenon.
Initially, the most used structure for SPR was the Kretschmann configuration, in which a prism with a high RI was coated with a metallic layer, allowing surface plasmons waves excitations by the evanescent wave of the prism, created from the total internal reflection. However, these planar SPR sensor devices were bulky and could not be applied in remote sensing. The emergence of optical fiber SPR has simplified and flexibilized optical design, enabling remote sensing, miniaturization, and in situ measurements [24]. Henceforth, optical fiber detection based on SPR has been the subject of study in a large number of investigations in different areas [25]. Several optical fiber configurations, like uncladded [26], D-shaped [27], U-bent [28], tapered [29], among others, with different plasmonic materials have been constantly studied to improve the performance and sensitivity of the optical fiber SPR sensors devices [30]. D-shaped fiber optic structures present advantages over uncladded and tapered configurations, including the need for less plasmonic material during deposition (is not necessary 2-step process involving a rotation of the samples) and easier deposition process. In addition, this structure is more robust than the tapered configuration. As plasmonic materials, most commercially available SPR sensors and those presented in the literature employ gold (Au) and/or silver (Ag). Nonetheless, Au presents better SPR performance and higher chemical stability, e.g. Ag tends to oxidize when exposed to air, which impairs its performance and contributes to a short lifespan [25].
In a previous work, we have tested a cortisol immunosensor [31]. This sensor device is based on SPR employing an unclad plastic optical fiber (POF) in which the SPR was used as sensitivity enhancer, promoted by a gold/palladium (AuPd) alloy coating. The AuPd coated fibers were functionalized with an anti-cortisol antibodies and passivated with bovine serum albumin (BSA) to be tested in the presence of cortisol as a target analyte. Although the sensor in this work has shown a very satisfactory result, the sensor device has some disadvantages. For example, the AuPd alloy makes the sensor device more expensive as well as the employed fiber has problems of sensitivity to moisture and issues in the manufacturing stage. Furthermore, reproducibility should also be improved.
In this context, and in order to promote a better understanding of the use of the SPR effect for the development of cortisol sensing devices, the present work aims to develop and characterize a fiber optic immunosensor with a D-shaped configuration for cortisol detection based on the SPR effect employing a pure gold coating. For this, we initially have experimentally characterized a silica optical fiber (SOF) to the surrounding RI using glucose solutions, and an optical characterization simulation was also performed. Afterward, Au functionalization with anti-cortisol antibodies was performed, using cysteamine as the intermediate linker. Then the functionalized immunosensors were tested for different cortisol concentrations ranging from 0.01 to 100 ng/ml. Subsequently, the biosensor response was studied by analyzing the SPR signature in the transmission spectra. In addition, control tests were performed with glucose and cholesterol as interferents to determine the specificity of the immunosensor. Furthermore, a section on signal processing is presented to compare the spectra obtained by processing the signals with a smooth filter or applying a Gaussian adjustment.
2. Materials and methods
2.1. Reagents
All reagents used in this work are listed below. Glucose (D-(+)-glucose 99.5%), cholesterol ( 99%), and cysteamine hydrochloride ( 98%) were purchased from Sigma-Aldrich, Germany. Cortisol, -(3-dimethylaminopropyl)- -ethylcarbodiimide hydrochloride (EDC), and -hydroxysuccinimide (NHS, 98%) were acquired from Merck, Germany. Phosphate buffer saline (PBS) tablets (pH = 7.4, 10 mM) was obtained from Fisher Bioreagents, USA. BSA was obtained from Alfa Aesar, USA. Also, anti-cortisol antibodies (500 g/mL) were acquired from antibodies-online GmbH, Germany. Throughout the work, deionized water was used and it was obtained from a Milli-Q water purification system.
2.2. D-shaped gold-coated silica optical fiber production
The D-shaped SOF consists of standard single-mode fiber (SMF28) acquired from Phoenix Photonics in the United Kingdom, fabricated by side polishing with insertion losses greater than 45 dB (typically 60 dB). This SOF presents a silica core doped with germanium, and a cladding constituted only by silica. The diameter of the SOF is 125 m with a core diameter of 9 m. The RI of the core is 1.47 and the cladding is 1.44. To develop a plasmonic D-shaped SOF, Au was deposited through sputtering technique. After the polishing, the remain cladding thickness is between 1 and 2 m. The attained length of the polished region is 10 mm with a tolerance less than 1 mm, in which 8 mm corresponds to the sensing region, and the remaining 2 mm is the taper. Regarding sputtering, the thin Au film, 50 nm thick, was deposited on one side of the fiber (in D-shape zone) by a sputter-coater (Leica EM SCD 500) under vacuum and argon. During the deposition, the thickness of the Au layer was monitored through the in-built quartz microbalance to ensure the desired coating thickness.
2.3. Instrumentation
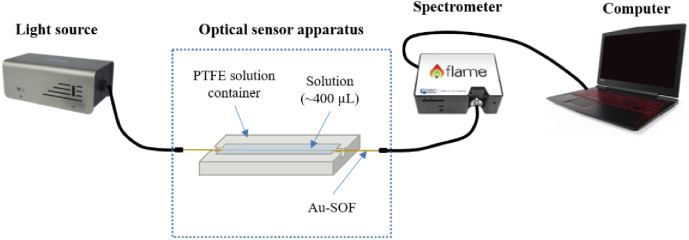
The experimental setup for the Au coated SOF (Au-SOF) sensor is schematically represented in Fig. 1. The Au-SOF sensor was placed in a small container constituted of polytetrafluoroethylene (PTFE) with dimensions of 32 5 3 mm and a volume capacity of 400 L. The sensor was connected to a light source (tungsten lamp, LS-W7 (7W), manufactured by Sarspec, Portugal), with an emission range from 380 nm to 2500 nm. The optical transmission spectra were acquired by a spectrometer (FLAME-T-UV-vis manufactured by Ocean Optics, USA) with a detection range of 180-890 nm and resolution of 0.19 nm, displayed on the computer using OceanView software provided by Ocean Optics. In this software, when the sensor was characterized to the RI, it was applied an integration time of 120 ms. Furthermore, the data were recorded and saved in the wavelength range of 200-890 nm. All experiments were conducted at a controlled temperature of C. Additionally, all the transmission spectra were normalized with the reference spectrum (air as the surrounding medium) and later filtered using a smooth filter to reduce noise. These steps were performed using MATLAB software. In the case of cortisol sensing tests, instead of 120 ms, it was applied an integration time of 240 ms.
Fig. 1.
Schematic representation of the experimental setup for the D-shaped fiber optic immunosensor for cortisol detection based on SPR.
2.4. Experimental optical characterization
Firstly, an Au-SOF was characterized to the surrounding RI. The Au-SOF was immersed in glucose solutions with different known RIs, which allowed to detect the changes in the spectral response for each solution. For that purpose, eight glucose concentrations were prepared with 0, 1, 5, 10, 20, 30, 40, 50% (w/v). To determine the RI of those solutions, it was used a refractometer (Abbemat 200, Anton Paar) at C, obtaining RI values of 1.333, 1.334, 1.340, 1.346, 1.358, 1.368, 1.377, and 1.386 RIU, respectively. Before spectra acquisition, the sensor was immersed for 2 minutes in each glucose concentration. The sensitivity of the sensor was obtained through the slope of the calibration plot [32]:
| (1) |
where corresponds to the variation in the resonance wavelength, and the variation in the refractive index.
2.5. Simulated optical characterization
Moreover, we have simulated the D-shaped Au-SOF sensor’s RI characterization using the COMSOL Multiphysics software package. For this, the Wave Optics Module was used, selecting the Frequency Domain and the Mode Analysis study. In the model, the geometry of the fiber was established creating two concentric circles representing cladding and core with a radius of 62.5 m and 4.1 m, respectively. Next, it was necessary to specify the RI of the core and cladding. As already known, the RI of the materials varies with the wavelength due to the dispersion effects [33]. As a result, the RIs of the fiber were calculated through the Sellmeier equation. The core of a SOF is doped with a fraction of GeO to generate a higher RI compared with the RI of the cladding. In this way, the Sellmeier equation for the core is given by [33]:
| (2) |
where , , , and are the Sellmeier coefficients for the and , respectively, is the mole fraction of , and is the wavelength. This general type of model has been used by others on several binary glass systems [34,35]. Furthermore, the RI of the cladding, which is not doped with Ge may be obtained by (2) with = 0. The different Sellmeier coefficients employed for the RI calculation of core and cladding of SOF are displayed in Table 1 [33].
Table 1. Sellmeier coefficients for and .
| 0.69616630 | 0.80686642 | |
| 0.06840430 | 0.06897260 | |
| 0.40794260 | 0.71815848 | |
| 0.11624140 | 0.15396605 | |
| 0.89747940 | 0.85416831 | |
| 9.89616100 | 11.8419310 |
The fraction of is unknown, and to estimate its value, several values of were tested until obtaining an mode-field diameter (MFD) of 10.5 m for 1550 nm, as indicated in the fiber data sheet. The selected fraction of was 0.0305. To obtain the MFD throughout this process, firstly, the effective area was calculated employing the following equation [36]:
| (3) |
where the is the modulus of the fundamental mode electric field attained through COMSOL. Finally, the MFD was determined employing the calculated effective area through the following equation [37]:
| (4) |
Importantly, the main domain was meshed so that it was divided into smaller subdomains with different sizes. The finer mesh subdomains are present near the interfaces between distinct mediums. This is required to compensate the accentuated variations in the electromagnetic field. After this process, a D-shape structure was designed. For that, part of the cladding circle was cut to the core. An Au layer was created in the D-shape zone with a thickness of 50 nm. All the mentioned parameters were inserted in our simulation model according to the fibers that were used in the experimental tests. Also, to determine the RI of the Au layer, was employed a COMSOL library [38], which is the most applied in optical fiber simulations.
In order to characterize the Au-SOF immunosensor to the external RI, a circular domain was created around the D-shape structure with a radius of 63 m. In this layer, eight different RI values were inserted. Specifically: 1.333, 1.334, 1.340, 1.346, 1.358, 1.368, 1.377, and 1.386, corresponding to glucose concentrations with 0, 1, 5, 10, 20, 30, 40, 50% (w/v). Several modes were searched around the RI of the core, and the one consistent with SPR modes, having an effective respective index with larger imaginary part, was selected. To obtain a transmission spectra, a parametric sweep ranging from 570 to 760 nm was run. Afterwards, the loss coefficient of the mode was calculated using [32]:
| (5) |
where is the wavelength, is the wavenumber in vacuum, and the imaginary part of the SPR mode. Then, the transmittance defined as the ratio of the transmitted intensity, , over the incident intensity, , can be written as:
| (6) |
with the length of the D-shape region.
2.6. Gold coated silica optical fiber functionalization
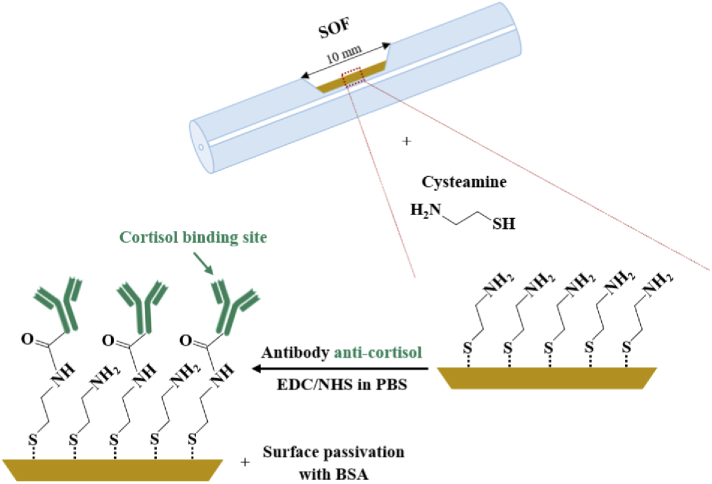
In this stage, four D-shaped Au-SOFs were functionalized with anti-cortisol antibodies using the same protocol for all of them, adapted from [31]. The physicochemical interaction of Au and sulfur is well known to be very strong and, consequently, many approaches take advantage of this process using thiol derivatives, like the use of cysteamine as an intermediary linker. In this way, antibodies were covalently bonded to the amine-terminated thiol, which is the case of cysteamine, through EDC/NHS chemistry. Figure 2 illustrates the biofunctionalization process performed on the Au-SOF biosensor device.
Fig. 2.
Scheme of optical fiber functionalization steps.
Specifically, the fibers were firstly positioned in a PTFE container and washed three times with deionized water and PBS. Afterwards, the Au-SOFs were immersed overnight in 400 L of an aqueous solution of cysteamine (20 mM) prepared from cysteamine hydrochloride to create amine groups on the surface of the fibers. To remove the unbounded cysteamine, the fibers were washed three times with deionized water, before being immersed in PBS. Subsequently, the Au-SOFs were functionalized with anti-cortisol antibodies. For that, the fibers were immersed for 2 hours in a fresh mixture of 200 L of antibody solution (500 g/mL), 100 L of EDC (0.2 M), and 100 L of NHS (0.5 M), all prepared in PBS. Then, the fibers were washed three times with PBS to removed unbounded antibodies and the surface of the fibers was passivated using BSA solution (400 L, 10 g/mL) for 2 hours. The BSA was used to passivate the surface to prevent from non-specific bindings. Lastly, the washing process took place 3 times with PBS.
2.7. Cortisol detection
After the functionalization process, four immunosensors were tested using different cortisol concentrations to evaluate the sensor performance. From a cortisol stock solution, 5 concentrations were prepared in PBS, specifically, 0.01, 0.1, 1, 10, and 100 ng/mL. To guarantee the formation of the antibody-antigen complex, the immunosensor was immersed in each cortisol solution (400 L) in ascending order for 20 minutes. After each cortisol solution, the fibers were washed three times with PBS and the transmission optical spectrum was acquired while the fibers immersed in PBS. Furthermore, each concentration of cortisol was maintained in contact with the immunosensor for 20 minutes since this time is sufficient to reach the equilibrium of the cortisol-antibody reaction [31].
2.8. Control test
In order to evaluate the specificity of our immunosensor, a control test was carried out. For this, an Au-SOF was also functionalized with anti-cortisol antibodies, following the same process as described in section II-F, and tested for glucose (50 mg/dL and 500 mg/dL) and cholesterol (170 mg/dL and 240 mg/dL). The immunosensor was immersed in each concentration of interferent for 20 minutes (400 L). First, the two glucose concentration were tested, followed by the cholesterol ones. Moreover, the concentrations were tested in ascending order. It is important to emphasize here that glucose and cholesterol were used to perform control tests since they are present in the human body, including blood and sweat, in the same way as cortisol. Nonetheless, glucose and total cholesterol levels considered normal for a healthy person should range between, approximately, 60 to 109 mg/dL and below 200 mg/dL, respectively [39].
3. Results and discussion
3.1. Experimental and simulated optical characterization
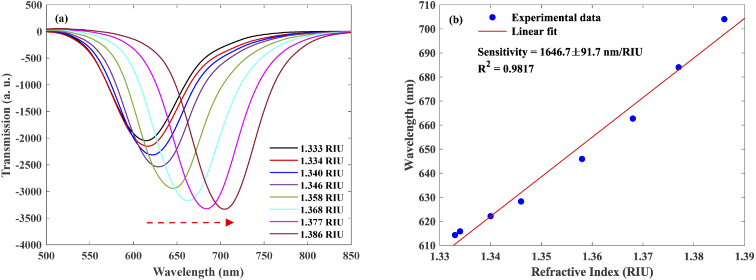
Initially, a sensor was immersed in solutions with different glucose concentrations in order to evaluate the performance of our sensor to the RI changes. Figure 3(a) displays the spectral wavelength responses as function of the RI. As it can be observed, a shift to longer wavelengths is noticeable with the increasing of glucose concentration. Hence, these wavelength shifts were used to evaluate the sensitivity of the proposed sensing mechanism. The Au-SOF resonance wavelength changed from 614.31 nm to 704.05 nm which corresponds to a total redshift of 89.74 nm. As represented in Fig. 3(b), the Au-SOF presented an of 0.9817 and a sensitivity of 1646.7 91.7 nm/RIU.
Fig. 3.
(a) Transmission spectra recorded for glucose solutions in a concentration range from 0 to 50%. (b) Resonance wavelength variation as a function of RI.
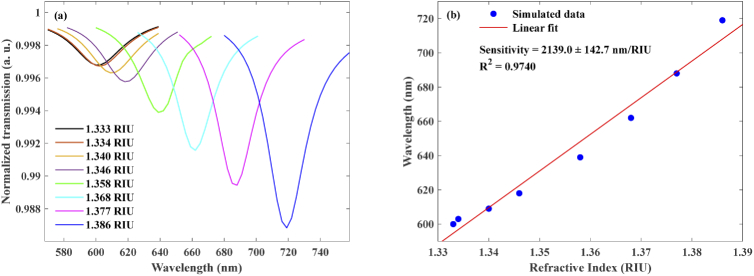
To simulate the characterization of the Au-SOF SPR-based RI sensor, it was necessary to select the SPR core mode for each wavelength according the section 2.5. Figure 4 displays the mode profile simulated corresponding to the SPR phenomenon. In Fig. 5(a) is possible to observe a continuous increase in the spectral wavelength with increasing of the RI. In order to calculate the sensitivity of the simulated sensor to RI, the minimum of each transmission spectrum (SPR wavelength) was saved considering equation (6). Figure 5(b) shows the change in these resonance wavelengths as a function of the variation in the RI, in which the total redshift from 600.00 to 719.00 nm was 119.00 nm. A linear fit was also performed, and a determination coefficient of 0.9740 and sensitivity of 2139.0 142.7 nm/RIU were achieved by our simulation.
Fig. 4.
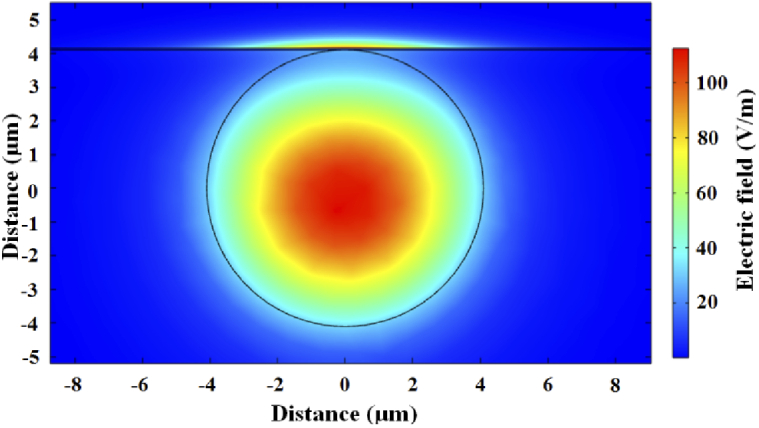
Simulated SPR mode profile.
Fig. 5.
(a) Transmission spectra simulated for glucose solutions with RI ranging from 1.333 to 1.386 in Au-SOF. (b) Resonance wavelength variation as a function of RI.
The sensitivity obtained through simulation (Fig. 5) is higher compared to the experimental one ( see Fig. 3). In the same way, the total redshift also presented a higher value. These discrepancies may be related to the fact that, in our simulation, the fiber parameters used may have been slightly different from the real values. For instance, there may be slight differences in core radius, RIs, and Au layer thickness, which may imply a distinction between the calculated modes and the real ones. Also, the lowest sensitivity obtained experimentally may be related to the fact that the Au layer may not be completely homogeneous along the entire surface of the D-shape region. Another issue that can be associated with the experimental investigation refers to the fact that the light passes through the fiber, and when entering the D-shape zone presents an adjustment distance to the new geometry, in which there may be some light losses without being related to the losses in the Au layer. This effect was not considered in our simulations.
3.2. Cortisol monitoring
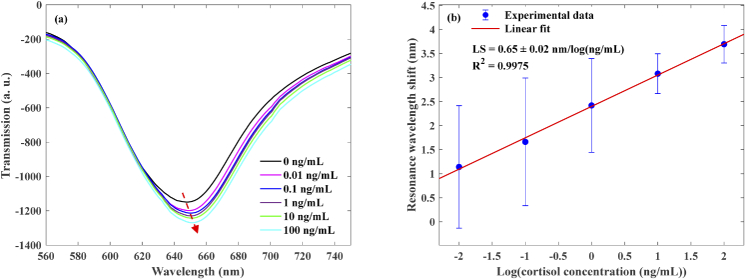
After the biofunctionalization procedure, Au-SOFs were tested with different cortisol concentrations, and the respective transmission spectra were acquired as shown in Fig. 6(a). This Fig. 6(a) exhibits the results for one of the four assays with Au-SOF, where is possible to observe a redshift to longer SPR wavelengths. To analyze the responses of the four immunosensors, the wavelength shift was calculated by subtracting the SPR wavelength at 0 ng/mL from the SPR wavelength at a given cortisol concentration, being the SPR wavelengths the minimum of the transmission spectra, and, then, the average of the SPR wavelengths was taken. Also, the spectra were smoothed by applying a filter in MATLAB software for noise removal. The Au-SOF presented a logarithmic response to the cortisol concentration ranging from 0.01 to 100 ng/mL with an value of 0.9975 as shown in Fig. 6(b). Moreover, the total redshift was 3.70 0.39 nm, and the achieved logarithmic sensitivity (LS - SPR wavelength shift per unit change in the logarithm cortisol concentration) was 0.65 0.02 nm/log(ng/mL). The standard deviation in resonance wavelength was calculated for each concentration since the experiments were performed on 4 different immunosensors. As implied by the error bars shown in Fig. 6(b), from 10 ng/mL the standard deviations are lower, indicating that the reproducibility for these cortisol concentrations (higher than 1 ng/mL) may be promising for the next works in progress. Thus, it is a good indicator for aquaculture field, specifically, for RASs systems with high fish density ( 3 ng/mL) [20]. From the analysis of the error bars, the low reproducibility for lower concentrations may be related to the polishing depth applied to the fibers. In more detail the polishing depth can be slightly different between sensors causing them to have vaguely different responses.
Fig. 6.
(a) Spectral responses of an functionalized Au-SOF immunosensor acquired in PBS as a response for cortisol solutions in a concentration range from 0.01 to 100 ng/mL, after incubation of 20 min. (b) SPR signature wavelength shift as a function of the logarithm of cortisol concentration (results for quadruplicates are presented).
3.3. Control test
An Au-SOF sensor was tested for glucose and cholesterol interferents in order to evaluate their selectivity. Figure 7 shows the histogram comparison of the resonance wavelength shift as a function of different cortisol, glucose, and cholesterol concentrations. It can be observed that the maximum resonance wavelength shift was approximately 3.70 nm when using cortisol. In general, the Au-SOF sensor responded to glucose and cholesterol concentrations, with the SPR wavelength shifting to lower values at all interferent molecules concentrations except for 50 mg/dL of glucose, for which the shift is similar to the resolution of the spectrometer and no conclusions can be drawn. The negative response probably occurred due to the interaction of BSA with glucose and cholesterol and its removal from the surface, leading to a decrease in the surrounding RI and, consequently, to a shift in the resonance wavelength to lower values. The limit of detection was 1.46 ng/mL, calculated through a conservative approach, given mathematically by [40]:
| (7) |
being the control analyte responses, is the average value, and its standard deviation. In addition, it is also intended to perform control tests with other interferents when new tests are performed with real samples (sweat or saliva; and fish water).
Fig. 7.
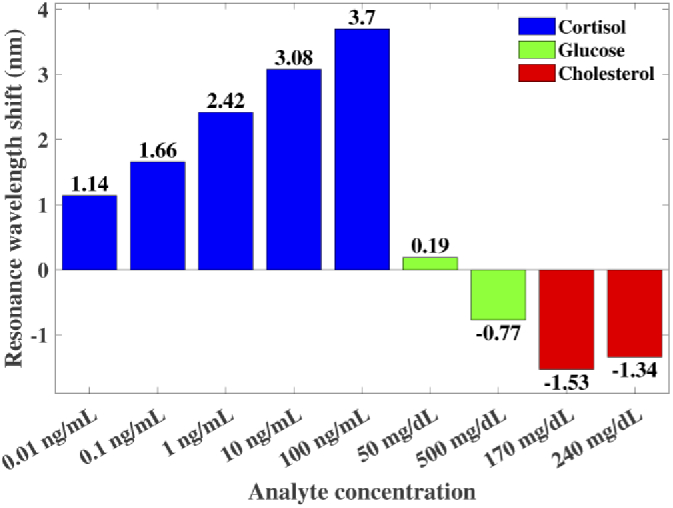
Histogram of the resonance wavelength shift as a function of different cortisol, glucose, and cholesterol concentrations.
3.4. Signal processing investigation
Different approaches have been applied for removing noise from biosensors, namely, polarimetry-based methods for main instrumental noises in phase-sensitive SPR measurements [41], optimization of the signal-to-noise ratio (SNR) using carbon nanotube transistors [42], application of temporal averaging [43], envelope detection approaches [44], using alternating current measurement with a lock-in amplifier [45], and application of a two-stage adaptive algorithm [46]. In this section, we present some results of investigations of the application of a filtering process and a Gaussian fitting as potential alternatives to process the signals generated by our biosensor. Initially, a moving average filter with several and different span values was applied to reduce signal noise. This filter smooths data by replacing each data point with the average of the neighboring data points defined within the span. This process is equivalent to lowpass filtering with the response of the smoothing given by the equation [47]:
| (8) |
where is the smoothed value for the ith data point, is the number of neighboring data points on either side of , and is the span. This filter was adopted in our investigation as it allows reducing random noise while retaining a sharp step response [47]. Figure 8 shows the raw spectrum and the same transmission spectrum after smoothing with different span values. The modification of the spectra is evident when using different smooths. For lower values, the spectrum does not reveal a well-defined minimum, being this phenomenon visible for higher smooth values such as 0.07 and 0.1. When higher span values are applied, like 0.2, there is an expressive modification of the spectrum, which makes it impossible to be analyzed since there is a very significant difference compared to the raw spectrum.
Fig. 8.
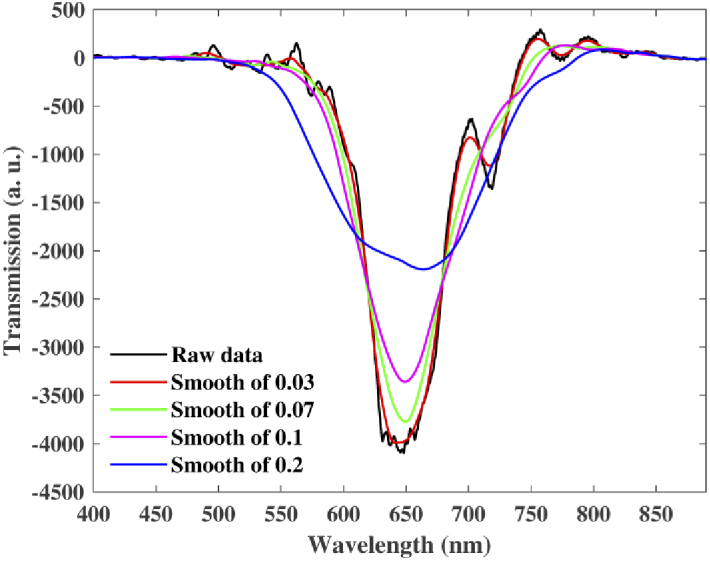
Raw spectrum and smoothed transmission spectra for different span values.
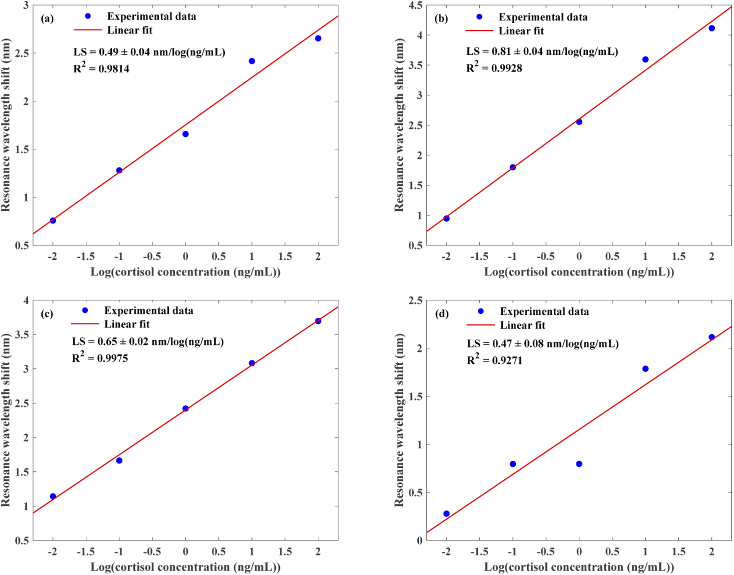
Moreover, for different smooth values, a change in terms of sensitivity and coefficient of determination is visible. Comparing the results for the smooth values of 0.03, 0.07, and 0.1, it is observed, in Fig. 9(a), that the sensitivity for 0.03 is 0.49 0.04 nm/log(ng/mL), which is lower than the others. The sensitivity for 0.07 (Fig. 9(b)) and 0.1 (Fig. 9(c)) are, respectively, 0.81 0.04 nm/log(ng/ml) and 0.65 0.02 nm/log(ng/ml), with a greater sensitivity at 0.07. However, for 0.1 the is higher comparing with the of 0.07, leading to the conclusion that the results show a better logarithmic fit when using a smooth with a span of 0.1. In addition, the LOD turned out to be 2.19 ng/mL by smoothing data with 0.07, which is higher than the LOD attained when using a smooth value of 0.1 (1.46 ng/mL). This is a disadvantage when using 0.07. In the case of smooth with a span of 0.2 (Fig. 9(d)), both the sensitivity and are clearly degraded, with values of 0.47 0.08 nm/log(ng/mL) and 0.9271, respectively. Among all, the most suitable approach to remove noise is to perform a smoothing with a span of 0.1.
Fig. 9.
SPR signature wavelength shift as a function of the logarithm of cortisol concentration corresponding to smooth span values of (a) 0.03, (b) 0.07, (c) 0.1, and (d) 0.2. (Note: Results for quadruplicates are presented).
Another method that was performed to obtain the best possible data treatment was applying a Gaussian fit described by [48]:
| (9) |
where is the amplitude, is the centroid (location), is related to the peak (in our case a dip) width, and is the number of Gaussian functions employed to represent a specific transmission spectrum. To represent a transmission spectrum as a Gaussian function, a system with nonlinear equations by the nonlinear least-squares method has to be solved. To solve these equations, the Trust-region algorithm was adopted [49]. It can solve nonlinear problems more efficiently than other algorithms, and it represents an improvement over the popular Levenberg-Marquart algorithm [50] because it delivers a significantly faster performance in batch while obtaining solutions of comparable quality. Also, Gaussian peaks are encountered in many areas of science and engineering. For example, Gaussian peaks can describe line emission spectra and chemical concentration assays [51–53]. Particularly, the SPR signature has a well-defined dip in a Gaussian format, and for this reason, this type of adjustment in the presented analysis was adopted.
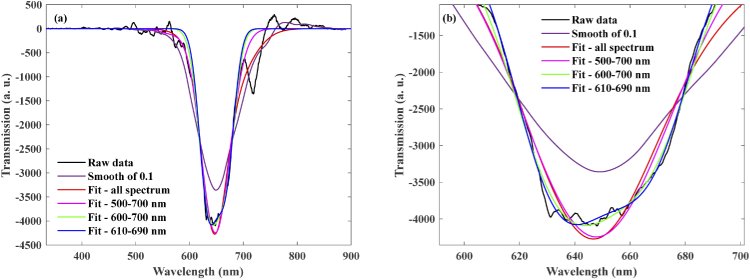
Figure 10(a) depicts the raw spectrum, the spectrum filtered using 0.1 smooth, and some Gaussian fittings performed for different wavelength ranges: entire range, 500 to 700 nm, 600 to 700 nm, and 610 to 690 nm. It can be seen that the range to which the filter is applied has a lot of influence on the shape and position of the final spectrum (see Fig. 10(b)) and, consequently, on the determined resonance wavelength. Specifically, in this example, it can be seen that the spectra obtained after the Gaussian fit for a more restricted range are shifted compared to the Gaussian fit applied to the entire spectrum and, therefore, the SPR wavelengths are distinct. Depending on the chosen wavelength ranges to process the data, the fitted spectra can present different shifts, for both longer and shorter wavelength values. In this way, to achieve a more reliable processed spectrum, the signals must be processed considering the entire range of values. When using smaller ranges, the final results may not correspond to the true sensor response.
Fig. 10.
Representation of raw spectrum, smoothed spectrum using span 0.1, and Gaussian fittings performed for different wavelength ranges. (a) Spectra with full range. (b) Magnified view of spectra around the dip.
After carrying out a Gaussian fitting considering the entire range of the signal values, Fig. 11 shows the graph of the resonance wavelength shift as a function of the logarithm of cortisol concentration. Comparing with Fig. 9(c) corresponding to smooth 0.1, despite the sensitivity being slightly higher, has a considerably lower value which suggests a substandard logarithmic fit when using a Gaussian fitting approach. Furthermore, a higher uncertainty is observable, leading to the conclusion that the standard deviations associated with each cortisol concentration are higher in general and, consequently, the reproducibility is poor. In addition, if a comparison between Fig. 9(b) (smooth span of 0.07) and Fig. 11 is made, it is concluded that Gaussian fitting produces a lower performance as well. Thus, all these conclusions show that the Gaussian fitting may not be an adequate alternative to process the SPR signature of biosensors. Therefore, the results suggest that the most adequate approach to remove noise in the transmission spectra generated by the SPR signature is to perform a smoothing process.
Fig. 11.
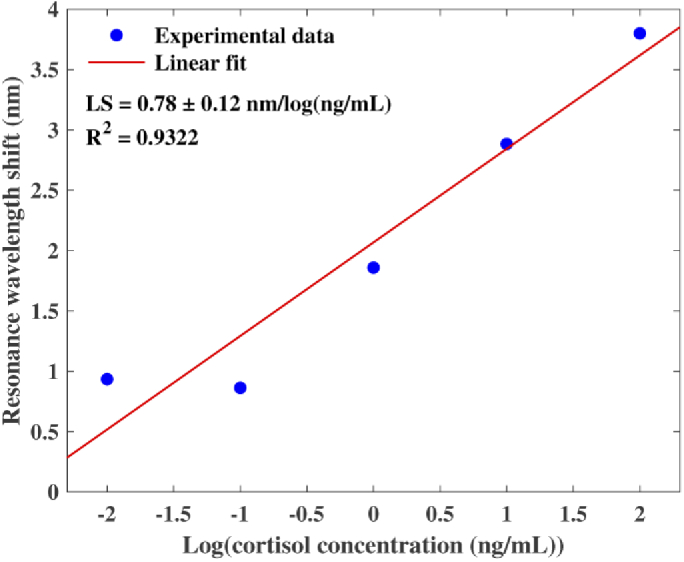
SPR signature wavelength shift as a function of the logarithm of cortisol concentration corresponding to a full spectrum processed with a Gaussian fitting. (Note: Results for quadruplicates are presented).
4. Conclusion
The aim of this study consisted in the development of an SPR-based Au-SOF immunosensor capable of detecting cortisol levels as stress biomarker. The immunosensor was built having a D-shape structure and coated with a gold film to enable the triggering of the SPR phenomenon. Initially, an optical characterization of this sensor device for different RI values was simulated and performed experimentally, in which it was possible to obtain sensitivities with in the same order of magnitude. In the biofunctionalization procedure, it was employed cysteamine as the intermediary linker to allow a stronger immobilization of the anti-cortisol antibodies, and the final sensor device was passivated with BSA. With this sensing mechanism, it was possible to achieve a sensitivity of 0.65 0.02 nm/log(ng/mL) and a limit of detection of 1.46 ng/mL. Moreover, reasonable reproducibility for cortisol concentrations above 1 ng/mL was attained however, more tests are in progress to check the reproducibility performance for particular concentrations range above 1 ng/mL. The limit of detection and these concentrations are compatible with the concentration range of biomedical and biological samples, such as human blood (50-250 ng/mL after walking, and 30-130 ng/mL before bedtime), sweat (from 8 ng/mL to 142 ng/mL), and water from aquaculture tanks (3 ng/mL for high fish density) envisaging the fish stress monitoring. When performing the signal processing step, it is necessary to be especially prudent in selecting the used approach, since the results can be significantly modified according to the method and the ranges that are chosen. Among the signal processing methods discussed, smoothing data with a span value of 0.1 turned out to be the most adequate approach to remove noise in the transmission spectra.
Funding
Fundação de Amparo à Pesquisa e Inovação do Espírito Santo10.13039/501100006182 (CPID-ELEM - 013/2022); Fundação para a Ciência e a Tecnologia10.13039/501100001871 (UIDB/50025/2020, UIDP/50025/2020, LA/P/0037/202, PTDC/EEI-EEE/0415/2021, CEECIND/00034/2018, CEECIND/00154/2020, BPD/UI96/5808/2017, BPD/UI96/5177/2020, UI/BD/153066/2022.
Disclosures
The authors declare no conflicts of interest.
Data availability
Data underlying the results presented in this paper are not publicly available at this time but may be obtained from the authors upon reasonable request.
References
- 1.Li P., Huang J., Wu H., Fu C., Li Y., Qiu J., “Impact of lifestyle and psychological stress on the development of early onset breast cancer,” Medicine 95(50), e5529 (2016). 10.1097/MD.0000000000005529 [DOI] [PMC free article] [PubMed] [Google Scholar]
- 2.Rosiek A., Rosiek-Kryszewska A., Leksowski Ł., Leksowski K., “Chronic stress and suicidal thinking among medical students,” Int. J. Environ. Res. Public Health 13(2), 212 (2016). 10.3390/ijerph13020212 [DOI] [PMC free article] [PubMed] [Google Scholar]
- 3.Serafini G., Parmigiani B., Amerio A., Aguglia A., Sher L., Amore M., “The psychological impact of COVID-19 on the mental health in the general population,” QJM: An International Journal of Medicine 113(8), 531–537 (2020). 10.1093/qjmed/hcaa201 [DOI] [PMC free article] [PubMed] [Google Scholar]
- 4.Lazarus R. S., “Psychological stress in the workplace,” in Occupational Stress (CRC Press, 2020), pp. 3–14. [Google Scholar]
- 5.Selye H., “A syndrome produced by diverse nocuous agents,” Nature 138(3479), 32 (1936). 10.1038/138032a0 [DOI] [PubMed] [Google Scholar]
- 6.Selye H., “The evolution of the stress concept: The originator of the concept traces its development from the discovery in 1936 of the alarm reaction to modern therapeutic applications of syntoxic and catatoxic hormones,” Am. Sci. 61(6), 692–699 (1973). [PubMed] [Google Scholar]
- 7.Holsboer F., Ising M., “Stress hormone regulation: biological role and translation into therapy,” Annu. Rev. Psychol. 61(1), 81–109 (2010). 10.1146/annurev.psych.093008.100321 [DOI] [PubMed] [Google Scholar]
- 8.Usha S. P., Shrivastav A. M., Gupta B. D., “A contemporary approach for design and characterization of fiber-optic-cortisol sensor tailoring LMR and Zno/PPY molecularly imprinted film,” Biosens. Bioelectron. 87, 178–186 (2017). 10.1016/j.bios.2016.08.040 [DOI] [PubMed] [Google Scholar]
- 9.Pinto V., Sousa P., Catarino S. O., Correia-Neves M., Minas G., “Microfluidic immunosensor for rapid and highly-sensitive salivary cortisol quantification,” Biosens. Bioelectron. 90, 308–313 (2017). 10.1016/j.bios.2016.11.067 [DOI] [PubMed] [Google Scholar]
- 10.Dalirirad S., Steckl A. J., “Aptamer-based lateral flow assay for point of care cortisol detection in sweat,” Sensors and Actuators B: Chemical 283, 79–86 (2019). 10.1016/j.snb.2018.11.161 [DOI] [Google Scholar]
- 11.Wright Jr K. P., Drake A. L., Frey D. J., Fleshner M., Desouza C. A., Gronfier C., Czeisler C. A., “Influence of sleep deprivation and circadian misalignment on cortisol, inflammatory markers, and cytokine balance,” Brain, Behav., Immun. 47, 24–34 (2015). 10.1016/j.bbi.2015.01.004 [DOI] [PMC free article] [PubMed] [Google Scholar]
- 12.Russell E., Koren G., Rieder M., Van Uum S. H., “The detection of cortisol in human sweat: implications for measurement of cortisol in hair,” Ther. Drug Monit. 36(1), 30–34 (2014). 10.1097/FTD.0b013e31829daa0a [DOI] [PubMed] [Google Scholar]
- 13.Ouanes S., Popp J., “High cortisol and the risk of dementia and Alzheimer’s disease: a review of the literature,” Front. Aging Neurosci. 11, 1–11 (2019). 10.3389/fnagi.2019.00043 [DOI] [PMC free article] [PubMed] [Google Scholar]
- 14.Choi W., Kang H.-J., Kim J.-W., Kim H. K., Kang H.-C., Lee J.-Y., Kim S.-W., Stewart R., Kim J.-M., “Associations of serum cortisol levels, stress perception, and stressful events with suicidal behaviors in patients with depressive disorders,” J. Affective Disord. 297, 602–609 (2022). 10.1016/j.jad.2021.10.054 [DOI] [PubMed] [Google Scholar]
- 15.Sadoul B., Geffroy B., “Measuring cortisol, the major stress hormone in fishes,” Journal of Fish Biology 94(4), 540–555 (2019). 10.1111/jfb.13904 [DOI] [PubMed] [Google Scholar]
- 16.Silva L. C., Lopes B., Pontes M. J., Blanquet I., Segatto M. E., Marques C., “Fast decision-making tool for monitoring recirculation aquaculture systems based on a multivariate statistical analysis,” Aquaculture 530, 735931 (2021). 10.1016/j.aquaculture.2020.735931 [DOI] [Google Scholar]
- 17.Piedrahita R. H., “Reducing the potential environmental impact of tank aquaculture effluents through intensification and recirculation,” Aquaculture 226(1-4), 35–44 (2003). 10.1016/S0044-8486(03)00465-4 [DOI] [Google Scholar]
- 18.Ogawa K., Ito F., Nagae M., Nishimura T., Yamaguchi M., Ishimatsu A., “Effects of acid stress on reproductive functions in immature carp, Cyprinus carpio,” Water, Air, and Soil Pollution 130(1/4), 887–892 (2001). 10.1023/A:1013803517375 [DOI] [Google Scholar]
- 19.Fanouraki E., Papandroulakis N., Ellis T., Mylonas C., Scott A., Pavlidis M., “Water cortisol is a reliable indicator of stress in European sea bass, Dicentrarchus labrax,” Behaviour 145(10), 1267–1281 (2008). 10.1163/156853908785765818 [DOI] [Google Scholar]
- 20.Mota V. C., Martins C. I., Eding E. H., Canário A. V., Verreth J. A., “Steroids accumulate in the rearing water of commercial recirculating aquaculture systems,” Aquacultural engineering 62, 9–16 (2014). 10.1016/j.aquaeng.2014.07.004 [DOI] [Google Scholar]
- 21.Prabowo B. A., Purwidyantri A., Liu K.-C., “Surface plasmon resonance optical sensor: a review on light source technology,” Biosensors 8(3), 80 (2018). 10.3390/bios8030080 [DOI] [PMC free article] [PubMed] [Google Scholar]
- 22.Jing J.-Y., Wang Q., Zhao W.-M., Wang B.-T., “Long-range surface plasmon resonance and its sensing applications: a review,” Optics and Lasers in Engineering 112, 103–118 (2019). 10.1016/j.optlaseng.2018.09.013 [DOI] [Google Scholar]
- 23.Wang B., Park B., “Immunoassay biosensing of foodborne pathogens with surface plasmon resonance imaging: a review,” J. Agric. Food Chem. 68(46), 12927–12939 (2020). 10.1021/acs.jafc.0c02295 [DOI] [PubMed] [Google Scholar]
- 24.Shukla S., Sharma N. K., Sajal V., “Sensitivity enhancement of a surface plasmon resonance based fiber optic sensor using ZnO thin film: a theoretical study,” Sensors and Actuators B: Chemical 206, 463–470 (2015). 10.1016/j.snb.2014.09.083 [DOI] [Google Scholar]
- 25.Soares M. S., Vidal M., Santos N. F., Costa F. M., Marques C., Pereira S. O., Lei nao C., “Immunosensing based on optical fiber technology: recent advances,” Biosensors 11(9), 305 (2021). 10.3390/bios11090305 [DOI] [PMC free article] [PubMed] [Google Scholar]
- 26.Verma R., Gupta B. D., “Fiber optic SPR sensor for the detection of 3-pyridinecarboxamide (vitamin B3) using molecularly imprinted hydrogel,” Sensors and Actuators B: Chemical 177, 279–285 (2013). 10.1016/j.snb.2012.10.135 [DOI] [Google Scholar]
- 27.Gong Z., Xiang Z., OuYang X., Zhang J., Lau N., Zhou J., Chan C. C., “Wearable fiber optic technology based on smart textile: a review,” Materials 12(20), 3311 (2019). 10.3390/ma12203311 [DOI] [PMC free article] [PubMed] [Google Scholar]
- 28.Christopher C., Subrahmanyam A., Sai V., “Gold sputtered U-bent plastic optical fiber probes as SPR-and LSPR-based compact plasmonic sensors,” Plasmonics 13(2), 493–502 (2018). 10.1007/s11468-017-0535-z [DOI] [Google Scholar]
- 29.Cennamo N., Arcadio F., Minardo A., Montemurro D., Zeni L., “Experimental characterization of plasmonic sensors based on lab-built tapered plastic optical fibers,” Appl. Sci. 10(12), 4389 (2020). 10.3390/app10124389 [DOI] [Google Scholar]
- 30.Zhao Y., Tong R.-j., Xia F., Peng Y., “Current status of optical fiber biosensor based on surface plasmon resonance,” Biosens. Bioelectron. 142, 111505 (2019). 10.1016/j.bios.2019.111505 [DOI] [PubMed] [Google Scholar]
- 31.Leitñao C., Leal-Junior A., Almeida A. R., Pereira S. O., Costa F. M., Pinto J. L., Marques C., “Cortisol AuPd plasmonic unclad POF biosensor,” Biotechnology Reports 29, 1–6 (2021). 10.1016/j.btre.2021.e00587 [DOI] [PMC free article] [PubMed] [Google Scholar]
- 32.Gong W., Jiang S., Li Z., Li C., Xu J., Pan J., Huo Y., Man B., Liu A., Zhang C., “Experimental and theoretical investigation for surface plasmon resonance biosensor based on graphene/Au film/D-POF,” Opt. Express 27(3), 3483–3495 (2019). 10.1364/OE.27.003483 [DOI] [PubMed] [Google Scholar]
- 33.Fleming J. W., “Dispersion in GeO2-SiO2 glasses,” Appl. Opt. 23(24), 4486–4493 (1984). 10.1364/AO.23.004486 [DOI] [PubMed] [Google Scholar]
- 34.Wemple S., Pinnow D. A., Rich T., Jaeger R., Van Uitert L., “Binary SiO2-B2O3 glass system: refractive index behavior and energy gap considerations,” J. Appl. Phys. 44(12), 5432–5437 (1973). 10.1063/1.1662170 [DOI] [Google Scholar]
- 35.Hammond C., “Silica-based binary glass systems: wavelength dispersive properties and composition in optical fibres,” Opt. Quantum Electron. 10(2), 163–170 (1978). 10.1007/BF00620007 [DOI] [Google Scholar]
- 36.Rukhlenko I. D., Premaratne M., Agrawal G. P., “Effective mode area and its optimization in silicon-nanocrystal waveguides,” Opt. Lett. 37(12), 2295–2297 (2012). 10.1364/OL.37.002295 [DOI] [PubMed] [Google Scholar]
- 37.Namihira Y., “Relationship between nonlinear effective area and modefield diameter for dispersion shifted fibres,” Electron. Lett. 30(3), 262–264 (1994). 10.1049/el:19940149 [DOI] [Google Scholar]
- 38.Johnson P. B., Christy R.-W., “Optical constants of the noble metals,” Phys. Rev. B 6(12), 4370–4379 (1972). 10.1103/PhysRevB.6.4370 [DOI] [Google Scholar]
- 39.Mach F., Baigent C., Catapano A. L., Koskinas K. C., Casula M., Badimon L., Chapman J. M., “2019 ESC/EAS Guidelines for the management of dyslipidaemias: lipid modification to reduce cardiovascular risk: The task Force for the management of dyslipidaemias of the European Society of Cardiology (ESC) and European Atherosclerosis Society (EAS),” Eur. Heart J. 41(1), 111–188 (2020). 10.1093/eurheartj/ehz455 [DOI] [PubMed] [Google Scholar]
- 40.Shrivastava A., Gupta V. B., “Methods for the determination of limit of detection and limit of quantitation of the analytical methods,” Chronicles of young scientists 2(1), 21–25 (2011). 10.4103/2229-5186.79345 [DOI] [Google Scholar]
- 41.Patskovsky S., Meunier M., Prasad P. N., Kabashin A. V., “Self-noise-filtering phase-sensitive surface plasmon resonance biosensing,” Opt. Express 18(14), 14353–14358 (2010). 10.1364/OE.18.014353 [DOI] [PubMed] [Google Scholar]
- 42.Heller I., Mannik J., Lemay S. G., Dekker C., “Optimizing the signal-to-noise ratio for biosensing with carbon nanotube transistors,” Nano Lett. 9(1), 377–382 (2009). 10.1021/nl8031636 [DOI] [PubMed] [Google Scholar]
- 43.Tan Y., Chu A., Lu M., Cunningham B. T., “Distributed feedback laser biosensor noise reduction,” IEEE Sens. J. 13(5), 1972–1978 (2013). 10.1109/JSEN.2013.2244591 [DOI] [Google Scholar]
- 44.Leitñao C., Pereira S. O., Alberto N., Lobry M., Loyez M., Costa F. M., Pinto J. L., Caucheteur C., Marques C., “Cortisol in-fiber ultrasensitive plasmonic immunosensing,” IEEE Sens. J. 21(3), 3028–3034 (2020). 10.1109/JSEN.2020.3025456 [DOI] [Google Scholar]
- 45.Yamamoto Y., Ohno Y., Maehashi K., Matsumoto K., “Noise reduction of carbon nanotube field-effect transistor biosensors by alternating current measurement,” Jpn. J. Appl. Phys. 48(6), 06FJ01 (2009). 10.1143/JJAP.48.06FJ01 [DOI] [Google Scholar]
- 46.Yousefi R., Nourani M., Ostadabbas S., Panahi I., “A motion-tolerant adaptive algorithm for wearable photoplethysmographic biosensors,” IEEE journal of biomedical and health informatics 18(2), 670–681 (2013). 10.1109/JBHI.2013.2264358 [DOI] [PubMed] [Google Scholar]
- 47.Smith S., Digital Signal Processing: A Practical Guide for Engineers and Scientists (Elsevier, 2013). [Google Scholar]
- 48.Goshtasby A., Oneill W. D., “Curve fitting by a sum of Gaussians,” CVGIP: Graphical Models and Image Processing 56, 281–288 (1994). [Google Scholar]
- 49.Moré J. J., Sorensen D. C., “Computing a trust region step,” SIAM Journal on Scientific and Statistical Computing 4(3), 553–572 (1983). 10.1137/0904038 [DOI] [Google Scholar]
- 50.Moré J. J., “The levenberg-Marquardt algorithm: implementation and theory,” in Numerical analysis , (Springer, 1978), pp. 105–116. [Google Scholar]
- 51.Balena A., Perulli A., Fernandez M., De Giorgi M. L., Nedelcu G., Kovalenko M. V., Anni M., “Temperature dependence of the amplified spontaneous emission from CsPbBr3 nanocrystal thin films,” The Journal of Physical Chemistry C 122(10), 5813–5819 (2018). 10.1021/acs.jpcc.8b01419 [DOI] [Google Scholar]
- 52.Shi L., Han Y.-j., Wang H.-x., Shi D.-c., Geng X.-y., Zhang Z.-w., “High-efficiency and thermally stable far-red emission of Mn4± in double cubic perovskite Sr9Y2W4O24 for plant cultivation,” J. Lumin. 208, 307–312 (2019). 10.1016/j.jlumin.2018.12.065 [DOI] [Google Scholar]
- 53.Zhao M., Liao H., Molokeev M. S., Zhou Y., Zhang Q., Liu Q., Xia Z., “Emerging ultra-narrow-band cyan-emitting phosphor for white LEDs with enhanced color rendition,” Light: Science & Applications 8(1), 38 (2019). 10.1038/s41377-019-0148-8 [DOI] [PMC free article] [PubMed] [Google Scholar]
Associated Data
This section collects any data citations, data availability statements, or supplementary materials included in this article.
Data Availability Statement
Data underlying the results presented in this paper are not publicly available at this time but may be obtained from the authors upon reasonable request.


