Abstract
Non-genetic mechanisms have recently emerged as important drivers of cancer therapy failure1, where some cancer cells can enter a reversible drug-tolerant persister state in response to treatment2. While most cancer persisters remain arrested in the presence of drug, a rare subset can re-enter the cell cycle under constitutive drug treatment. Little is known about the non-genetic mechanisms that enable cancer persisters to maintain proliferative capacity in the presence of drug. To study this rare, transiently-resistant, proliferative persister population, we developed Watermelon, a high-complexity expressed barcode lentiviral library for simultaneous tracing of each cell’s clonal origin and proliferative and transcriptional states. Here we show that cycling and non-cycling persisters arise from different cell lineages with distinct transcriptional and metabolic programs. Upregulation of antioxidant gene programs and a metabolic shift to fatty acid oxidation are associated with persister proliferative capacity across multiple cancer types. Impeding oxidative stress or metabolic reprogramming significantly alters the fraction of cycling persisters. In human tumours, programs associated with cycling persisters are induced in minimal residual disease in response to multiple targeted therapies. The Watermelon system enabled the identification of rare persister lineages that are preferentially poised to proliferate under drug pressure, thus exposing new vulnerabilities that can be targeted to delay or even prevent disease recurrence.
To characterize the proliferative dynamics of persisters, we studied the response of PC9 lung cancer cells, which carry an oncogenic mutation in the epidermal growth factor receptor (EGFR), to osimertinib, a third-generation EGFR tyrosine kinase inhibitor. We treated the cells at Emax concentration (300nM) (Extended Data Fig. 1a) and used live-cell imaging to quantify the number and timing of division events over the course of treatment, as cells either underwent cell death, arrested, or formed visible colonies (Fig. 1a). To ensure that cells from colony forming lineages are not over-represented in our analysis, we tracked only one cell of each lineage (Methods and Extended Data Fig. 1b).
Figure 1. Persister cells contain a rare proliferative subpopulation.
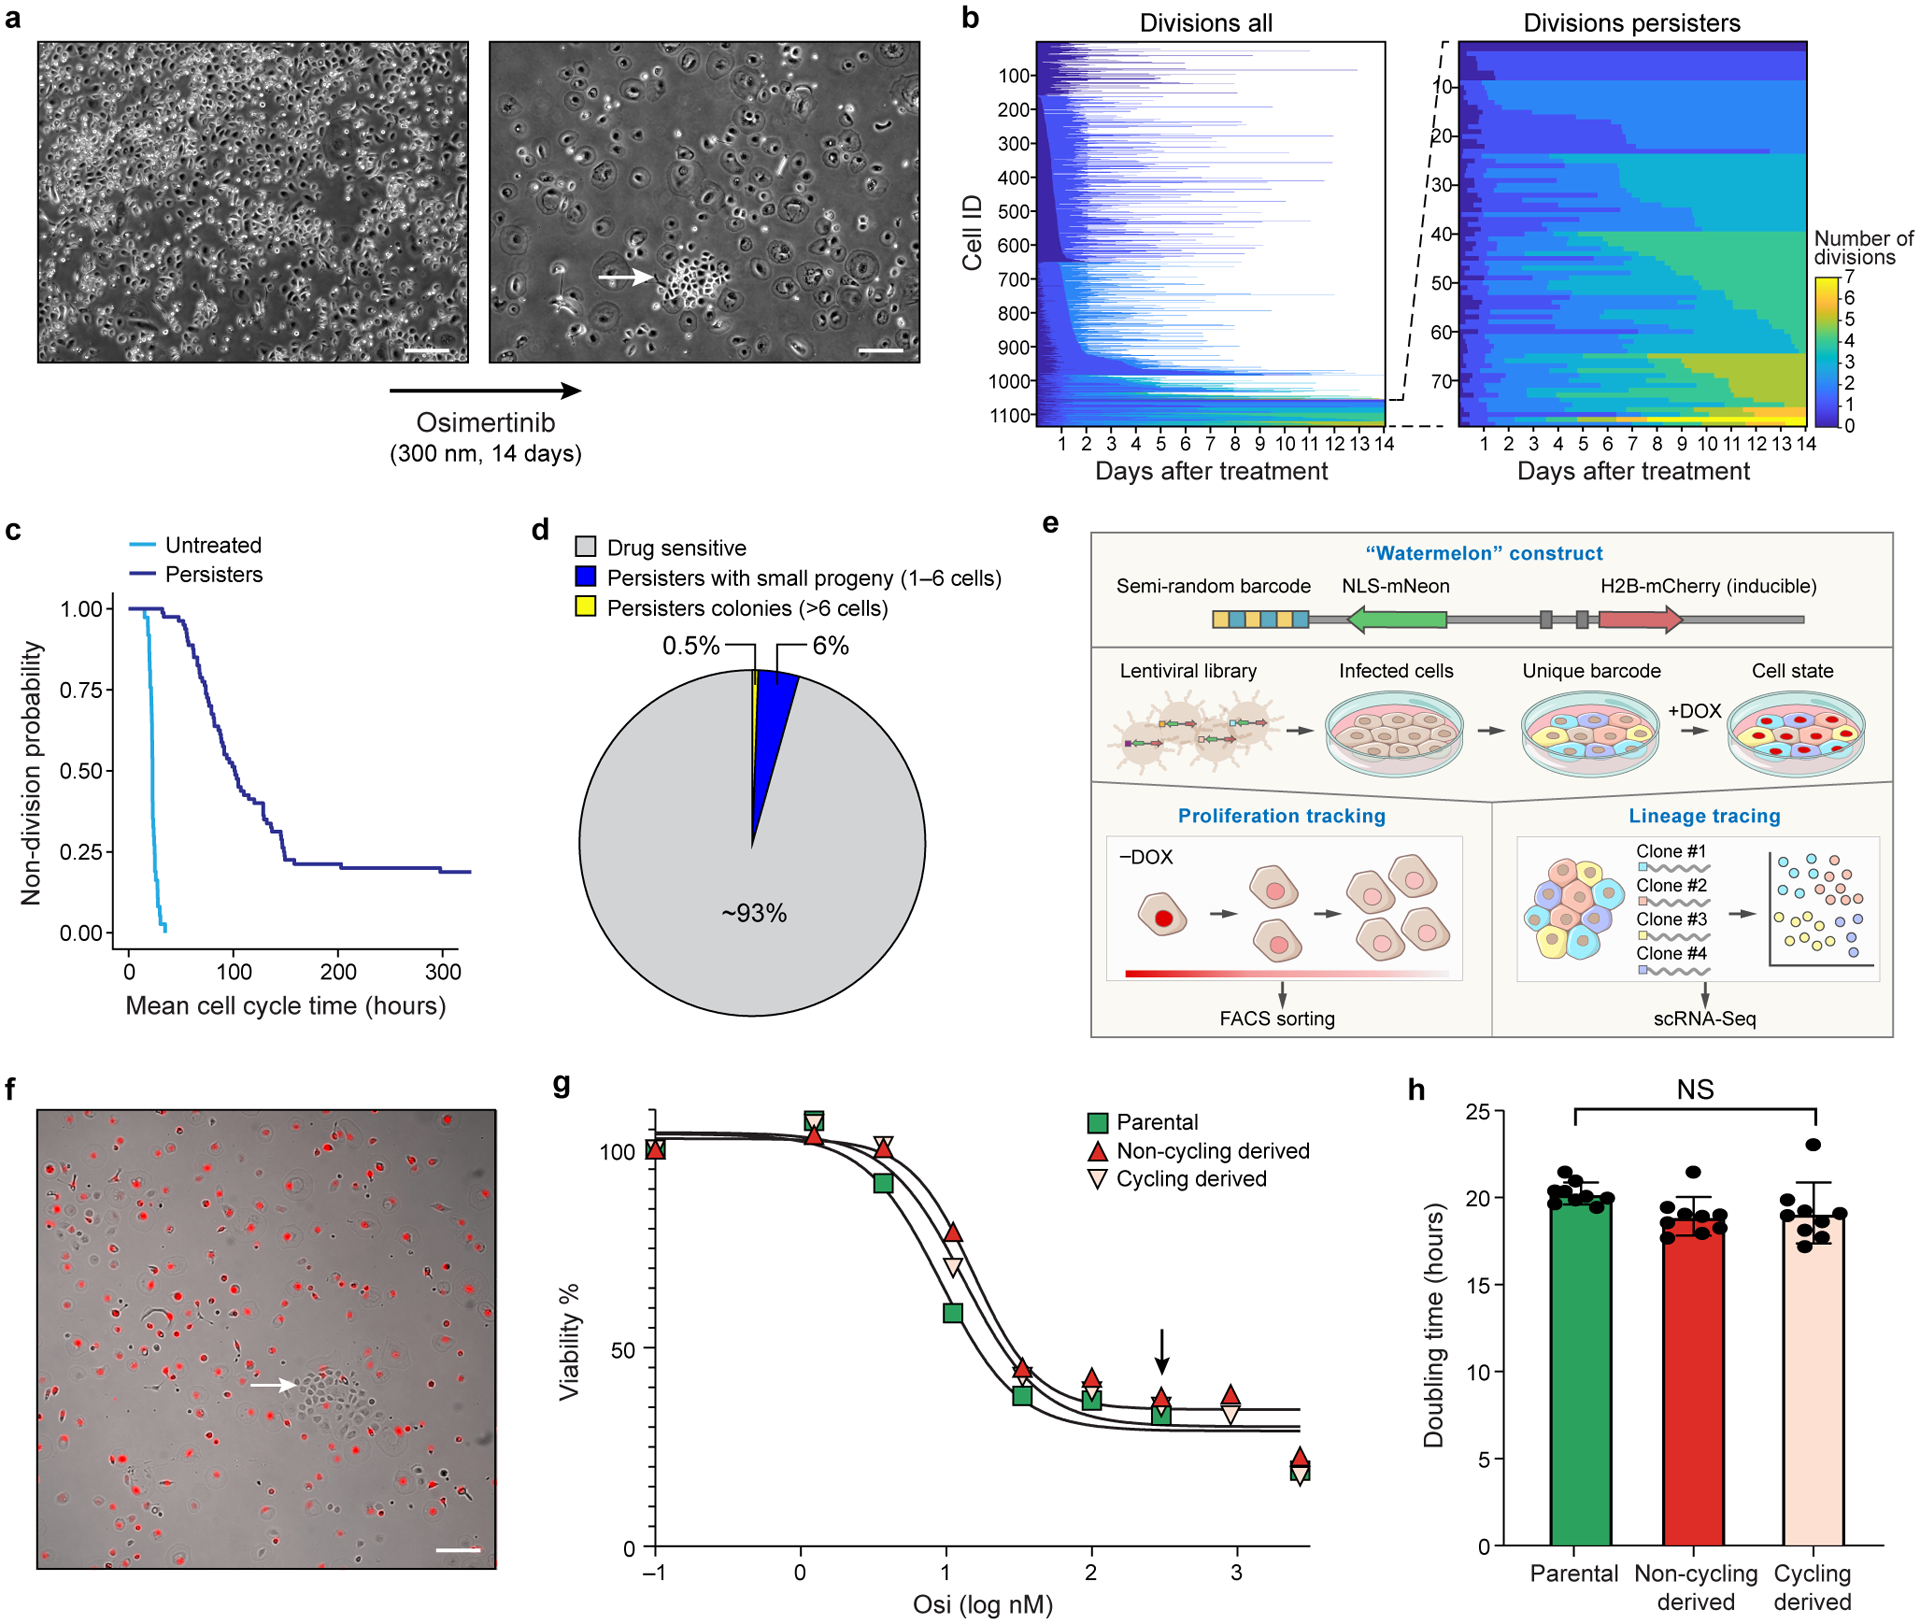
a. Representative phase contrast images of a colony of PC9 cells before (left) and after (right) 14 days of 300 nM osimertinib treatment (Methods). Arrow: A colony of cycling persisters. Scale bar 100 μm. b. Left: Number of cell divisions (colorbar) for each of 1,135 individual PC9 cell lineages (rows, left) or only for 77 persister lineages (rows, right) tracked by live imaging of a 14-day osimertinib treatment (x axis). White: lineage perished. c. Distribution of mean cell cycle time (y axis) of untreated and persister cell lineages (x axis) from live cell imaging tracking data. d. Proportion of lineages with a large (>6 cells; yellow) or small (1–6 cells, blue) number of progeny or with no progeny (drug sensitive, grey) at endpoint (14-day osimertinib treatment). e,f. The Watermelon system. e. Watermelon vector. Semi-random barcode linked to the NLS-mNeon gene allows for lineage tracing. The doxycycline inducible H2B-mCherry facilitates proliferation tracking via fluorescent dilution. f. Merged fluorescence (red) and phase contrast of Watermelon-PC9 persister cells following 14-day osimertinib treatment during which dox was included for the first 3 days. Arrowhead: colony of cycling persisters. Scale bar 100 μm. g. Percent of viable cells (y axis) from populations derived from parental (green), cycling persister (pink) and non-cycling persister (red) cells treated with the indicated concentrations of osimertinib (x axis) for 72hr (Methods). Black arrow: concentration used for establishing persister cells (300nM). h. Mean doubling time (y axis) in populations derived from parental (green), cycling persister (pink) and non-cycling persister (red) cells, grown in drug free media. Error bars are mean +/− SD of three biologically independent experiments. NS, not significant (P > 0.05); two-tailed t-tests. Images a and f are representative of three independent experiments.
Only 8% of cell lineages gave rise to persisters, defined as cells that were alive at day 14 of drug treatment (Fig. 1b). Cell division profiles of persisters revealed extensive heterogeneity, from persisters that did not divide at all to those that underwent seven divisions (Fig. 1b). This was in contrast to the untreated parental cell population in which all cells underwent cell division (Fig. 1c). In line with previous reports that colony-forming persisters are rare3,4, less than 0.5% of the initial cell population (13% of the persister population) gave rise to multi-cellular persister colonies of more than six cells (Fig. 1d). Thus, persister cells contain a rare proliferative subpopulation that emerges early in the course of drug treatment.
The Watermelon system
Identifying mechanisms that allow cells to survive drug treatment and regain proliferative capacity requires measuring the cellular and molecular properties of these rare cells prior to and during drug treatment. To this end, we developed Watermelon, a high complexity lentiviral barcode library, with both green and red fluorescent reporters, for simultaneous tracing of clonal lineages as well as the transcriptional and proliferative state of each cell in the population. We achieved lineage tracing by mapping a clone-specific expressed DNA barcode in the 3′ untranslated region of an mNeonGreen protein, and monitored proliferation history by the dilution of a doxycycline (dox)-inducible H2B-mCherry transgene (Fig. 1e and Extended Data Fig. 1c–f). We generated a Watermelon library of more than five million barcodes and used it to transduce 10,000 PC9 cells with a Multiplicity of Infection (MOI) of less than 0.3 to minimize barcode overlap between clones (Methods).
We tested whether proliferative persisters arise due to a stable, intrinsically lower sensitivity to EGFR inhibition by comparing the osimertinib sensitivity of cycling and non-cycling persister-derived populations following a short re-sensitization period. We treated Watermelon-PC9 cells with osimertinib for 14 days, with doxycycline (dox) added to the media for the first three days, followed by 11 days of dox chase, during which mCherry was diluted only in proliferating cells, sorted cycling and non-cycling persister cells of day 14 (Fig. 1f), and propagated each subset in drug-free media for 20 additional passages. Both cycling and non-cycling persister populations reacquired drug sensitivity rapidly, suggesting that a reversible, rather than a genetic mutational mechanism underlies the ability to cycle under continuous drug treatment (Fig. 1g). Furthermore, cells derived from persister-cycling and persister-non-cycling subpopulations had similar population doubling times, suggesting that the drug-observed phenotypic differences are not due to pre-existing proliferative heterogeneity (Fig. 1h).
To identify mechanisms underlying the ability of persister cells to proliferate, we profiled the expression of 56,419 individual Watermelon-PC9 persister cells by scRNA-seq, at four time points (days 0, 3, 7 and 14) along 14 days of osimertinib treatment (Fig. 2a and Extended Data Fig. 2a-c). On day 14, we sorted persister cells by mCherry expression into three sets: cycling (mCherrylow), moderately cycling (mCherrymedium) and non-cycling (mCherryhigh) persisters, and profiled each of these by scRNA-seq separately. We used published signatures5 to assign each cell to a specific cell cycle phase (Fig. 2b), ascribed cells to lineages based on the expressed barcodes detected by scRNA-seq (Fig. 2c and Extended Data Fig. 2d, Methods), and related cells by their profiles using a force-directed layout embedding (FLE) (Fig. 2d).
Figure 2. Cycling and non-cycling persisters arise from different cell lineages that express distinct transcriptional programs.
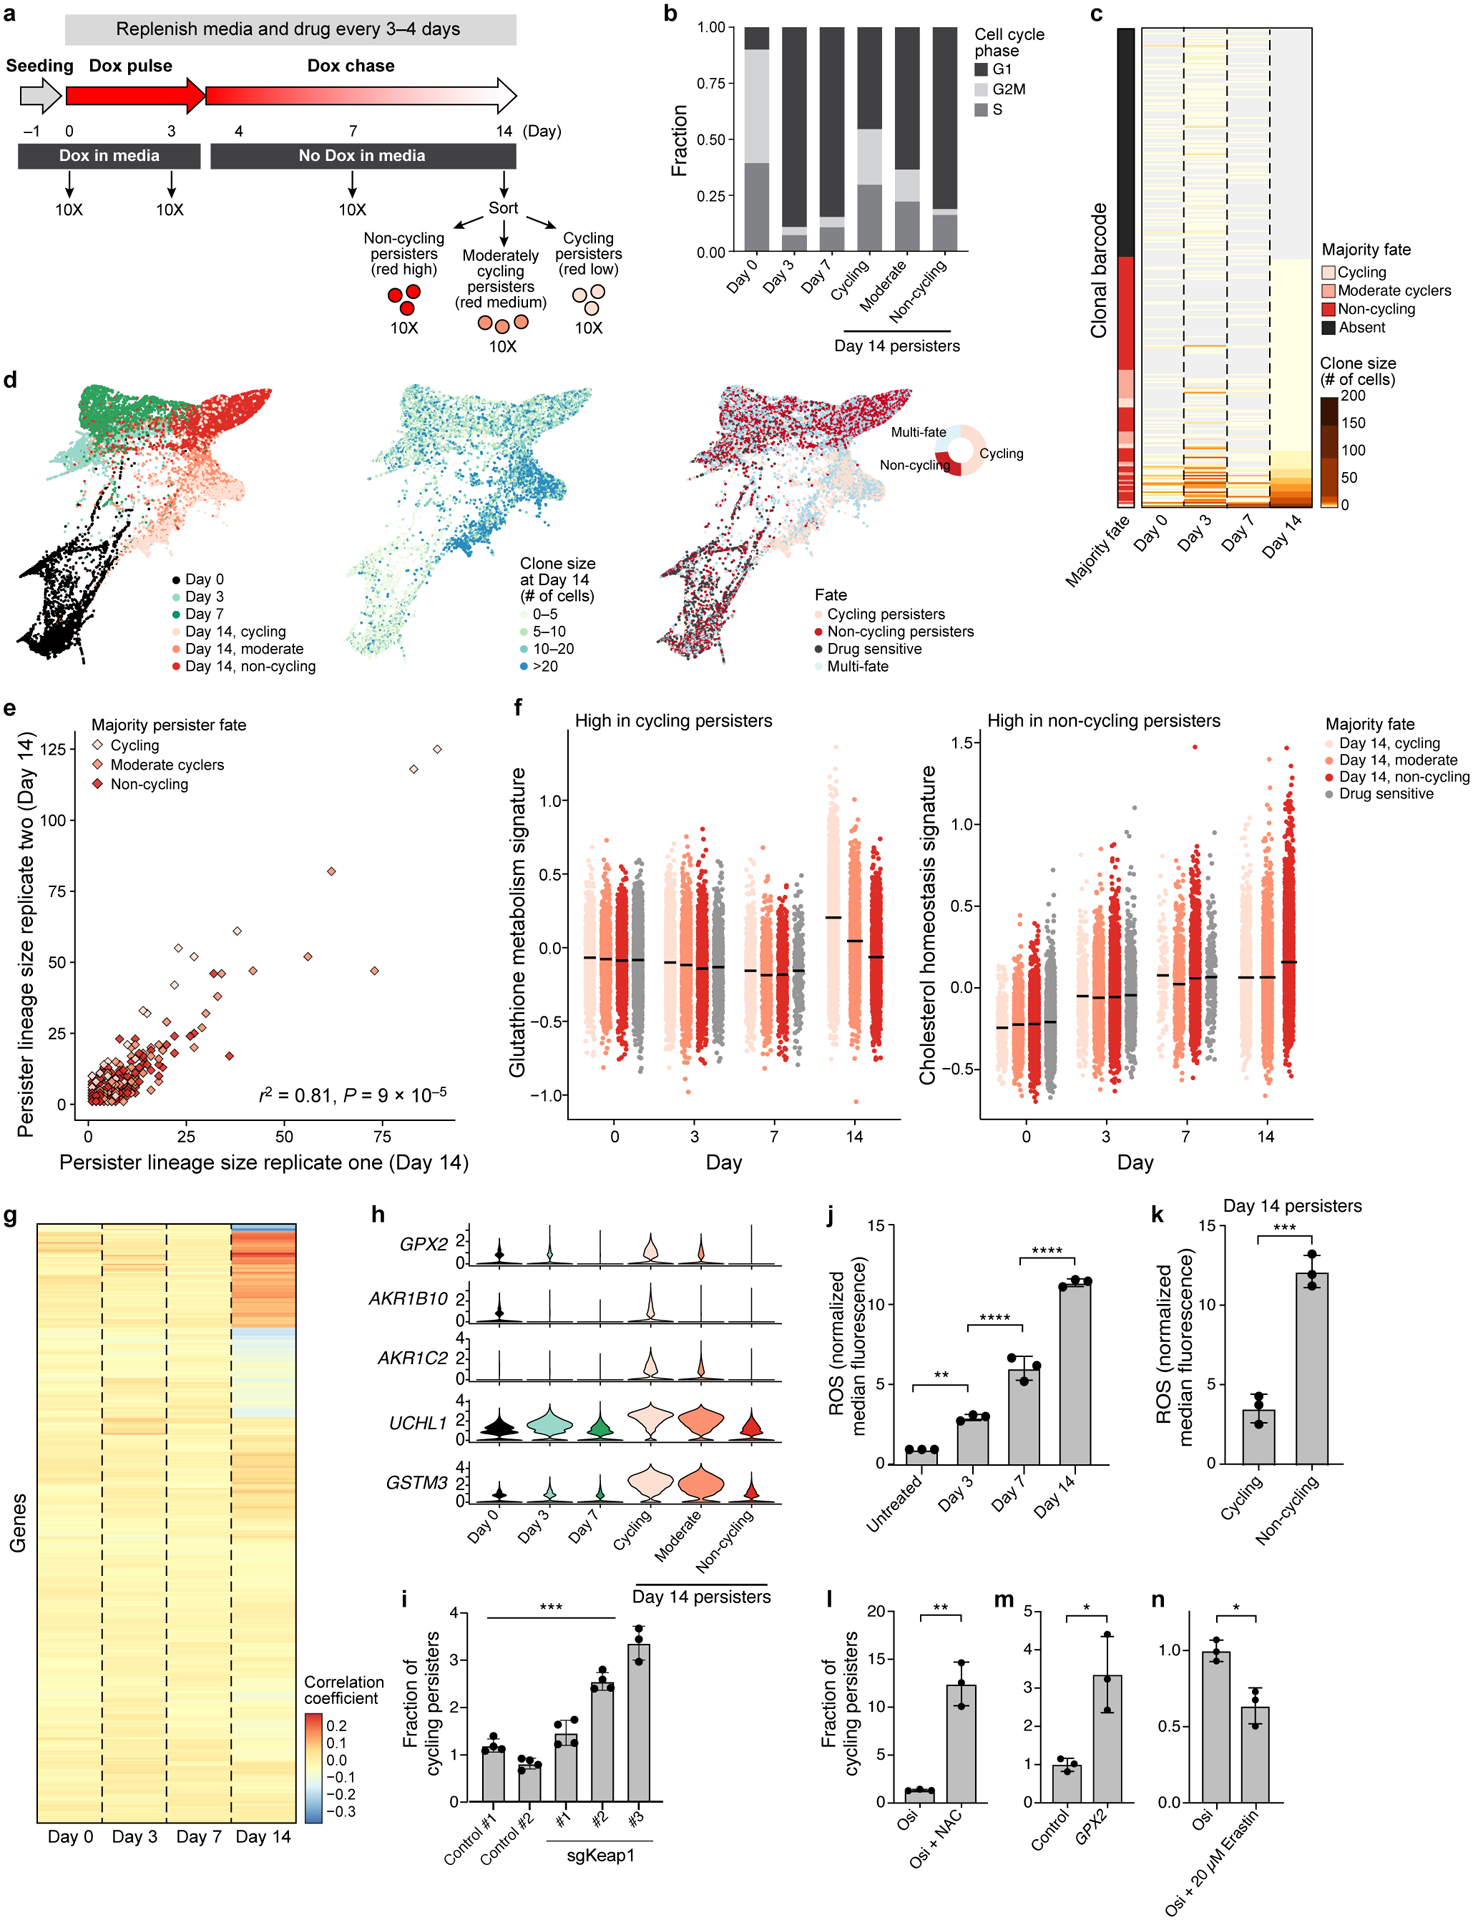
a. Experimental scheme. Vertical arrows: scRNA-seq collection time point. b. Proportion of cells in each cell cycle phase inferred from scRNA-seq. c. Lineage size (colourbar) for each lineage barcode (rows) across time points. Lineages sorted by fate at day 14, and marked by the majority fate of the mCherry populations on day 14 in that lineage (left bar). d. Force-directed layout of scRNA-seq profiles coloured by timepoint and day 14 mCherry expression (left); day 14 clone size (middle) or fate (right) of the lineage the cells belong to. Inset, right: fate distribution at day 14. e. Clone size of each persister lineage barcode in two independent experiments seeded from the same barcoded founding population. Colour: Persister fate of majority of cells in the lineage of combined replicates. P value determined by permutation test (Methods). f. Signature scores by lineage majority fate. g. Correlation coefficient (colourbar) of each gene’s (row) expression in each persister cell in a given timepoint (columns) and the cells’ corresponding lineage size at day 14. h. Distribution of expression levels (log2(TPM+1), y axis) across time for 5 of the top 10 genes positively correlated with persister lineage size. i. Fraction of cycling persisters following osimertinib treatment in control and sgKeap1 PC9 cells, P =3×10⁻⁴. j,k. ROS levels in PC9 treated with osimertinib timecourse (j, P0,3 =1.3×10⁻³, P3,7 < 1×10⁻⁴, P7,14 <1×10⁻⁴,one-way ANOVA with Tukey’s correction) or in persister subpopulations (k, P = 4×10⁻⁴). l-n. Fraction of cycling persisters following osimertinib treatment with or without NAC (l, P = 1.1 × 10⁻³), in PC9 transfected with control or a GPX2(m, P =1.5×10⁻²), or cells treated with or without Erastin (n, P =1×10⁻²). Error bars are mean +/− SD of three biologically independent experiments (i-n). * P < 0.05; ** P < 0.01; ***P < 0.001; two-tailed t-tests.
In line with previous reports3,6, osimertinib induced a G1 arrest on day 3 and 7 of treatment. At day 14, cycling persisters (as defined at the endpoint by mCherry dilution) had higher expression-based cell cycle scores compared with moderate cyclers and non-cycling cells (55%, 36%, 18% cells in G2/M or S phase for cycling, moderate cyclers and non-cycling persisters respectively, Fig. 2b and Extended Data Fig. 2e), validating Watermelon’s ability to distinguish persisters by proliferative history. Consistent with our imaging-based analysis, less than 12% of barcodes that were present in persisters at day 14 were part of a large clonal expansion, increasing in size by 5-fold or more during the course of the 14-day assay (Fig. 2c and Extended Data Fig. 2f). While we observed a significant decrease in lineage diversity at day 14 compared to the other timepoints (P = 2×10−58 (day 7 to day 14), 2D =829 (day 14), 2D >2,020 (day 0–7), Extended Data Fig. 3a,b), most lineages were retained throughout the experiment overall, when accounting for sampling bias (Extended Data Fig. 3c–e). These clonal dynamics are consistent with recent reports that most cell lineages are able to enter a drug tolerant state following treatment7,8.
Persister fate is lineage dependent
The scRNA-seq profiles indicated a gradual change of cell state following drug treatment, with cycling and non-cycling persister cells following distinct transcriptional trajectories, and a subset of cycling persisters resembling untreated cells (Fig. 2d left; overlapping light pink and black dots). Examination of clone size dynamics during the course of treatment revealed clonal expansion with the largest increase in clone size observed in the cycling persisters (175, 110 and 53 maximum cells per lineage for cycling, moderate cyclers and non-cycling persisters, respectively, Fig. 2d, middle, Extended Data Fig. 4a). Importantly, almost two-thirds of clones were uni-fate, giving rise to either only cycling or only non-cycling persisters, and multi-fate lineages were far less frequent than expected by chance (Extended Data Fig. 4b, P = 1×10⁻⁵, permutation test, Fig. 2d, right).
We hypothesized that this restricted cell fate pattern arises because cells are often committed to a given proliferative fate prior to drug treatment. To test this hypothesis, we compared persister lineage size in two independent replicate experiments using the same starting Watermelon-transduced PC9 cell population, treated with osimertinib for 14 days, sorted to three subpopulations by mCherry expression and profiled by scRNA-Seq. The sizes of individual clones at day 14 were highly correlated between replicates (Fig. 2e, r2 =0.81 P = 9*10−5, permutation test, Extended Data Fig. 4c,d, Methods), suggesting that each persister clone has a distinct reproducible proliferative potential under drug treatment.
ROS controls persister proliferation
To identify cellular expression programs that are associated with the ability of persisters to cycle, we searched for gene signatures that are differentially expressed between the persister subpopulations, but are cell cycle independent. In line with previous reports9,10, epithelial-mesenchymal transition (EMT) was induced by the EGFR inhibitor; however, the levels of induction were similar in both the cycling and non-cycling persister populations (Extended Data Fig. 5a), suggesting that this program does not underlie the ability of persisters to cycle. In contrast, cycling and non-cycling persisters upregulated the expression of genes from different pathways. While cycling persisters exhibited higher expression of glutathione metabolism and NRF2 signatures than non-cycling persisters, non-cycling persisters had higher expression of cholesterol homeostasis, interferon alpha and Notch signaling signatures (Fig. 2f, and Supplementary Table 1). The signatures associated with cycling persister fate were not upregulated prior to drug treatment, suggesting that cycling persisters arise from cells poised to induce these programs, rather than from a selection of cells that already express them prior to drug treatment (Extended Data Fig. 5b,c).
Notably, both estrogen response11 and ferroptosis12,13 were recently implicated in the survival of drug tolerant cells, and we consistently observed a decrease in the total number of persister cells following treatment with either the estrogen receptor inhibitor fulvestrant and a GPX4 inhibitor (RSL3) (which induces ferroptosis). However, these treatments enriched for the fraction of cycling cells in the surviving population (Extended Data Fig. 5d–j), further emphasizing the difference between cycling and non-cycling persisters and suggesting that alternative strategies may be needed to target relapse-promoting cells.
To further explore expression differences at the lineage level, we correlated gene expression over time with persister clone size at day 14. At early time points no genes were strongly correlated with persister clone size, whereas at day 14 expression of a subset of genes correlated with persister clone size (day 14 correlation r>0.25, Fig. 2g). (Some weak correlation is observed as early as day 3, Extended Data Fig. 6). Of the top ten correlated genes more highly expressed in cells from larger clones, five are targets of the oxidative stress-induced transcription factor NRF2 (Fig. 2h), further supporting a role for antioxidant defense programs in persister proliferative fate. Consistent with our differential expression analysis and a recent report on the role of NRF2 in minimal residual disease14,15, knockout of Keap1, a negative regulator of NRF2, increases the fraction of cycling persisters (Fig. 2i).
Given the strong relationship between antioxidant expression signatures and persister proliferative capacity, we tested whether prolonged osimertinib treatment induces reactive oxygen species (ROS) and if alleviating ROS enhances cycling persisters. Analysis of osimertinib-treated cells using CellROX, a fluorescent ROS reporter, revealed a strong time-dependent increase in ROS levels (Fig. 2j). In line with the observed expression differences between the two persister subpopulations, day 14 cycling persisters exhibited less than a third of the ROS levels measured in the non-cycling population (Fig. 2k). Moreover, when we alleviated ROS by treatment with N-acetylcysteine (NAC), a ROS scavenger, from day 3 onwards (Fig. 2l), or by stable overexpression of the cDNA GPX2 open reading frame (Fig. 2m), the fraction of cycling persisters increased significantly. Conversely, treatment with erastin, which inhibits the cystine-glutamate antiporter system crucial for glutathione synthesis, decreased the fraction of cycling persisters (Fig. 2n). Taken together, this supports a role for redox balance in regulating the proliferative capacity of persisters.
Metabolic shift in cycling persisters
Because redox balance is tightly linked to metabolism16, we performed LC-MC/MS metabolic profiling to examine differences between persister subpopulations. Principal component analysis (PCA) over the 229 quantified metabolites separated the cycling persisters, non-cycling persisters and untreated populations (Fig. 3a and Extended Data Fig. 7a–c), with 56 metabolites differentially abundant between samples (Fig. 3b). In particular, carnitine-linked fatty acids, which are substrates of mitochondrial β-oxidation, were significantly more abundant in the cycling persisters than in the non-cycling persisters (Fig. 3c). We examined the oxidation of radiolabeled palmitic acid to 3H2O to assess fatty acid oxidation (FAO), and indeed found a time-dependent increase in FAO with osimertinib treatment (Fig. 3d and Extended Data Fig. 7d,e). Thus, the higher abundance of acylcarnitine species in cycling persisters and the increase in FAO over time with osimertinib treatment both suggest that mitochondrial FAO may contribute to the cycling persister phenotype.
Figure 3. Persister cells shift their metabolism to fatty acid oxidation.
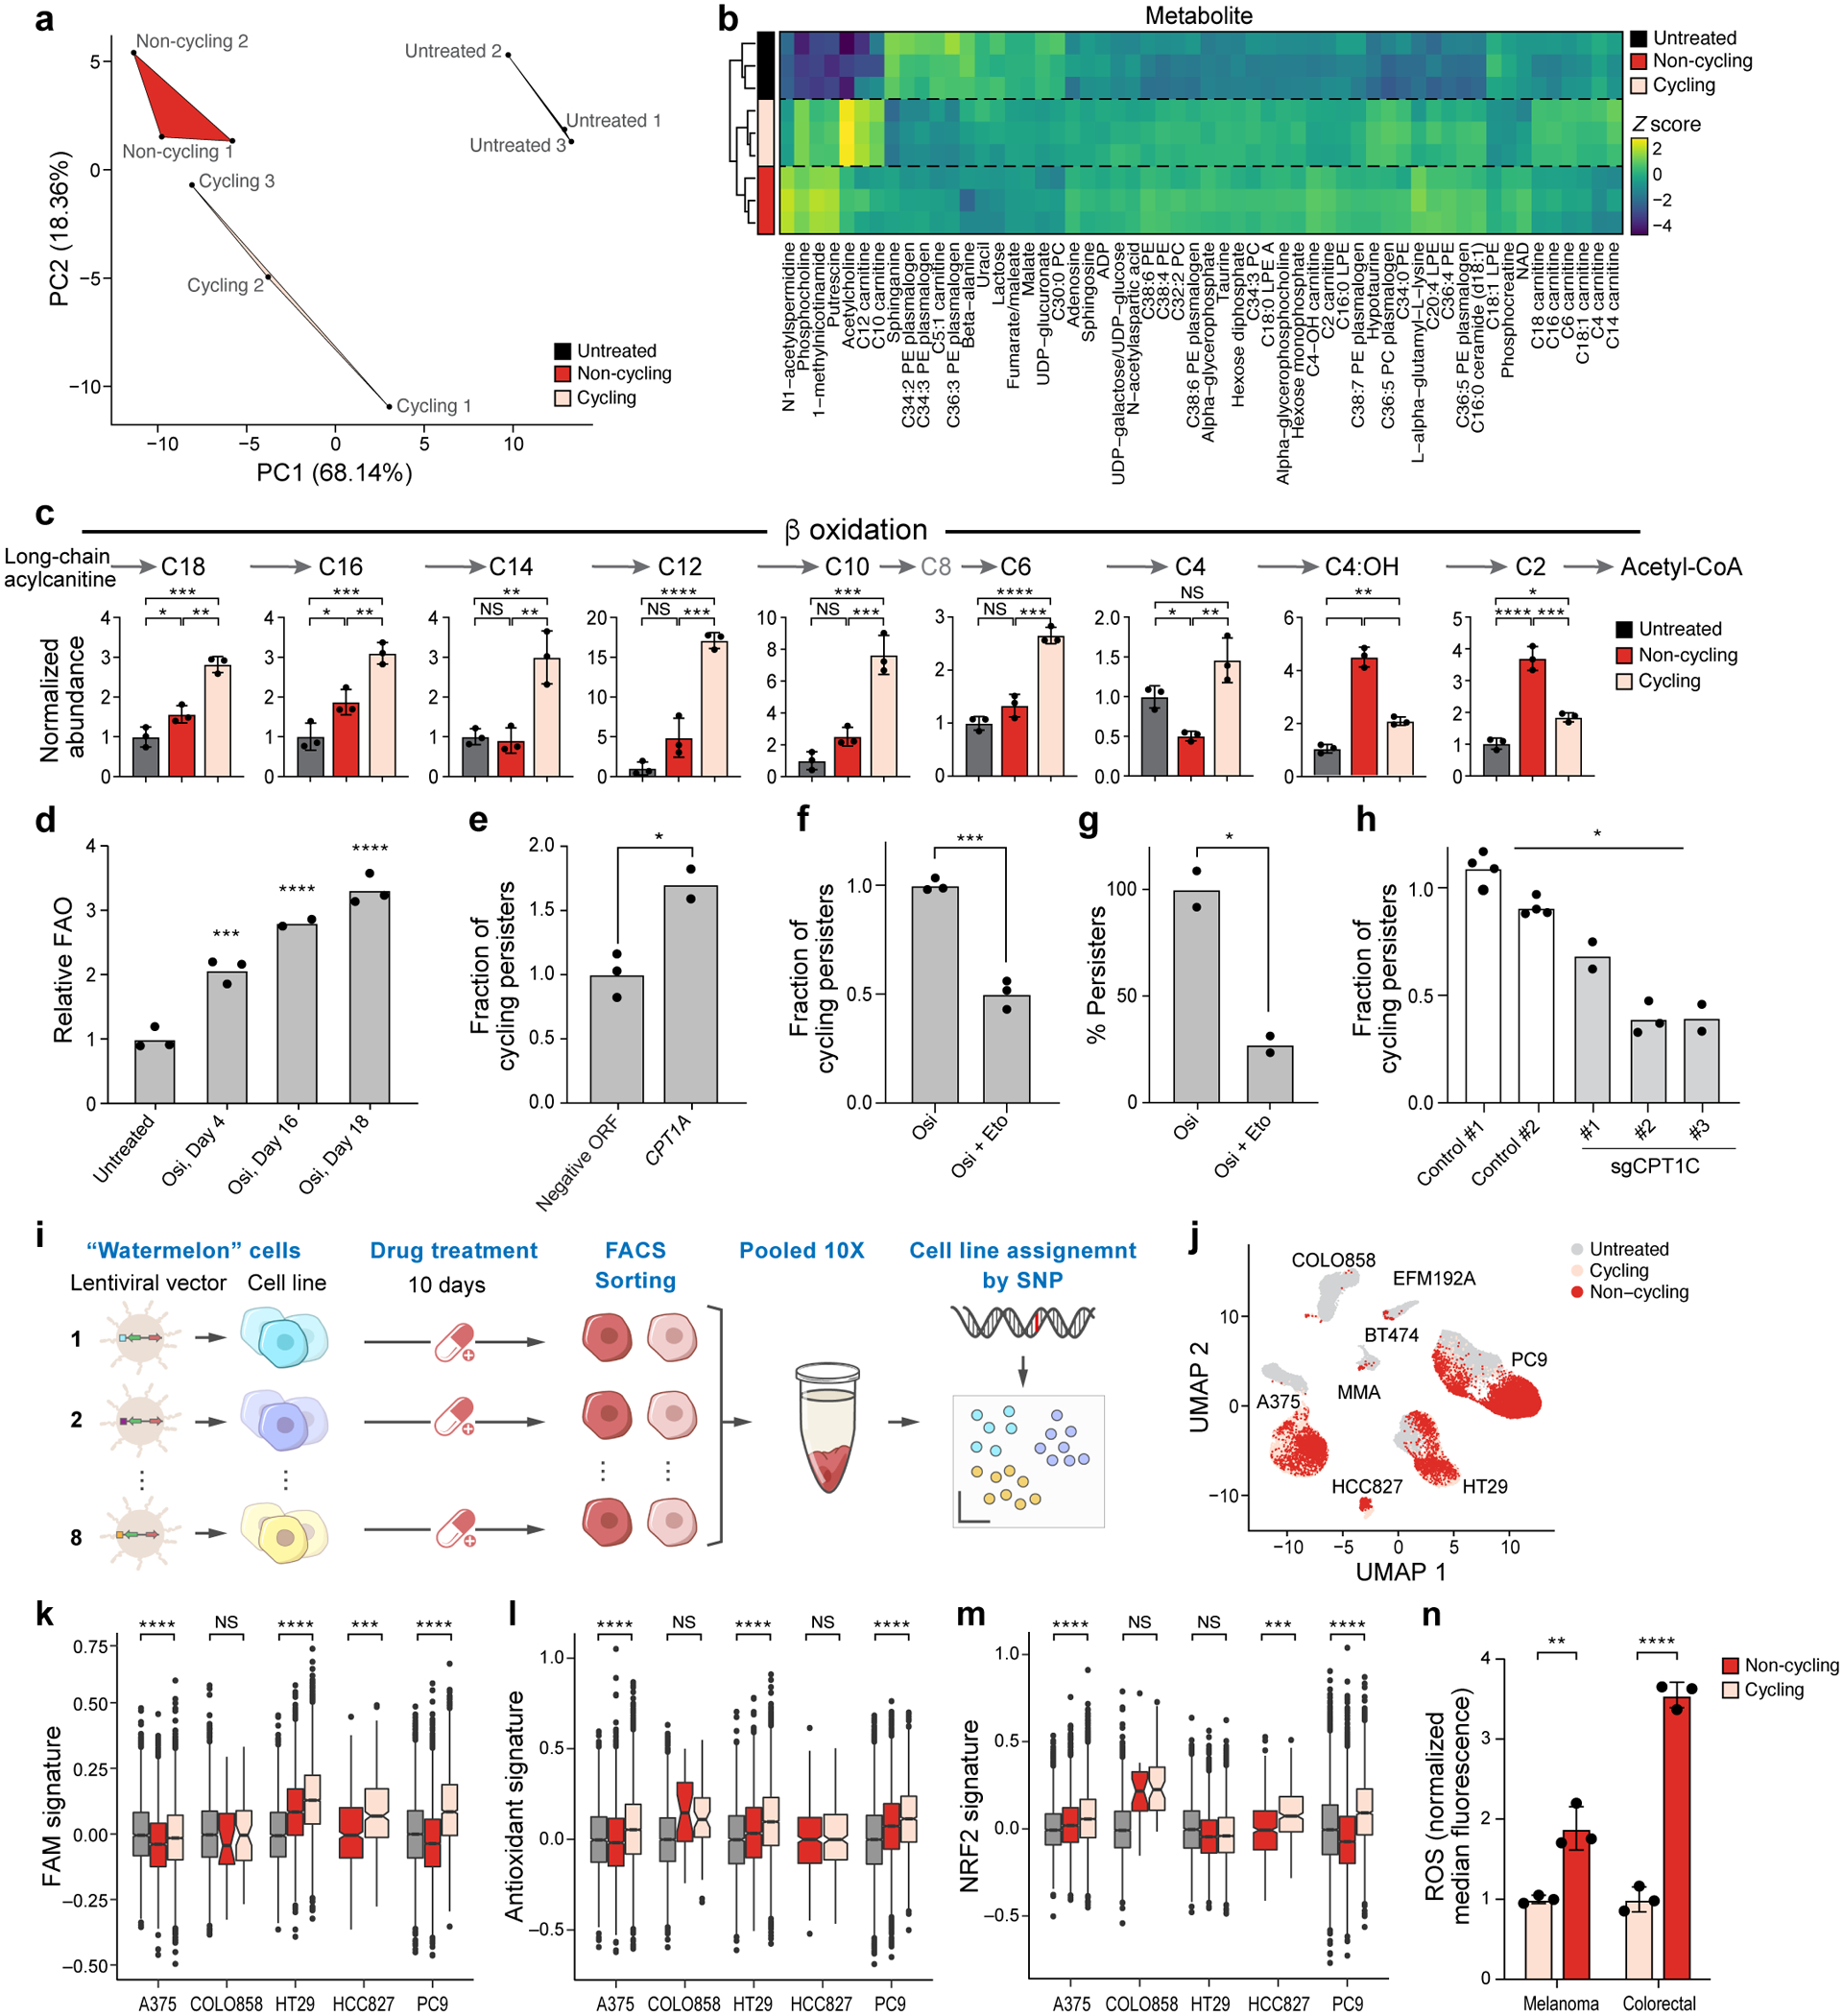
a. The first two principal components (PCs) of a Principal Component Analysis of LC-MS/MS metabolite profiles. b. Z-scores (colourbar) of differentially abundant metabolites (rows) (one-way ANOVA P-value<0.05) between cycling persisters (pink), non-cycling persisters (red) and untreated parental cells (black) (columns). c. Mean abundance of β-oxidation metabolites measured by LC-MS. d. Mean fatty acid oxidation (FAO) levels (y axis, relative to mean of untreated cells) measured by 3H-palmitic acid oxidation in PC9 osimertinib-treated cells over time. P0,4 = 8×10⁻⁴, P0,16 < 1×10⁻⁴, P0,18 <1×10⁻⁴, one-way ANOVA with Tukey’s correction. e. Mean fraction of cycling persisters at day 14 of 300 nM osimertinib treatment of PC9 transfected with control or CPT1A-expressing vector, P =1×10⁻². f,g. Mean fraction of cycling persisters (y axis, f, P =3×10⁻⁴) and overall fraction of persister cells (y axis, g, P =1.6×10⁻²) at day 14 of 300 nM osimertinib treatment alone or with 100μM Etomoxir at days 3–14. h. Mean fraction of cycling persisters for control and sgCPT1C PC9 cells, P = 3×10⁻². i. Schematic for pooled persister assay. j. UMAP of single cell profiles (dots) from eight Watermelon persister models coloured by cell cycle phase. k-m. Signature scores of fatty acid metabolism (k), antioxidant response (l) and NRF2 (m) pathways in persister cells from indicated models. Significance based on comparing cycling to non-cycling populations (Methods and Supplementary Table 2). Box plots represented by center line, median; box limits, upper and lower quartiles; whiskers extend at most 1.5× interquartile range past upper and lower quartiles. n. Mean ROS levels in melanoma (A375, P = 5.1×10⁻³) and colorectal (HT29, P <1×10⁻⁴) persister populations. Error bars are mean +/− SD of two (e,g) or three biologically independent experiments (c,d,f,h,n). * P < 0.05; * * P < 0.01; * * * P < 0.001; * * * *P < 0.0001; two-tailed t-tests.
We next tested if modulating the FAO pathway affects the proliferative capacity of persisters. Overexpression of CPT1A, a rate limiting enzyme that facilitates the transfer of fatty acids into the mitochondria, in Watermelon-PC9 cells resulted in >50% increase in the fraction of cycling persisters following 14 days of osimertinib treatment (Fig. 3e). Conversely, blocking FAO with etomoxir, a CPT1 inhibitor (albeit with additional targets), at day 3 of osimertinib treatment, when most sensitive cells have already died, reduced the proliferative capacity of persister cells. Co-treatment with etomoxir for 11 days, at a concentration that has minimal inhibitory effects on untreated cells (Extended Data Fig. 7f), significantly reduced the fraction of cycling persisters (Fig. 3f), and the overall fraction of persister cells (Fig. 3g). Concordantly, knocking out CPT1C, a gene isoform which is up-regulated in human lung tumors17 (but not CPT1A), led to a reduction in the fraction of cycling persister cells (Fig. 3h and Extended Data Fig. 7g). Taken together, these results support our hypothesis that FAO plays a role in establishing the proliferative persister state.
To investigate the generality of these findings to other persister cells, we generated seven additional Watermelon models from EGFR-driven lung cancer (PC9, HCC827), HER2-driven breast cancer (BT474, EFM192A) and BRAF-driven melanoma (A375, COLO858) and colorectal (HT29) cell lines, treated them with clinically relevant kinase inhibitors for 10 days (osimertinib, lapatinib or dabrafenib), sorted them for mCherry levels, and profiled them by scRNA-Seq, yielding 50,735 single cell profiles (Fig. 3i and Supplementary Table 2). In line with previous reports18,19, the profiles grouped by cell identity and not by treatment (Fig. 3j and Extended Data Fig. 8a–e). Across all models, persisters exhibited G1 cell cycle arrest and cycling persisters, when present, had an overall higher fraction of G2M/S phase cells compared with non-cycling persisters, validating the Watermelon’s ability to capture this rare proliferative population in multiple models (Extended Data Fig. 8f).
In four of five models with a sufficient number (>50) of cycling persister cells detected, cycling persister cells showed elevated fatty acid metabolism (FAM) signature compared to their non-cycling counterparts (Fig. 3k). Similar to PC9 cells, A375 melanoma cycling persisters had higher expression of both antioxidant response genes and the NRF2 signature compared with non-cycling cells from the same model (Fig. 3l,m). Conversely, cycling HT29 and HCC827 persister cells upregulated one, but not both, of these ROS-related signatures (Fig. 3l, m). Melanoma (A375) and colorectal cancer (HT29) cycling persisters also exhibited significantly lower ROS levels compared with the non-cycling population of the same cell line (Fig. 3n). Thus, the cycling persister state induced by oncogenic kinase inhibition shared similar metabolic and expression features across cells lines from different tumor types.
ROS and FAM induced in residual disease
EGFR inhibition also induced a similar shift in vivo, as observed in minimal residual disease in an osimertinib-treated genetically engineered mouse model carrying inducible mutant EGFRL858R and knockout for Trp5315 (Fig. 4a and Extended Data Fig. 9a). To establish tumors, we induced lung-specific expression of the human EGFR transgene by doxycycline and tamoxifen administration (Methods). Once mice developed lung adenocarcinomas, we treated them with osimertinib until the rate of tumor regression plateaued, indicating minimal residual disease (MRD) (Fig. 4a, Extended Data Fig.9b). Bulk RNA-Seq of samples from treated and untreated mice showed that while there was a strong treatment-induced decrease in overall cell cycle and EGFR signaling signatures, MRD cells upregulated the expression of ROS and FAM gene signatures, consistent with our in vitro findings (Fig. 4b, and Extended Data Fig.9c–e).
Figure 4. Metabolic shift in tumours treated with oncogene-targeted therapy.
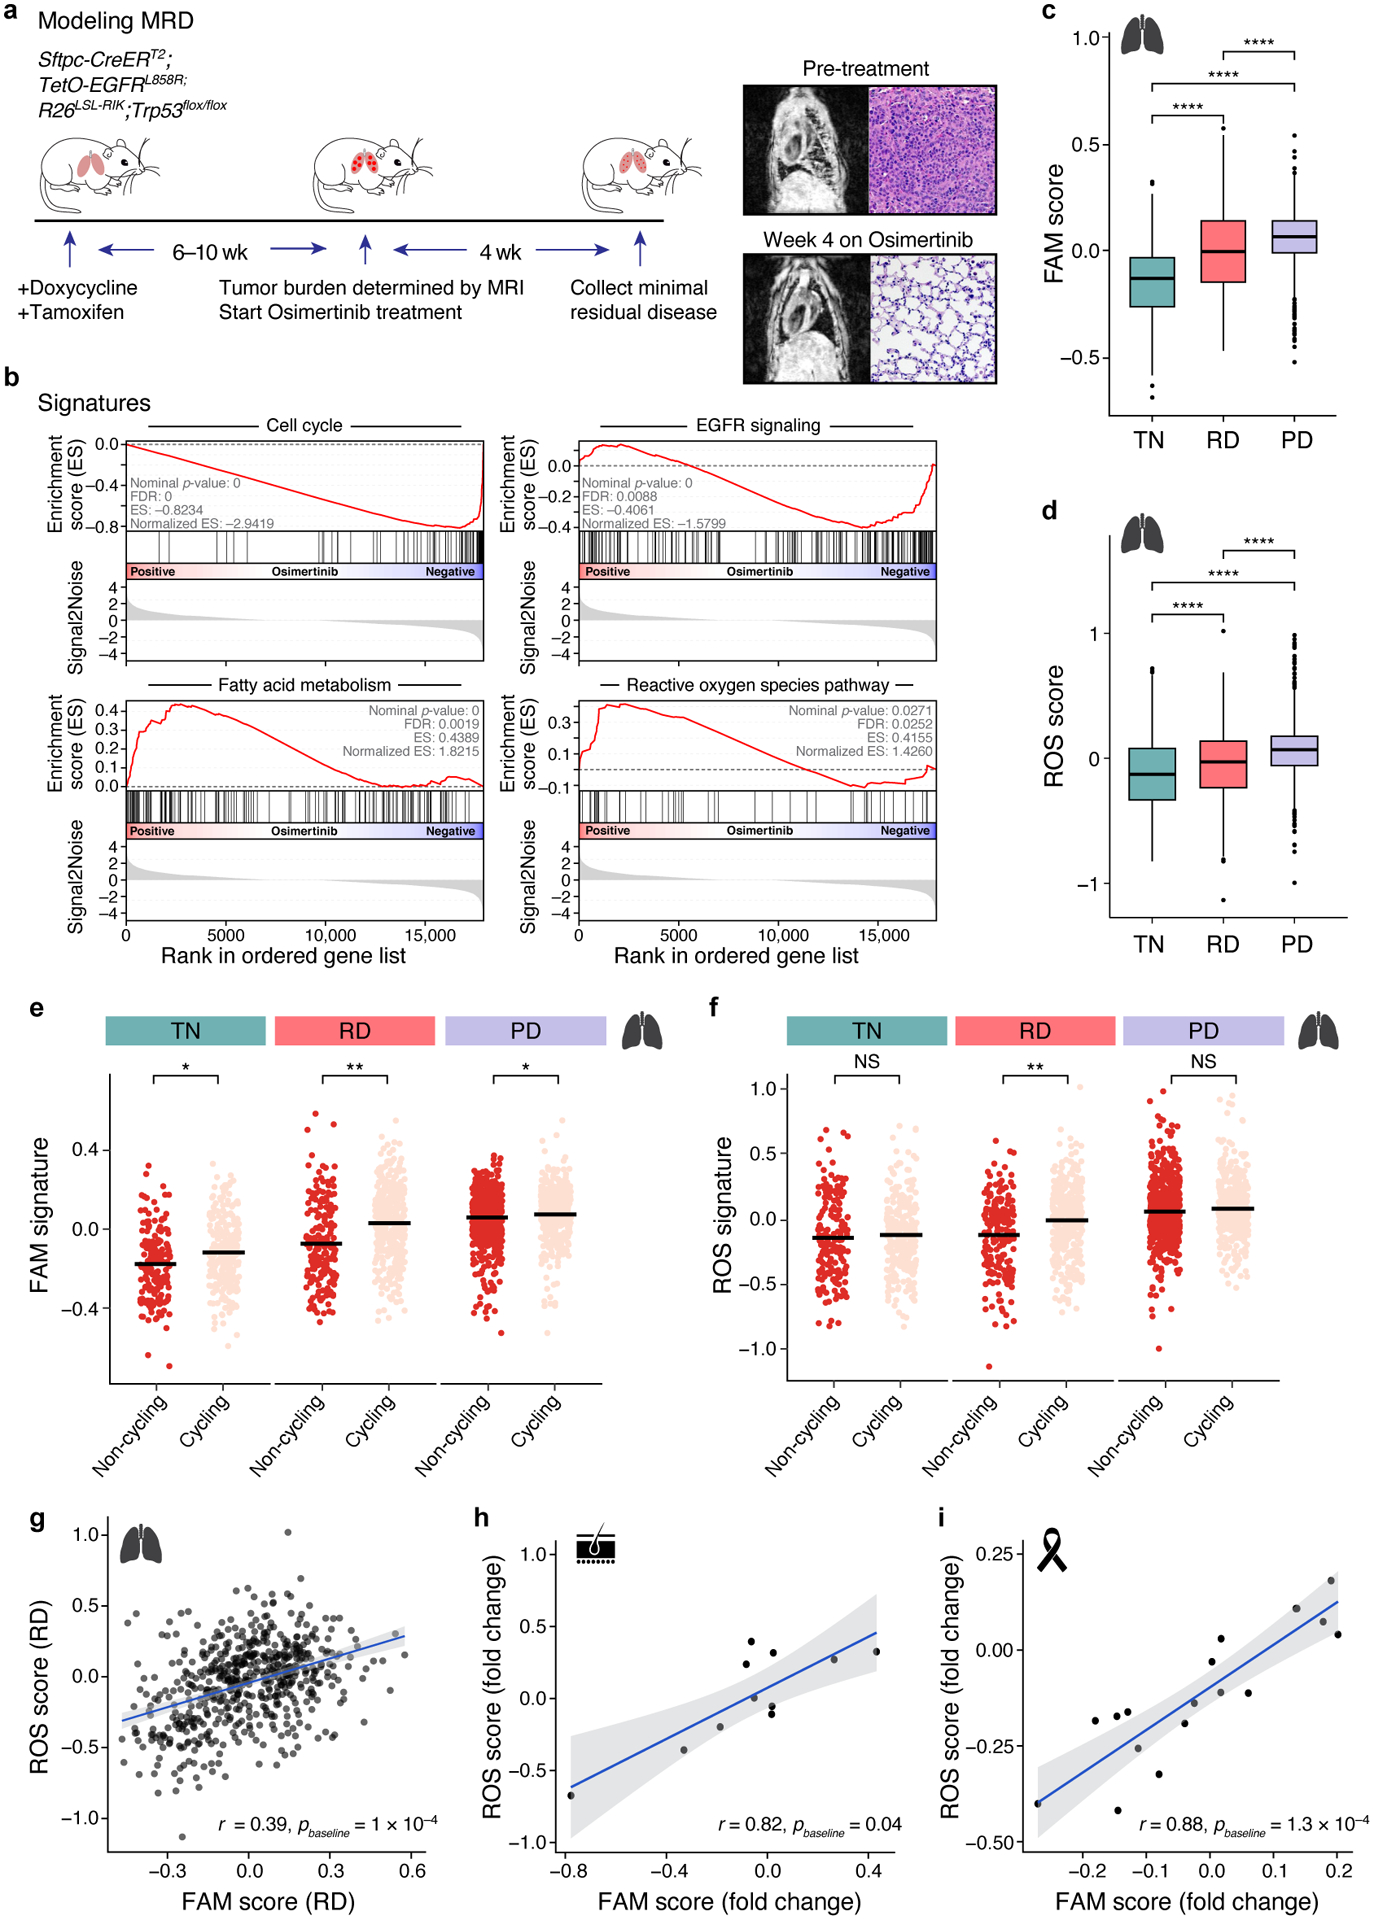
a. Fatty acid metabolism (FAM) and reactive oxygen species (ROS) pathway signatures increase with treatment in a genetically engineered mouse model. Left: Experimental scheme for tumour development and drug treatment; middle: MRI (left) and H&E staining (right) of pre- (top) and post-treatment (bottom) mouse lungs. b. Gene Set Enrichment Analysis (GSEA) of cell cycle, EGFR signaling, ROS, and FAM related genes in minimal residual disease samples versus untreated control. c,d. Signature scores FAM (c, PTN,RD< 2×10⁻¹⁶, PTN,PD< 2×10⁻¹⁶, PRD,RD= 6×10⁻¹⁴) and ROS (d, PTN,RD=6.7×10⁻⁷, PTN,PD< 2×10⁻¹⁶, PRD,RD= 4.8×10⁻¹⁶) in treatment naïve (TN), residual disease (RD) and progressive disease (PD) of human lung adenocarcinoma (457, 557, and 1,088 cells per group, respectively). *** P < 0.001**** P<0.001; two-sided Wilcoxon test. Expression data from NCT03433469 trial. Box plots represented by center line, median; box limits, upper and lower quartiles; whiskers extend at most 1.5× interquartile range past upper and lower quartiles. e,f. FAM (e, PTN=1.2×10⁻², PRD=1.1×10⁻³, PPD=1.5×10⁻²) and ROS (f, PTN=0.9, PRD= 5.3×10⁻³, PPD=0.1) signature scores (y axis) in cells (dots) stratified by cycling (pink) vs. non-cycling (red) status across treatment phases of lung adenocarcinoma samples. * P < 0.05 (mixed linear model; Supplemental Methods). g. Correlation between ROS and FAM signature scores (x and y axes) in cells (dots) from lung adenocarcinoma residual disease. Bottom right: Correlation coefficient. h,i. Correlation between ROS and FAM signature scores in melanoma (h) and breast cancer (i) residual disease samples (dots). ROS (y axis) and FAM (x axis) signature scores in melanoma patients treated with BRAFi/MEKi (h) and HER2+ breast cancer patients treated with lapatinib (i). Bottom right: correlation coefficient. 95% confidence interval (g-i, shaded area).
Finally, we explored the relevance of these metabolic states in patient tumors, by analyzing single cell RNA-seq profiles from human EGFR-driven lung adenocarcinoma tumor samples from a recent study20 of 30 patients (Supplementary Table 3), spanning treatment naïve tumors (TN), residual disease during targeted therapy response (residual disease, RD), and upon establishment of drug resistance (progression, PD). In line with our in vitro findings, both FAM and ROS pathway signatures were significantly and gradually increased upon treatment from TN to RD to PD (Fig. 4c,d and Extended Data Fig. 10a,b).
The increase in ROS and fatty acid metabolism gene expression was associated with proliferation, and was higher in cycling vs. non-cycling persister cells (Fig. 4e,f). Specifically, when we stratified cells as cycling vs. non-cycling by the expression of a set of known cell cycle genes21, cycling persister cells in the RD phase had higher expression of FAM and ROS signatures compared with non-cycling RD cells (PROS =0.005, PFAM = 0.001 after controlling for patient and cell complexity, see Methods, Fig. 4e,f). Importantly, ROS and FAM signatures were more strongly correlated in treated than in TN samples (r=0.39, Pbaseline = 10−4 calculated by comparing TN and RD cells, Methods, Fig. 4g and Extended Data Fig. 10c), supporting the importance of oncogene inhibition in linking these pathways.
To test whether similar states are observed in patients in response to other oncogenic kinase inhibitors, we analyzed bulk RNA-seq profiles from two additional tumor types: BRAF-driven melanoma collected at baseline or after up to 22 days of BRAF inhibitor + MEK inhibitor treatment22, and HER2-driven breast cancer from patients at baseline or after treatment with lapatinib for 2–3 weeks (Supplementary Table 3). In melanoma, FAM and ROS induction was correlated only upon treatment (r = 0.82, Pbaseline = 0.04, Fig. 4h, Extended Data Fig. 10d), with 8 of 11 patients exhibiting induction of at least one of the signatures following treatment. In HER2+ breast cancer, FAM and ROS signature induction were correlated only upon drug treatment (r=0.88, P baseline=1.3 ×10⁻⁴, Fig. 4i and Extended Data Fig. 10e), with 50% of patients exhibiting induction of at least one of the signatures following treatment. This supports our model that cycling persisters undergo a metabolic shift in patient tumors in response to oncogenic kinase inhibitor therapy.
The understanding that non-mutational mechanisms may play a role in tumor relapse has prompted multiple studies focused on identifying factors that contribute to overall persister fitness23–26. However, since most persisters remain arrested during drug treatment3, factors that contribute to persister-driven relapse are hard to discern by bulk profiling. The ability of the Watermelon system to simultaneously map the lineage, proliferative history and transcriptional state of individual cells allowed us to identify metabolic and expression adaptations that may facilitate cell cycle re-entry in a rare subset of persister cells. In particular, our finding that some lineages are more poised to undergo a proliferation-promoting adaptive response is in line with studies showing that a subset of cancer cell genomes have a chromatin configuration that renders them more likely to transition to an oncogene-independent state following treatment27–29. Taken together, the results presented here illustrate an approach to understand not only what underlies the ability of persisters to cycle but also what drives other clinically important persister traits such as time-to-relapse, thus providing an important step towards the development of therapies that delay disease recurrence.
Methods
Cell culture
EGFR-mutant non-small-cell lung cancer cells PC9, HCC827 (Hata lab) and HER2-amplified breast cancer cell line BT474 and the BRAF-mutant colorectal cell HT29 line were cultured in RPMI-1640 medium (ThermoFisher Scientific) supplemented with 10% fetal bovine serum (FBS). A375 (BRAF-mutant) melanoma line was grown in DMEM (ThermoFisher Scientific) supplemented with 10% FBS. EFM192A (HER2-amplified) breast cancer line was grown in RPMI-1640 medium (ThermoFisher Scientific) supplemented with 20% fetal bovine serum (FBS). COLO858 (BRAF-mutant) cell line was grown in phenol red free RMPI 1640 supplemented with 5% FBS and 1% sodium pyruvate (Gibco). MMACSF (BRAF-mutant) was grown in DMEM/F12 supplemented with 5% FBS and 1% sodium pyruvate. All cell lines were with supplemented with penicillin and streptomycin (Thermo Scientific). All breast cancer cell lines were obtained from the Broad’s cancer platform. Melanoma and colorectal cell lines used in this study were obtained from the Harvard Medical School (HMS) Laboratory of Systems Pharmacology (LSP). Each cell line was maintained in a 5% CO2 atmosphere at 37 °C. Cell line identities were confirmed by STR fingerprinting and all were found to be negative for mycoplasma using the Universal Mycoplasma Detection Kit (ATCC).
Persister cell derivation and treatments
Persister cells were derived using an IC90 drug concentration from treatment of EGFR-mutant non-small-cell lung cancer, BRAF mutated melanoma or HER2-amplified breast cancers with 300uM osimertinib, 1 μM dabrafenib or 1 μM lapatinib respectively, for 10 days for the breast and melanoma cells and 14 days for the lung cells. Fresh media with drug was added every 3–4 days.
For watermelon vector induction, doxycycline was added to the media two days prior to drug treatment and was maintained in the media for the first 3 days of drug treatment. Unless otherwise noted, any additional drugs were added to three days treated cells that were maintained under constant drug exposure throughout subsequent treatment by replenishing the media every 3–4 days with fresh drug. For re-sensitization experiments, persister populations were derived by sorting day 14 osimertinib-treated PC9-watermelon cells based on mCherry expression following 11 days of doxycycline chase. Following sorting, persister populations were propagated in drug free media for 20 passages prior to starting the assay. Cell numbers following treatment were determined by imaging plates and quantifying nuclei using the Acumen Cellista plate cytometer (TTP Labtech).
Live cell imaging
Cells were grown in poly-D-lysine-coated glass bottom plates (MatTek Corporation) and imaged using a Nikon Eclipse TE-2000 inverted microscope with a 10X Plan Apo objective and a Hammamatsu Orca ER camera, equipped with environmental chamber controlling temperature, atmosphere (5% CO2) and humidity. For long-term live cell imaging experiments, drug containing media was replaced every day to prevent changes in drug concentration due to evaporation. Images were acquired using the MetaMorph Software. For the initial 24h images were acquired every 10 min, for 24–120h images were acquired every 20 min and later images were acquired hourly.
Single-Cell Tracking was performed as in Reyes et al. 201830. In brief, we used a semi-automated MATLAB based method to track and annotate cell fates. The method relies on identification of cell centroids using intensity and shape information of a constitutively expressed nuclear marker (H2B-mCherry), centroid linkage using nearest-neighbor, and user correction and annotation of cell fate events (Tracking software available at: https://github.com/balvahal/p53CinemaManual). A single cell of each progeny was tracked throughout the time course or until cell death.
Non persisters were tracked from the beginning of the movie. Only one representative from each progeny was tracked, and following division one of the sisters was randomly selected for tracking. To track persister cells, all cells that appeared in the last frame were first manually tracked from the last frame to the first frame. After determining a day 0 initiating cell, to prevent over representation of large progenies in the analysis, for each lineage, only one path was tracked forward in a given time point. To determine the number of progeny in each persister lineage, cells were manually tracked and counted and cell death was manually recorded. Cell cycle time for untreated cells was measured between first and second mitotic events. For persisters, cell cycle time was measured from the first mitosis occurring after the first 72 hours following treatment to any subsequent mitosis and averaged, in order to avoid counting cell cycle events occurring prior to osimertinib uptake.
For doubling time assays, cells were seeded in 96-well plates at a density of 3×10³ cells/well and measured using an IncuCyte ZOOM live cell imaging system (Essen BioScience, Ann Arbor, MI, USA).
Cloning of the Watermelon library
A lentivirus backbone was constructed containing: TRE3GS promoter for H2B-mCherry and hPGK promoter for expression of Tet-On rtTA element, NLS-mNeon and a polyadenylated lineage barcode cassette. We prepared the vector backbone by digesting 20 μg of it with Sbf1 (New England Biolabs (NEB)) overnight at 37°C followed by gel purification using 1% E-Gel Ex (ThermoFisher Scientific). The cut backbone was extracted with the QIAprep miniprep Kit (Qiagen) and the resulting DNA was eluted in 100 μl of H2O and purified with 0.70× AMPure XP SPRI beads.
The double-stranded lineage barcodes were generated by annealing two DNA primers, a 90-bp-long oligonucleotide containing a semi-random 30-bp-long barcode sequence (i.e., 15 repeats of A/T (W)–G/C (S)) and a flanking primer pair for barcode amplification and preforming a single cycle extension reaction (for primer list see Supplementary Table 4). The resulting oligonucleotides were ran on 2% E-Gel Ex and purified with 2.5×AMPure XP SPRI beads.
To generate a watermelon library with a diverse lineage barcode pool, the lineage oligonucleotides were mixed together with the backbone fragment in a 5:1 molar ratio together with an equal volume of Gibson master mix (Gibson Assembly Cloning Kit NEB), incubated at 50°C for 4 h, cleaned with 0.75× AMPure XP SPRI, eluted in 15 μL H2O and electroporated into Endura competent cells (Lucigen). We expanded the cells in LB liquid culture supplemented with carbenicillin (Sigma-Aldrich) for 16 hours at 30°C and purified the pooled library plasmid with the Endotoxin-Free Plasmid Maxiprep Kit (Qiagen). Library complexity was estimated by sequencing the library plasmid pool at a depth of approximately 68 million reads.
Lentivirus production
Lentiviral particles were produced by transfecting 293T cells with dVPR and VSVG packaging plasmids, using the X-tremeGene transfection reagent (Sigma-Aldrich) according to the manufacturer’s instructions. Media was replaced with DMEM medium (ThermoFisher Scientific) supplemented with 20%FBS 20 hours post transfection, and media containing virus particles were collected 48 hours post transfection. For ORF overexpression and guide screen, virus particles were concentrated using Amicon 100 KDa 15mL columns (Millipore) in a cold centrifuge at 1,000 xg to a final concentration of 500 μl per virus. Virus was aliquoted and stored at −80°C until use.
Watermelon cell line construction
Parental cell lines were transduced using the watermelon virus and cells were spin infected using 16 μg/ml polybrene in 2,500 rpm for 30 min at 30°C. After a 24h incubation with virus, media was changed and 72 hours post infection cells were sorted for mNeon expression. To ensure that the majority of cells were labeled with a single barcode per cell, for watermelon lentiviral infection, we used a target multiplicity of infection (MOI) of at most 0.3, corresponding to less than 30% mNeon expressing cells 72 hours post infection. Sorted cell populations,10,000 cells each, were expanded in culture for three passages, aliquoted to 2×10⁶ cells per vial and stored in liquid nitrogen.
Single-cell capture for PC9 time course experiment
Watermelon cells were thawed, expended in dox (2μg/ml) containing media for 96 hours and mCherry positive cells were sorted using a MoFlo Astrios Cell Sorter (Beckman Coulter) and re-plated. Following 96 hours of recovery, the cells were seeded into six-well plates at 300,000 cell per well and were given 24h to attach prior to adding 300nM osimertinib. Dox was continuously added to the media until day 3 of drug treatment. Cells were harvested at day 0 (untreated), 3, 7 and 14 of drug treatment. To obtain cell suspension for single cell profiling, cells were scrapped from the well, washed and resuspended in FACS buffer (0.5% BSA in phosphate-buffered saline), and filtered through a 40μm strainer. To delineate the differences between persister populations, day 14 cells were gated based on mCherry expression. Following sorting, the cells were spun down and approximately 9,000 single cells per sample were loaded to the Chromium Controller (10x Genomics). ScRNA-seq libraries were generated using the 10X Genomics Chromium Single Cell 3’ Kit v2 and the 10x Chromium Controller (10x Genomics) according to the standard v2 protocol. The resulting 3’ scRNA-Seq libraries were pooled together and sequenced with a HiSeq (Illumina, R2 read length 98 base pairs). To increase lineage barcode capture, targeted sequencing of the barcode area was performed using the whole transcriptome amplification product generated as a part the v2 protocol as a PCR template (for primer list see Supplementary Table 4). Targeted libraries were gel purified and sequenced with a MiSeq (Illumina).
scRNA-seq data analysis
Read alignment and data processing
Reads were mapped to the GRCh38 human transcriptome using CellRanger 2.1.0 (10x Genomics), and transcript-per-million (TPM) was calculated for each gene in each filtered cell barcodes sample. TPM values were then divided by 10 (TP100K), since the complexity of our single-cell libraries is estimated to be on the order of 100,000 transcripts. For each cell, we quantified the number of genes expressed and the proportion of the transcript counts derived from mitochondrial encoded genes. Cells with either <1,000 or more than 4,200 detected genes or >0.1 mitochondrial fraction were excluded from further analysis. Finally, the resulting expression matrix was filtered to remove genes detected in <3 cells. All the above steps were done using the Seurat v2 R package31.
Detection of differentially expressed gene signatures
To identify cellular programs that are associated the ability of persisters to cycle, we searched for differentially expressed, cell cycle independent, gene signatures that show the largest difference between the persister subpopulation. First, we identified genes are differentially expressed (had an adjusted P value lower than 0.001 and a |log2FC|>0.2) in the cycling persisters after regressing out known cell-cycle genes based on a published gene list5 using the MASTDETest implemented in Seurat. Next, we used hypergeometric to test which gene signatures were enriched in this gene set. This resulted in 37 gene signatures (FDR q-value<0.001). Last, for each of the 37 gene signatures, we calculated an Overall Expression signature score per cell, as previously described32 and the mean Overall Expression signature score per sample. Finally, signatures in which the mean signature level was lower for persister cells compared with untreated day 0 cells, were filtered out (see Supplementary Table 1 for final signature scores).
Calculating Overall Expression signature scores
Given a gene signature and a gene expression matrix, we first binned the genes to 10–50 expression bins (depending on data complexity) according to their average expression across the cells or samples. For each gene signature, we sampled 100 random compatible signatures for normalization. The final reported score is computed by subtracting the ‘real’ mean signature score from the randomized one. For more detailed description of the method please refer to Jerby-Arnon, L. et al.32
Metabolite profiling
Polar cell extracts were profiled using negative and positive ionization mode using liquid chromatography tandem mass spectrometry (LC-MS) methods. Negative ionization mode data were acquired using an ACQUITY UPLC (Waters Corp, Milford MA) coupled to a 5500 QTRAP triple quadrupole mass spectrometer (AB SCIEX, Framingham MA). Positive ionization data were acquired using an LC-MS system composed of a Shimadzu Nexera X2 U-HPLC (Shimadzu Corp) coupled to a Q Exactive hybrid quadrupole orbitrap mass spectrometer (ThermoFisher Scientific). For both modes, cell-sorted samples were extracted using 200 μl 80% methanol containing 0.5 ng/μL inosine-15N4, 0.5 ng/μL thymine-d4, and 1 ng/μL glycocholate-d4 as internal standards (Cambridge Isotope Laboratories, Inc., Tewksbury MA).
For the negative extraction, 90μl of each sample was centrifuged (10 min, 9,000 × g, 4°C) and the supernatants (10 μL) were injected directly onto a 150 × 2.0 mm Luna NH2 column (Phenomenex, Torrance CA). The column was eluted at a flow rate of 400 μL/min with initial conditions of 10% mobile phase A (20 mM ammonium acetate and 20 mM ammonium hydroxide (Sigma-Aldrich) in water (VWR)) and 90% mobile phase B (10 mM ammonium hydroxide in 75:25 v/v acetonitrile/methanol (VWR)) followed by a 10 min linear gradient to 100% mobile phase A. The ion spray voltage was −4.5 kV and the source temperature was 500°C. Raw data were processed using MultiQuant 3.0.3 software (AB SCIEX, Framingham MA) for automated peak integration.
For the positive extraction, 80μL of each sample was dried down using the turbovap (TurboVap LV, Caliper Life Sciences), Each sample was resuspended in 8μL of water and then crash with 72μL extraction solution 74.9:24.9:0.2 v/v/v acetonitrile/methanol/formic acid containing stable isotope-labeled internal standards (valine-d8, Sigma-Aldrich; and phenylalanine-d8, Cambridge Isotope Laboratories). Extracts were vortexed for 1 minute, samples were spun at 10,000 rcf for 10 minutes at 4°C and the resulting supernatant was moved to autosampler vials. Raw data were processed using TraceFinder software (Thermo Fisher Scientific) and Progenesis QI (Nonlinear Dynamics).
Metabolomics data analysis
Relative abundance metabolite data from positive and negative ionization mode extractions were analyzed in-part using the MetaboAnalystR package33. First, metabolites containing any missing values across samples were removed from the dataset. For metabolites that were detected in both positive and negative ionization extractions, we only considered values from the negative extraction as it used a triple quad for the analysis, which often yields higher accuracy. Prior to statistical analysis, the values of each metabolite across samples were log-normalized and mean-centered. Significantly different metabolites detected by ANOVA were clustered by complete linkage hierarchical clustering and visualized in heatmap format using the pheatmap R package. UMAP representation of metabolomics data was generated using the umap R package with local connectivity of 2 and k=3.
Fatty acid oxidation measurements
For FAO assays, cells in 6 well-plates were treated with 100μM etomoxir as indicated. Pulsing was performed in serum-free medium containing 1mM carnitine with 0.75 μCi [9,10(n)-3H] palmitic acid (GE Healthcare) for 2 hours. The medium was collected and eluted in columns packed with DOWEX 1X2-400 ion exchange resin (Sigma) to analyze the released 3H2O. 3H2O was measured in counts per minute (CPM) and normalized to total cellular protein using BCA Protein Assay Kit (ThermoFisher Scientific).
Reactive oxygen species measurements
To measure relative levels of reactive oxygen species, drug treated and control cells were stained with 5 μM CellROX Deep Red Reagent (Thermo Fisher) for 30 min at 37°C, washed three times with PBS, trypsinized and analyzed using MoFlo Astrios Cell Sorter (Beckman Coulter). To ensure a sufficient number of cycling cells for analysis, HT29 and A375 Watermelon models were profiled on day 10 and 21, respectively.
Pooled persister experiment
Watermelon cell lines were generated as described above for PC9 cells. Sorted cell populations, 1,000 cells each, were expanded in culture for three passages, aliquoted to 2×10⁶ cells per vial and stored in liquid nitrogen. To derive persister cells, we treated EGFR-driven lung (PC9, HCC827), HER2-driven breast cancer (BT474, EFM192A), BRAF-driven melanoma (A375, COLO858, MMACSF), and colorectal (HT29) cell lines with osimertinib, lapatinib and dabrafenib, respectively. After 10 days of continuous drug treatment, cells were sorted based on mCherry intensity. Persister populations derived from different cell lines were combined to generate a cycling and a non-cycling cell pool. These pools together with the drug naïve samples were subjected to 10X single cell capture and profiling, as described above. To assess reproducibility, for a subset of models, we derived persisters from multiple vials of the same cell line and subjected them to cell capture and profiling (Extended Data Fig. 9e)
Pooled persister analysis
Pooled scRNA-seq experiments were demultiplexed using Demuxlet34. First, allelic fractions for each cell line were estimated across a reference set of 1,000,000 SNPs19 from bulk RNA-seq data using Freebayes35. The Freebayes settings “pooled-continuous” and “report-monomorphic” were used and a pseudo-count of 1 was added to the reference and alternate allele read counts. Then, Demuxlet was run using the PL tag and a fixed mixing proportion, alpha, of 0.5.
ORF assays
Purified Open Reading Frame (ORF) expression vectors for CPT1A and GPX2 were ordered from Genecopoeia (CPT1A: EX-A1436-Lv156, GPX2: EX-A3079-Lv156). PC9 cells harboring the watermelon construct were transduced with individual vectors and treated with drug as previously described. To quantify the increase in expression. We confirmed increased expression of each ORF by reverse transcription and quantitative polymerase chain reaction (RT-qPCR). RT-qPCR primers were designed to: (1) capture both endogenous and plasmid sequences of each gene; (2) span only gene introns; (3) produce amplicons no larger than 200bp; and (4) have melting temperatures of 60±1°C (for primer list see Supplementary Table 4). For each sample, two replicates of 20,000 cells each were lysed in RLT buffer (Qiagen #79216) and RNA was isolated using Dynabeads MyOne Silane beads (ThermoFisher Scientific #37002D). Next, samples were treated with TURBO DNase (ThermoFisher Scientific #AM2238), and subsequently purified again with silane beads. Reverse transcription was preformed using SuperScript II Reverse Transcriptase (ThermoFisher Scientific #18064022) according to manufacturer’s protocol. The resultant cDNA was diluted 1:10 and qPCR was performed with SYBR Green Master Mix (ThermoFisher Scientific #4368706).
Genetically engineered mouse model experiments
Tumor-bearing mice were treated with osimertinib at 25mg/kg for five consecutive days each week (5 days on/2 days off) when their tumor size reached around 300–500mm3. The treatment lasted for 4 weeks before mouse lungs were excised. Tumor burden was measured by MRI at least once before treatment and once before sacrifice (see Supplementary information for additional details).
Data and code availability
RNA-seq data have been deposited in the NCBI Genome Expression Omnibus (GEO) under the accession code GSE150949. Watermelon library and plasmid are available on Addgene (IDs: 155257 and 155258). Code is available on https://github.com/yaaraore/watermelon (additional code is available upon request).
Statistical analyses
Statistical tests and graphing of data were performed with GraphPad Prism v.7.0a and R v. 3.6.1 unless noted otherwise. Unless otherwise noted, P values were calculated using unpaired, two-tailed t-tests assuming unequal variance. Multiple hypothesis correction was done using Holm’s method.
Extended Data
Extended Data Figure 1. Lineage detection efficacy and fluorescent dilution capacity of the Watermelon library.
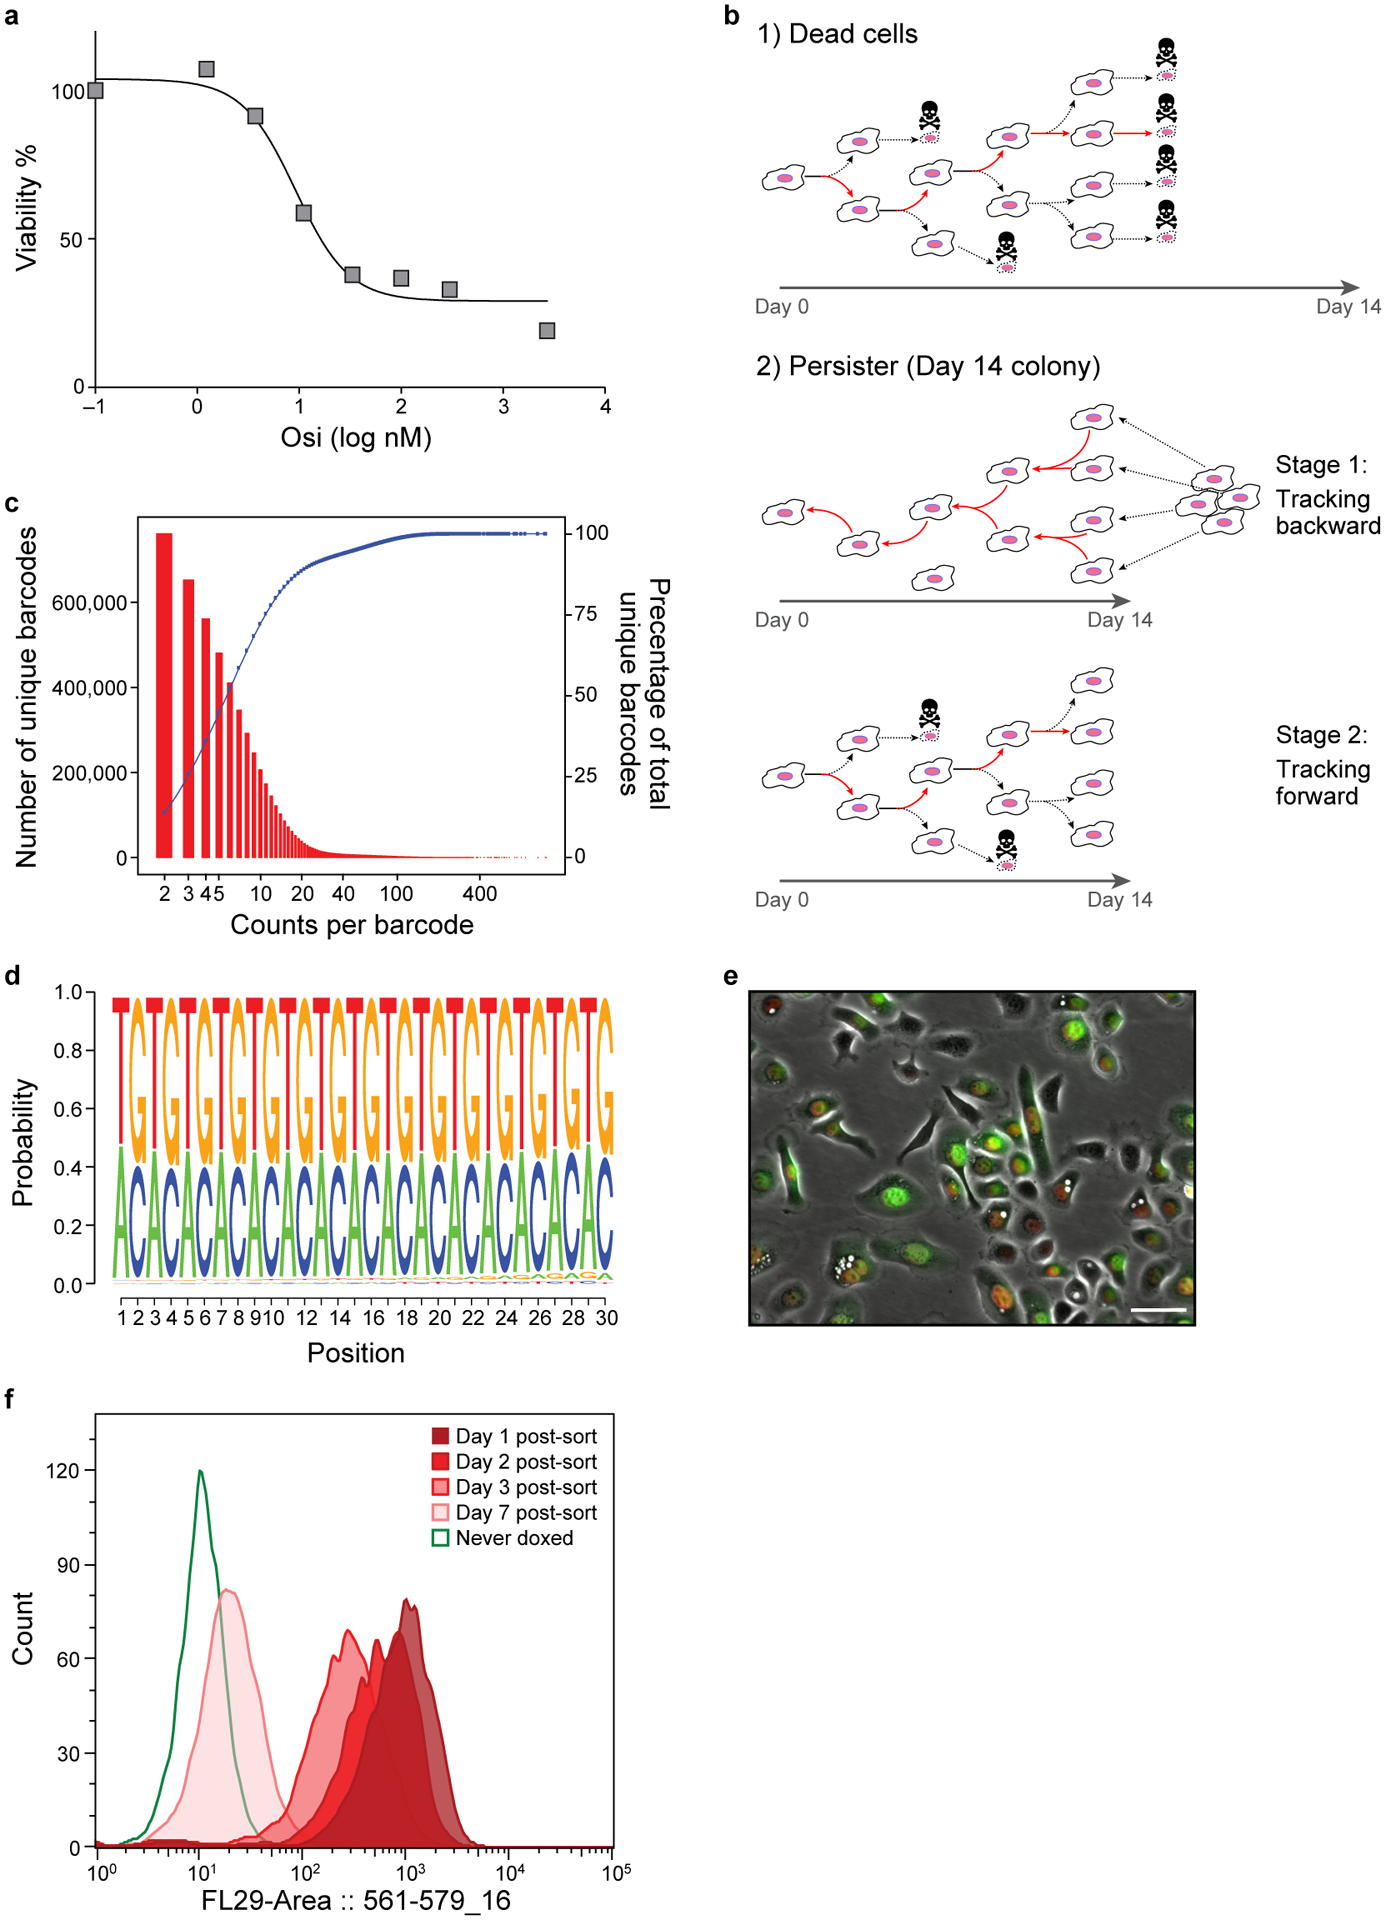
a. Viability of PC9 cells treated osimertinib. % of viable PC9 cells (y axis) after 72hr of treatment with osimertinib at different concentrations (x axis). b. Schematic of tracking. (1). Tracking of non-persister cells. Red arrows: cell that was tracked in the lineage. (2). Tracking of persister cells. Colonies detected at day 14, and the time lapse is viewed and tracked from day 14 backward to day 0 to detect the common initiator cell. After the initiator cell is detected, this initiator is tracked forward as in a (red line indicates the tracked cell). c. Watermelon library complexity. Distribution of number of unique lineage barcodes (y axis, red bars) in a Watermelon plasmid library sequenced at a depth of ~68×106 reads. Blue curve: cumulative wealth distribution of unique barcodes. d. Watermelon library sequence diversity. Sequence logo of nucleotide composition at each position (x axis) relative to the beginning of the barcode sequence of 5,472,944 unique lineage barcodes detected in the Watermelon library. e. PC9-Watermelon cell line grown in dox containing media. A merge of the green, red and bright field channels is shown. Scale bar 20μm. f. Fluorescence dilution of H2B-mCherry over time reports proliferative history. Distributions of mCherry fluorescence level (x axis) for n=3000 cells analyzed by flow cytometry at each time point (color legend) from cells transduced with the Watermelon vector, exposed to dox for 48 hours, sorted for red positive cells and seeded in separate wells at t=0 (Methods). Data are representative of two independent experiments.
Extended Data Figure 2. scRNA-Seq along a time course of osimertinib treated PC9-Watermelon cells.
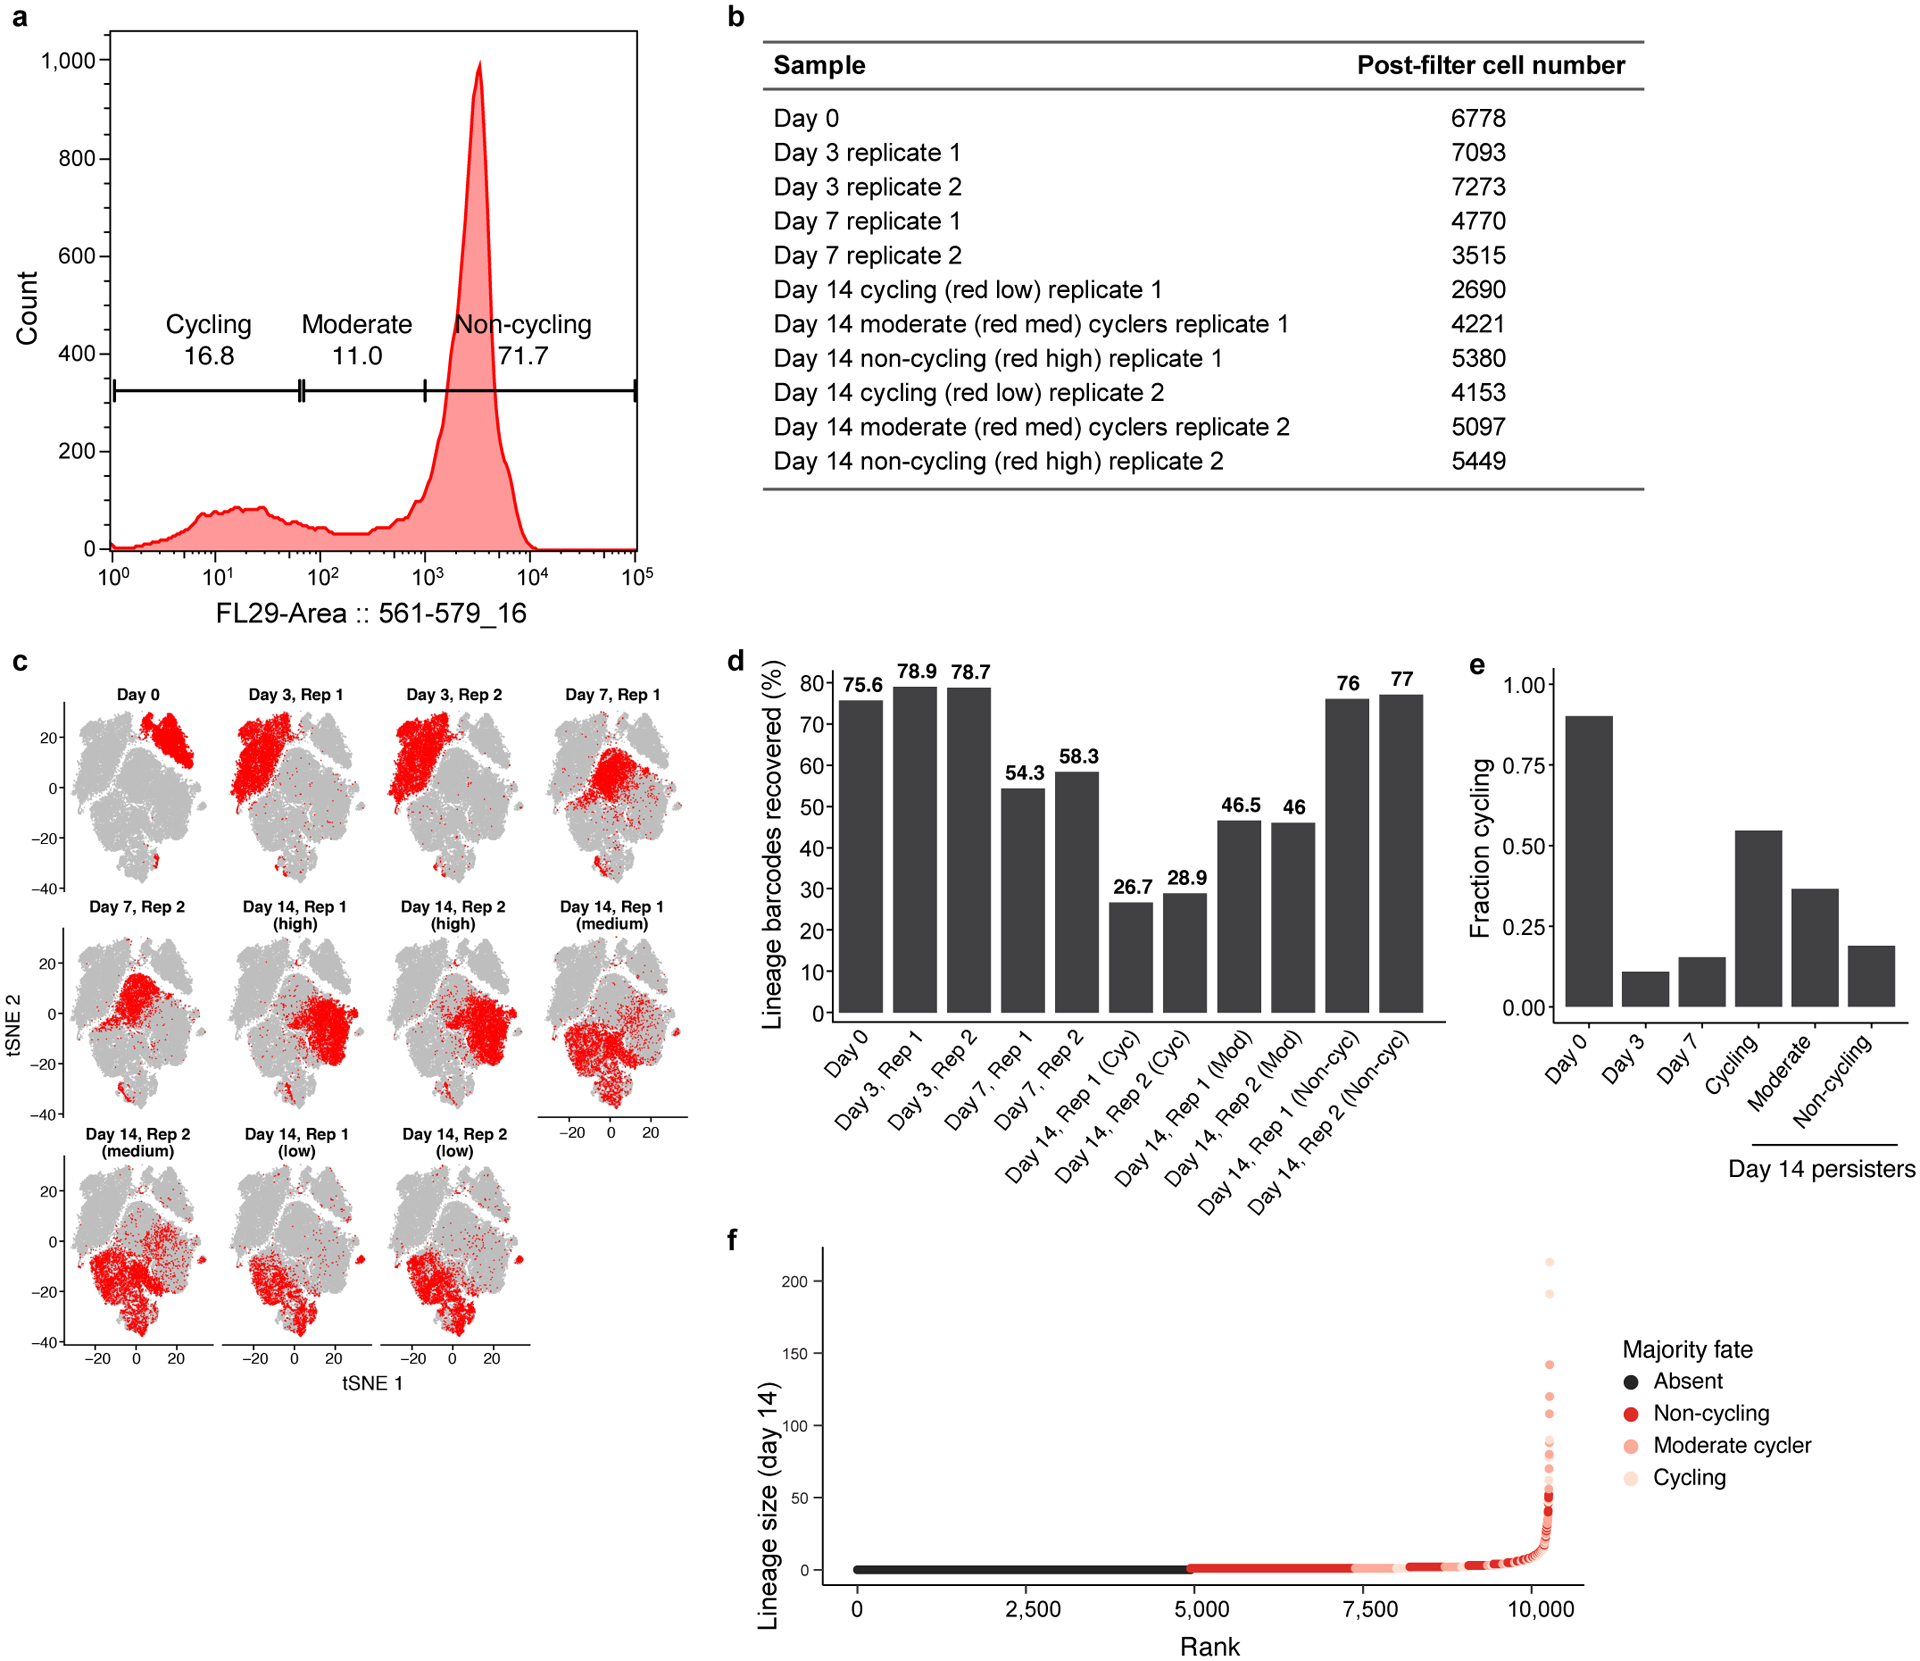
a. Sorting strategy. Distribution of mCherry fluorescence level (x axis) in Watermelon-PC9 cells gates at day 14 of osimertinib treatment, marked by representative sorting gates using to sort three persister subpopulations: cycling, moderate cyclers and non-cycling. b. Number of high-quality cells profiled in each sample. c. Changes in expression profiles following treatment. t-stochastic neighborhood embedding (tSNE) of 56,419 PC9-Watermelon cell profiles (dots), colored (red) by the labeled time point. d. Assignment of cells to lineages by lineage barcode. Percent of cells (y axis) at each time point/subpopulation (x axis) that have a detected lineage barcode. e. Identification of cycling cells. Percent of cells (y axis) at each time point/subpopulation (x axis) that express either the G2/M or S phase signature. f. Majority fate. Clone size on day 14 (y axis) of each persister lineage barcode inferred from scRNA-seq ordered by ascending rank order (x axis) and colored by majority fate based on flow sample provenance of the captured cells.
Extended Data Figure 3. Estimates of lineage diversity.
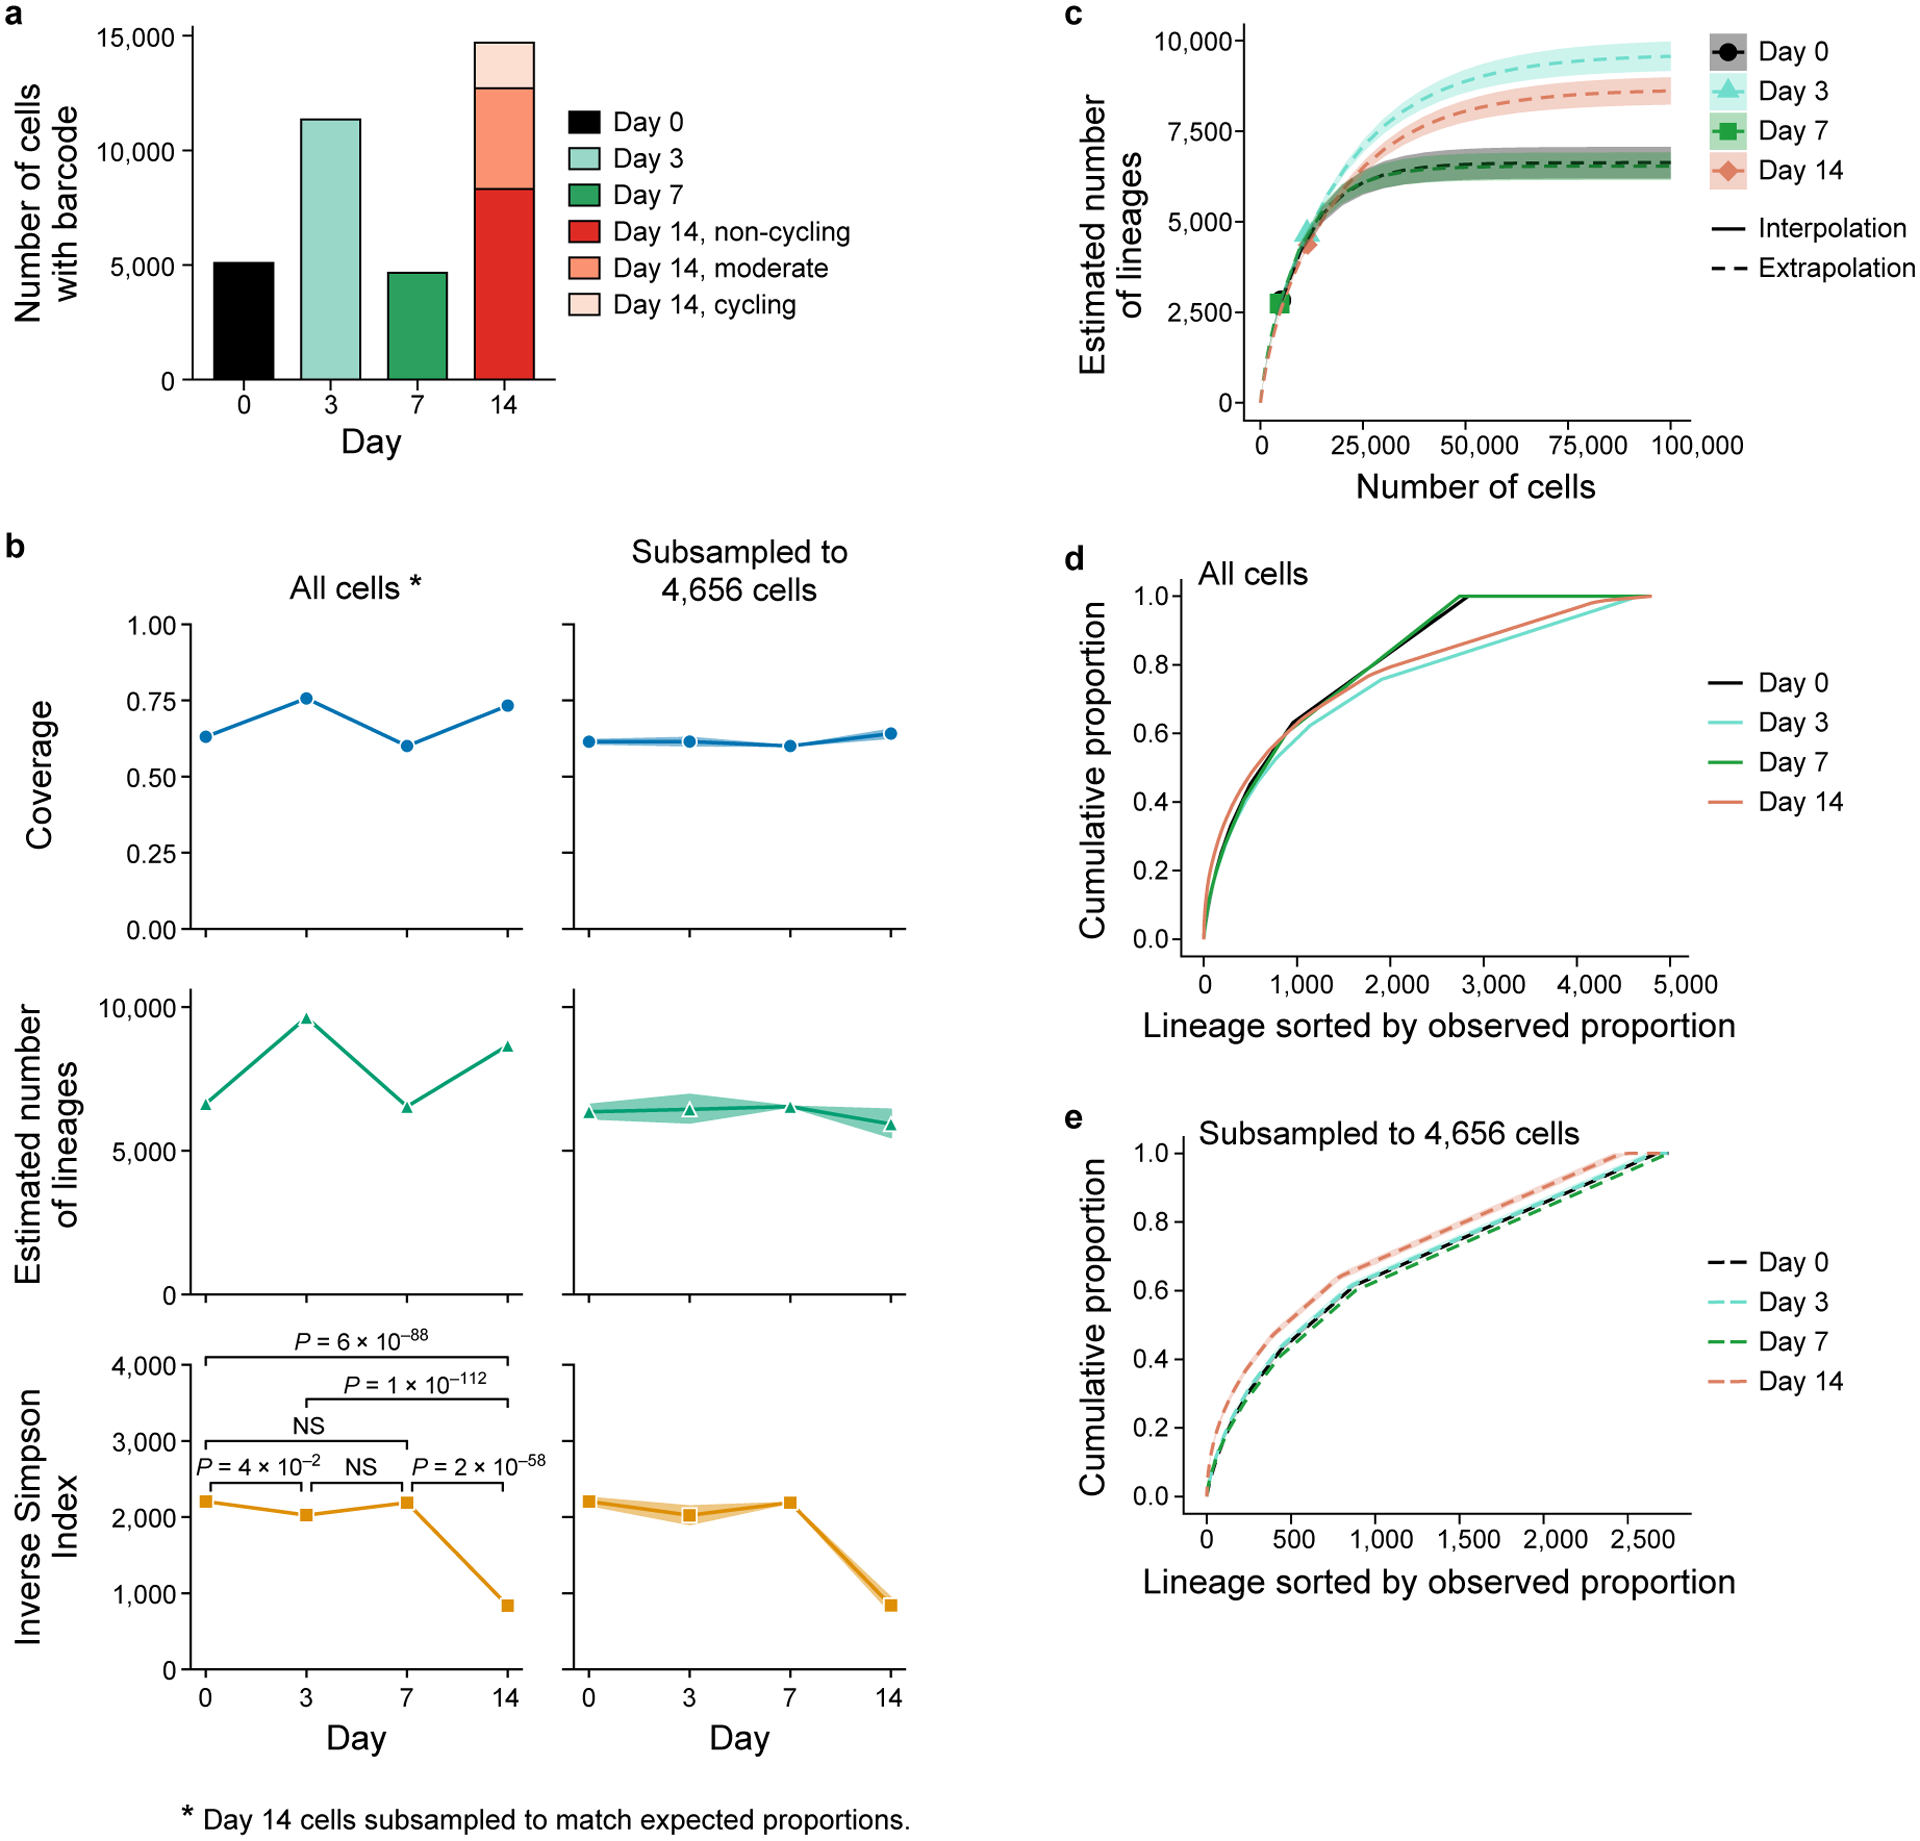
a. Difference in number of cells profiled per timepoint. Number of cells (y axis) with captured lineage barcode at each day (x axis). Day 14 cells are partitioned by the three mCherry populations (legend). b-e. Species diversity estimators can be biased by coverage. Estimated sample coverage (cumulative proportion of all lineages in the total population that were observed, top, y axis, Methods), estimated number of lineages in the population (middle, y axis, Methods), and estimated inverse Simpson Index, also known as Hill number of order 2 (bottom, y axis, Methods) at each timepoint (x axis), computed from all cells with barcodes (left) or subsampled without replacement to match the smallest number of cells per timepoint, 4,656 cells on day 7 (right). Confidence bands (shaded area) indicate the empirical pointwise 95% coverage confidence interval over 1,000 subsampling repetitions. Since standard species richness estimators are not suited for the analysis of estimated proportions from stratified sampling, we randomly subsampled 8,320, 1,949, and 1,276 day 14 cells without replacement from the cycling and moderate cyclers and non-cycling population, respectively (left panel, for unsorted population proportions see Extended Data Fig. 2a). P-values obtained by (asymptotic) two-sided Welch’s t-test with bootstrap estimated standard errors, Holm-corrected with level 5% (Methods, n = 5,087, day 0, n = 11,348, day 3, n = 4,656, day 7, n = 11,545, day 14 subsampled) c. Alternative estimates of number of lineages with rarefaction. Rarefaction curves for the expected observed number of different lineages (y axis) at varying hypothetical sample sizes (x axis) for each timepoint (colored lines). Actual number of observed lineages: marker; Interpolated results: solid lines; Extrapolation beyond the observed number: dashed lines. Day 14 cells were subsampled as done for the estimation of the number of lineages in the right-hand side panels of (b). Shaded areas: confidence bands at 95% confidence level. d,e. Estimated cumulative proportion (eCDF) of lineages in the total population (y axis) sorted in decreasing order of estimated lineage proportion (x axis) for each timepoint (colored lines) when estimating the proportion from all sequenced cells with barcodes (d) or subsampled to 4,656 cells (e) as in (b). Subsampling (b,e) and rarefaction (c) facilitate comparison between different timepoints since estimators of population diversity are strongly biased by sample size. Confidence bands indicate the empirical pointwise 95% coverage confidence interval over 1000 repetitions of the subsampling.
Extended Data Figure 4. Lineage fate analysis.
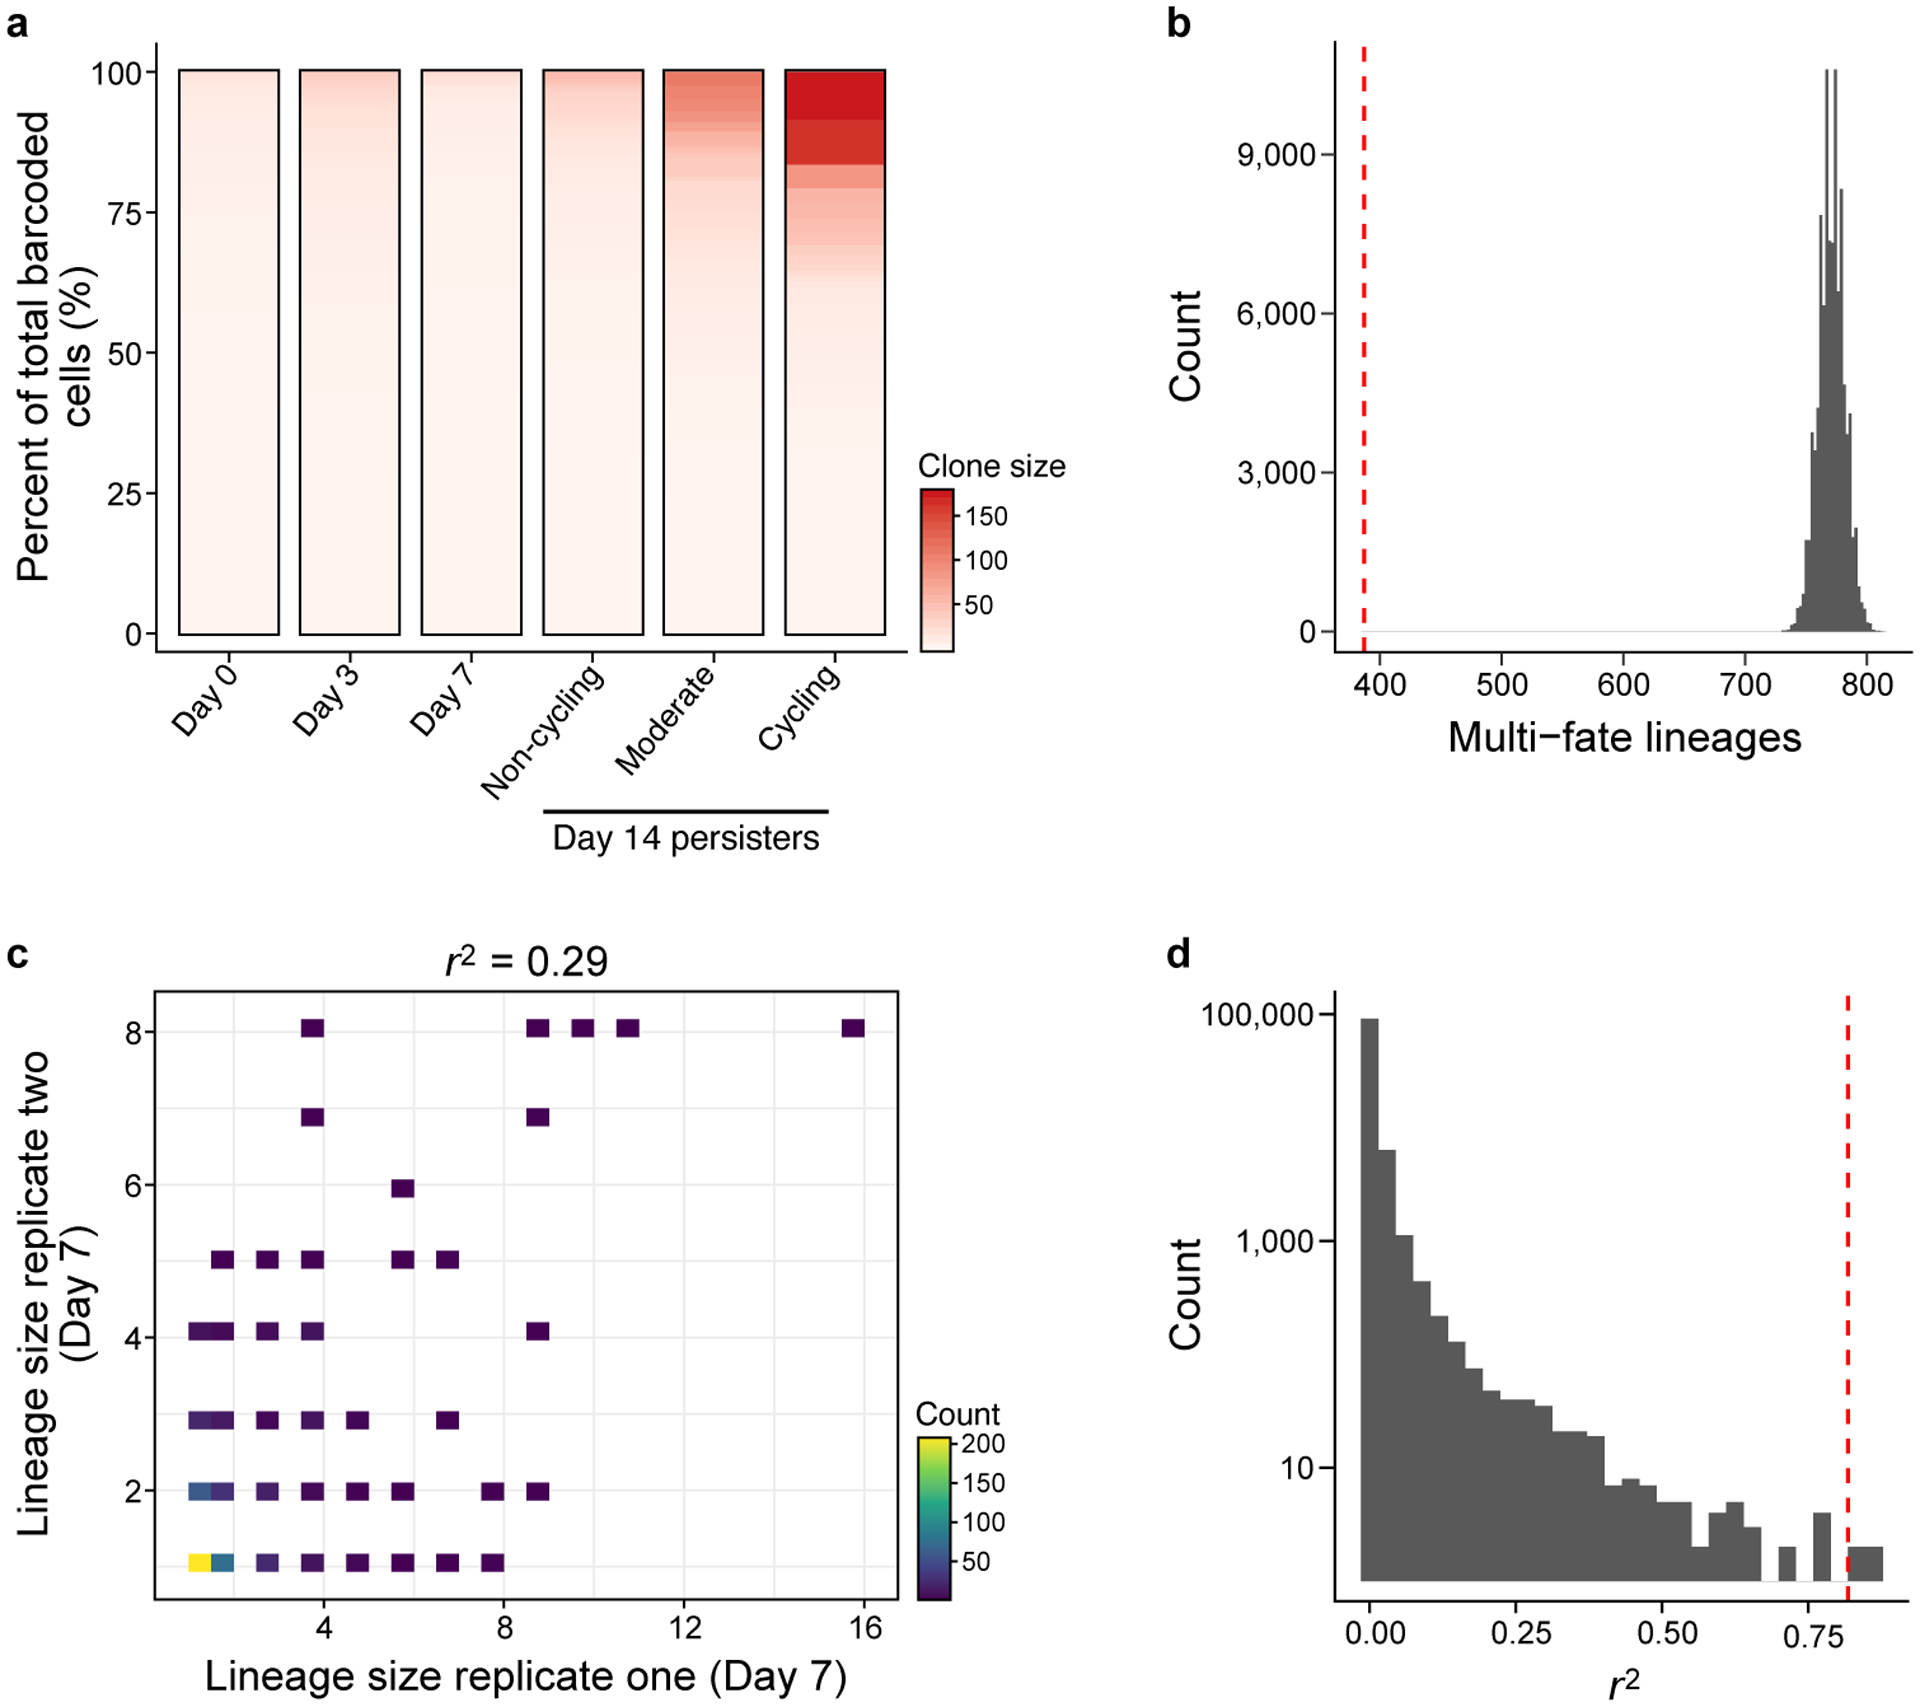
a. Single cell-derived clone size by sample. In each sample, detected barcodes were sorted in descending order by the sum of their counts. Each unique lineage barcode was accounted as a separate clone. b. The number of observed multi-fate lineages is significantly smaller (P = 1×10⁻⁵) than expected by chance. Distribution of the number of multi-fate lineages (x axis) in simulated data. Red line: observed number of multi-fate lineages. c,d. Clone size reproducibility is significantly higher than expected by chance. c. Clone size on day 7 of each persister lineage barcode inferred from scRNA-seq (x, y axes) in each of two independent experiments seeded from the same barcoded founding cell population. Top: linear correlation coefficient. d. Distribution of r2 values (x axis) in simulated day 14 data. Red line: observed r2 between the two replicates at day 14.
Extended Data Figure 5. Differences in transcriptional programs and drug response in cycling and non-cycling persisters.
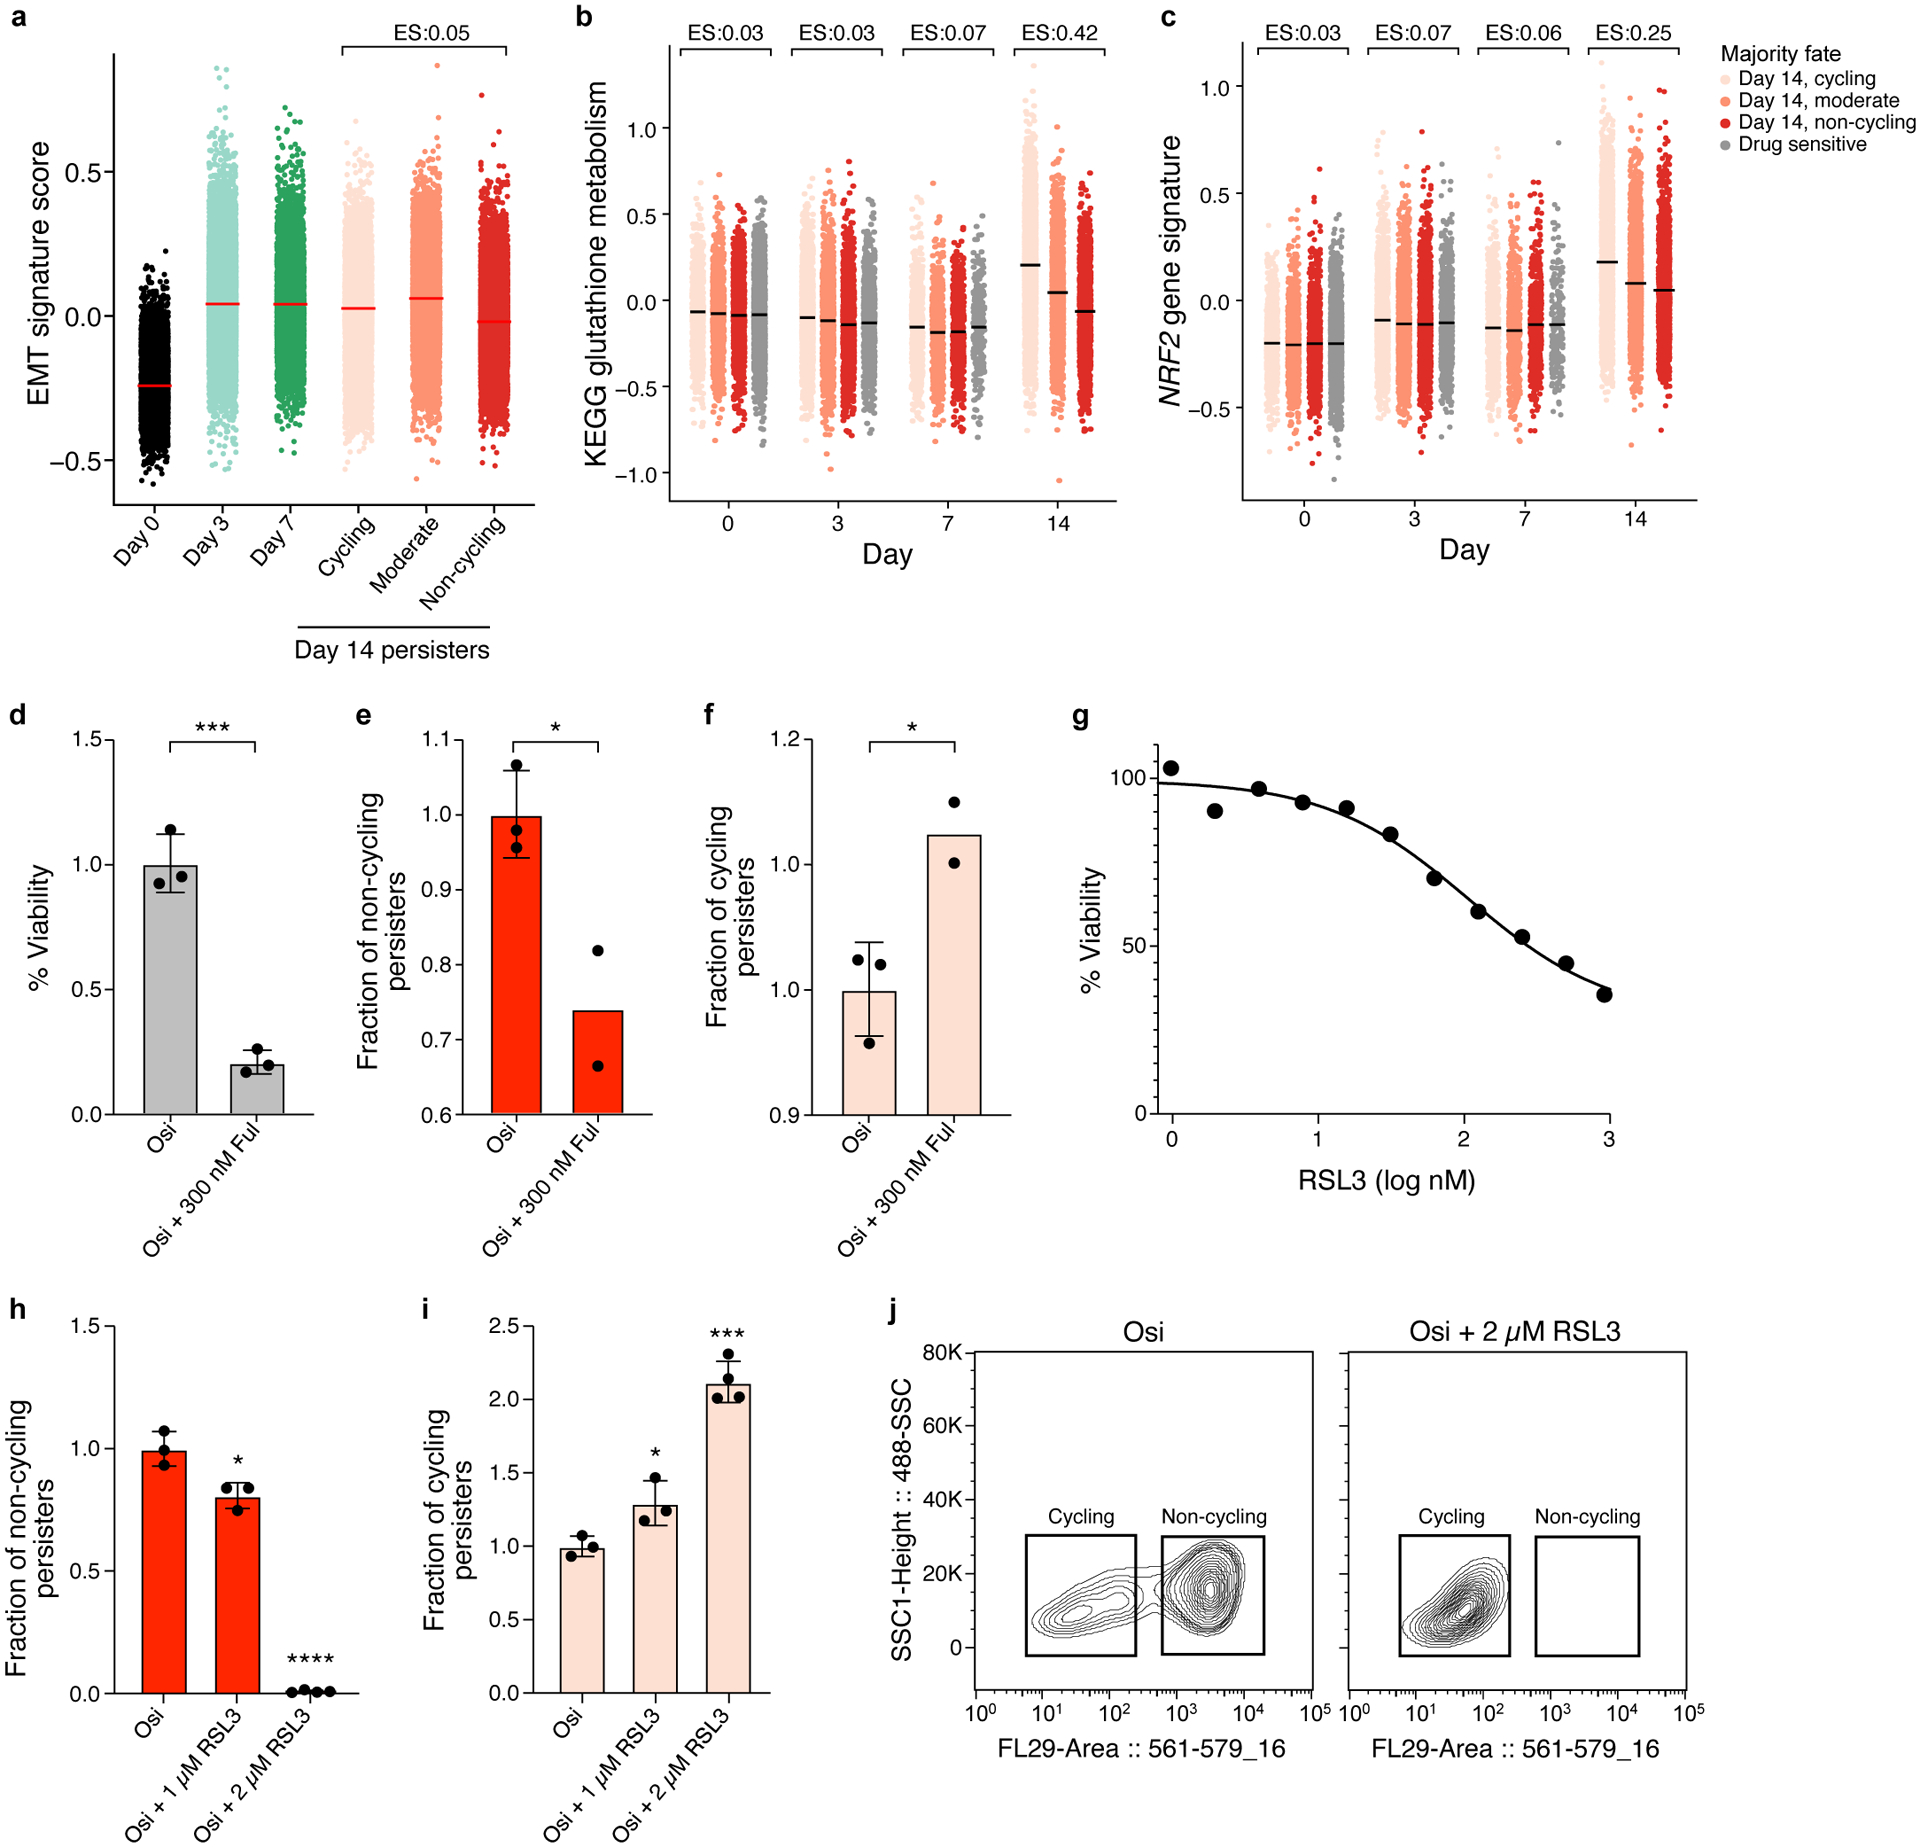
a. EMT signature expression are similar in cycling and non-cycling persisters. Distribution of expression levels of EMT (y axis, log2(TPM+1)) across time points and subpopulations. Effect size (ES, b): difference between the mean signature score of cycling and non-cycling persisters. b-d. Persister populations show differential sensitivity to fulvestrant. Effect of fulvestrant co-treatment (300nM fulvestrant during days 14–20 of 300nM osimertinib) on overall survival (b) non-cycling (c) and cycling cells (d). e-g. Persister populations show differential sensitivity to RSL3. Effect of different doses of RSL3 co-treatment (during days 3–14 of 300nM osimertinib) on overall survival (e) non-cycling (f) and cycling cells (g). h. Co-treatment with 2 μM of RSL3 shifts surviving persister cells to cycling. Distributions of mCherry fluorescence level (x axis) for cells analyzed by flow cytometry with and without RSL3 co-treatment (panel legend). i,j. Higher expression of glutathione metabolism and NRF2 signatures in cycling vs. non-cycling persisters. Signature score (y axis) of glutathione metabolism (i) and NRF2 pathway (j) signatures in cells profiled at each time point (x axis) stratified by their lineage majority fate at day 14 (color legend). Effect size (ES) indicates difference between the mean signature score of cycling and non-cycling persisters. Error bars are mean +/− SD of two (e,f) or three biologically independent experiments (d,h-i). *P < 0.05; **P < 0.01; ***P < 0.001; ****P < 0.0001; two-tailed t-tests compared to osimertinib only condition (d-f, h-i).
Extended Data Figure 6. Correlation between clone size at day 14 and gene expression.
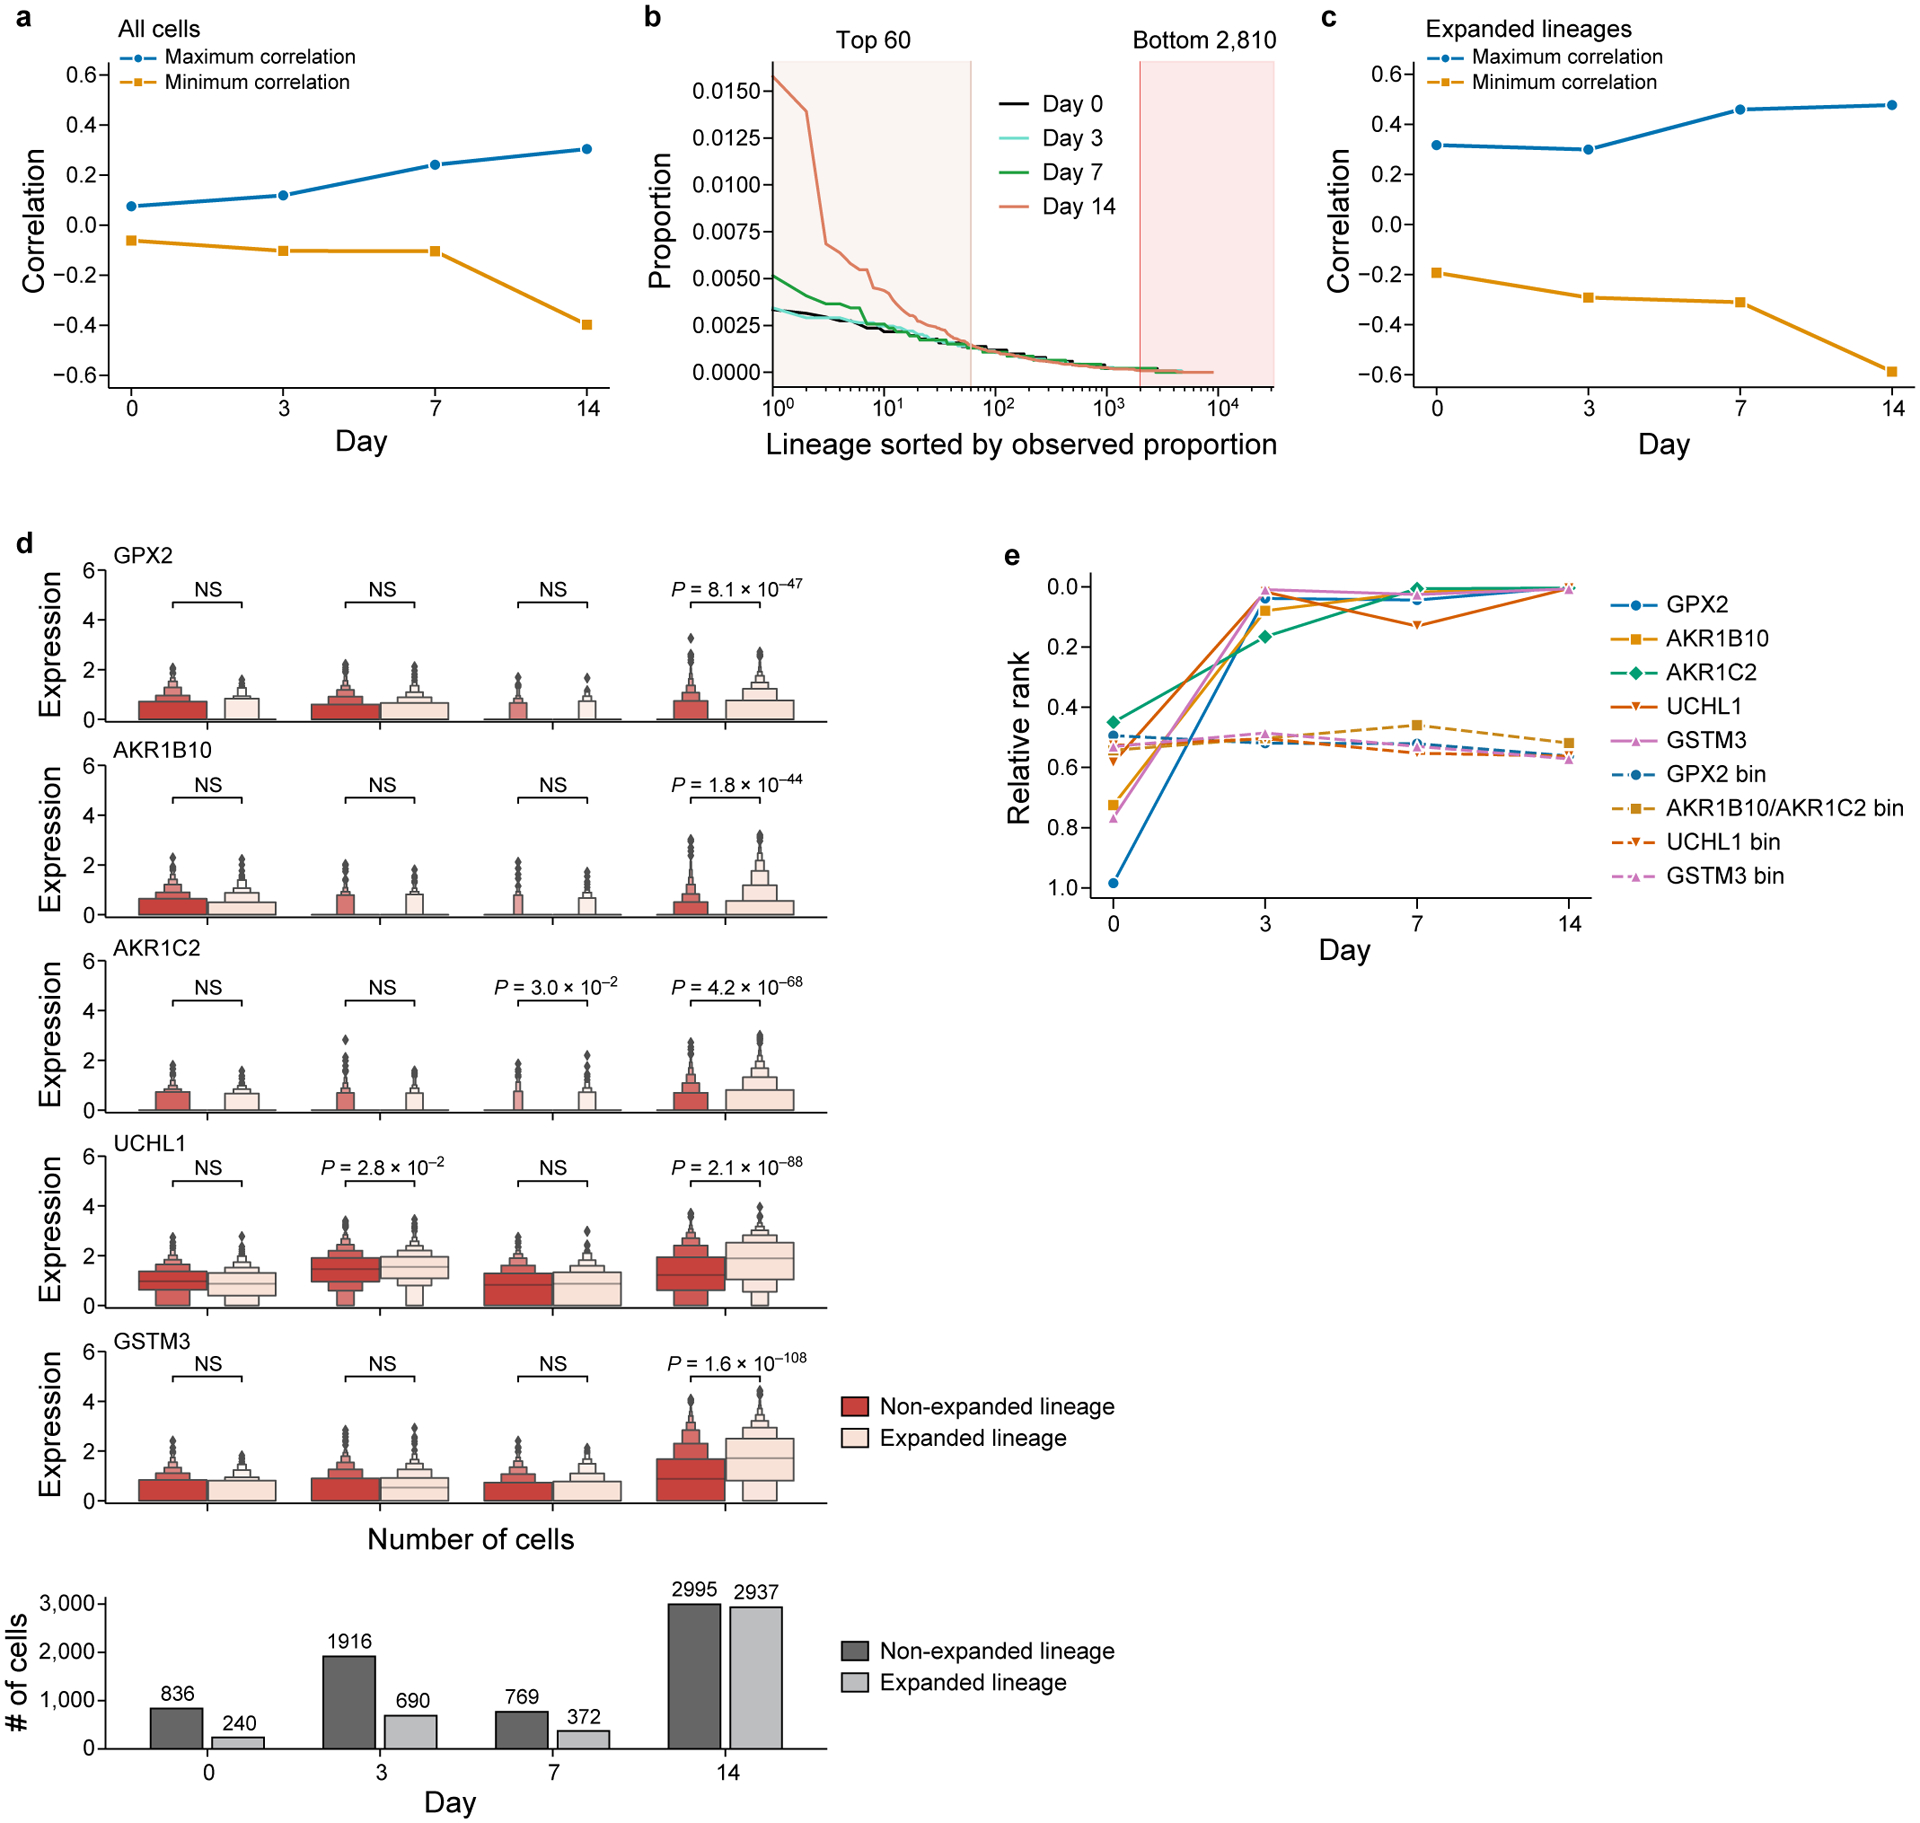
a. Gene expression is progressively more predictive of persister lineages over time. For each timepoint (x axis), maximum (blue) and minimum (orange) over the correlation coefficients (y axis) of each gene and the lineage size at day 14 (also see Fig. 2g). b. Choosing expanded and no-expanded lineages for gene expression comparisons. Cut-offs (vertical lines) for highly expanded and non-expanded lineages on day 14 based on the estimated proportion of each lineage in the population (y axis), sorted by decreasing proportion (x axis, log scale) for each timepoint (colored lines). c. For each timepoint (x axis), maximum (blue line) and minimum (orange line) over the correlation coefficients (y axis) of each gene and the lineage size at day 14 as in (a), but restricted to cells of highly expanded lineages as in (b). d. Genes with top correlation to lineage expansion. Top five rows: distribution of gene expression of top correlated genes (log normalized counts, y axis) at each time point (x axis), comparing cells from non-expanded (red) and expanded (pink) lineages, as defined in (b). Bottom row: numbers of cells (y axis) per timepoint in non-expanded, (dark gray) and expanded (light gray) lineages. Distributions are visualized as enhanced box plots indicating median (gray bar) and geometric progression of quantiles (progressively decreasing box widths for 75th, 87.5th, 93.75th, 96.875th, etc. percentiles, and analogously for 25th, 12.5th, 6.25th, 3.125th, etc. percentiles, labeling up to 1.5625% of the data as outliers). Bonferroni-Holm adjusted P values, determined by a two-sided Mann–Whitney U-test with continuity correction, or no significance (NS, P > 5%). e. Increase in correlation of top correlated genes as early as day 3. For each timepoint (x axis), rank of selected genes’ (colored solid lines) correlation with the lineage size at Day 14 among all genes (y axis), normalized to lie between 0 and 1, and average relative correlation rank of genes with similar mean expression as determined by grouping genes by their mean log-normalized expression over all timepoints combined into 20 bins (colored dashed lines) (Methods).
Extended Data Figure 7. Metabolite profiles of cycling persisters, non-cycling persisters and untreated parental cells and FAO measurements.
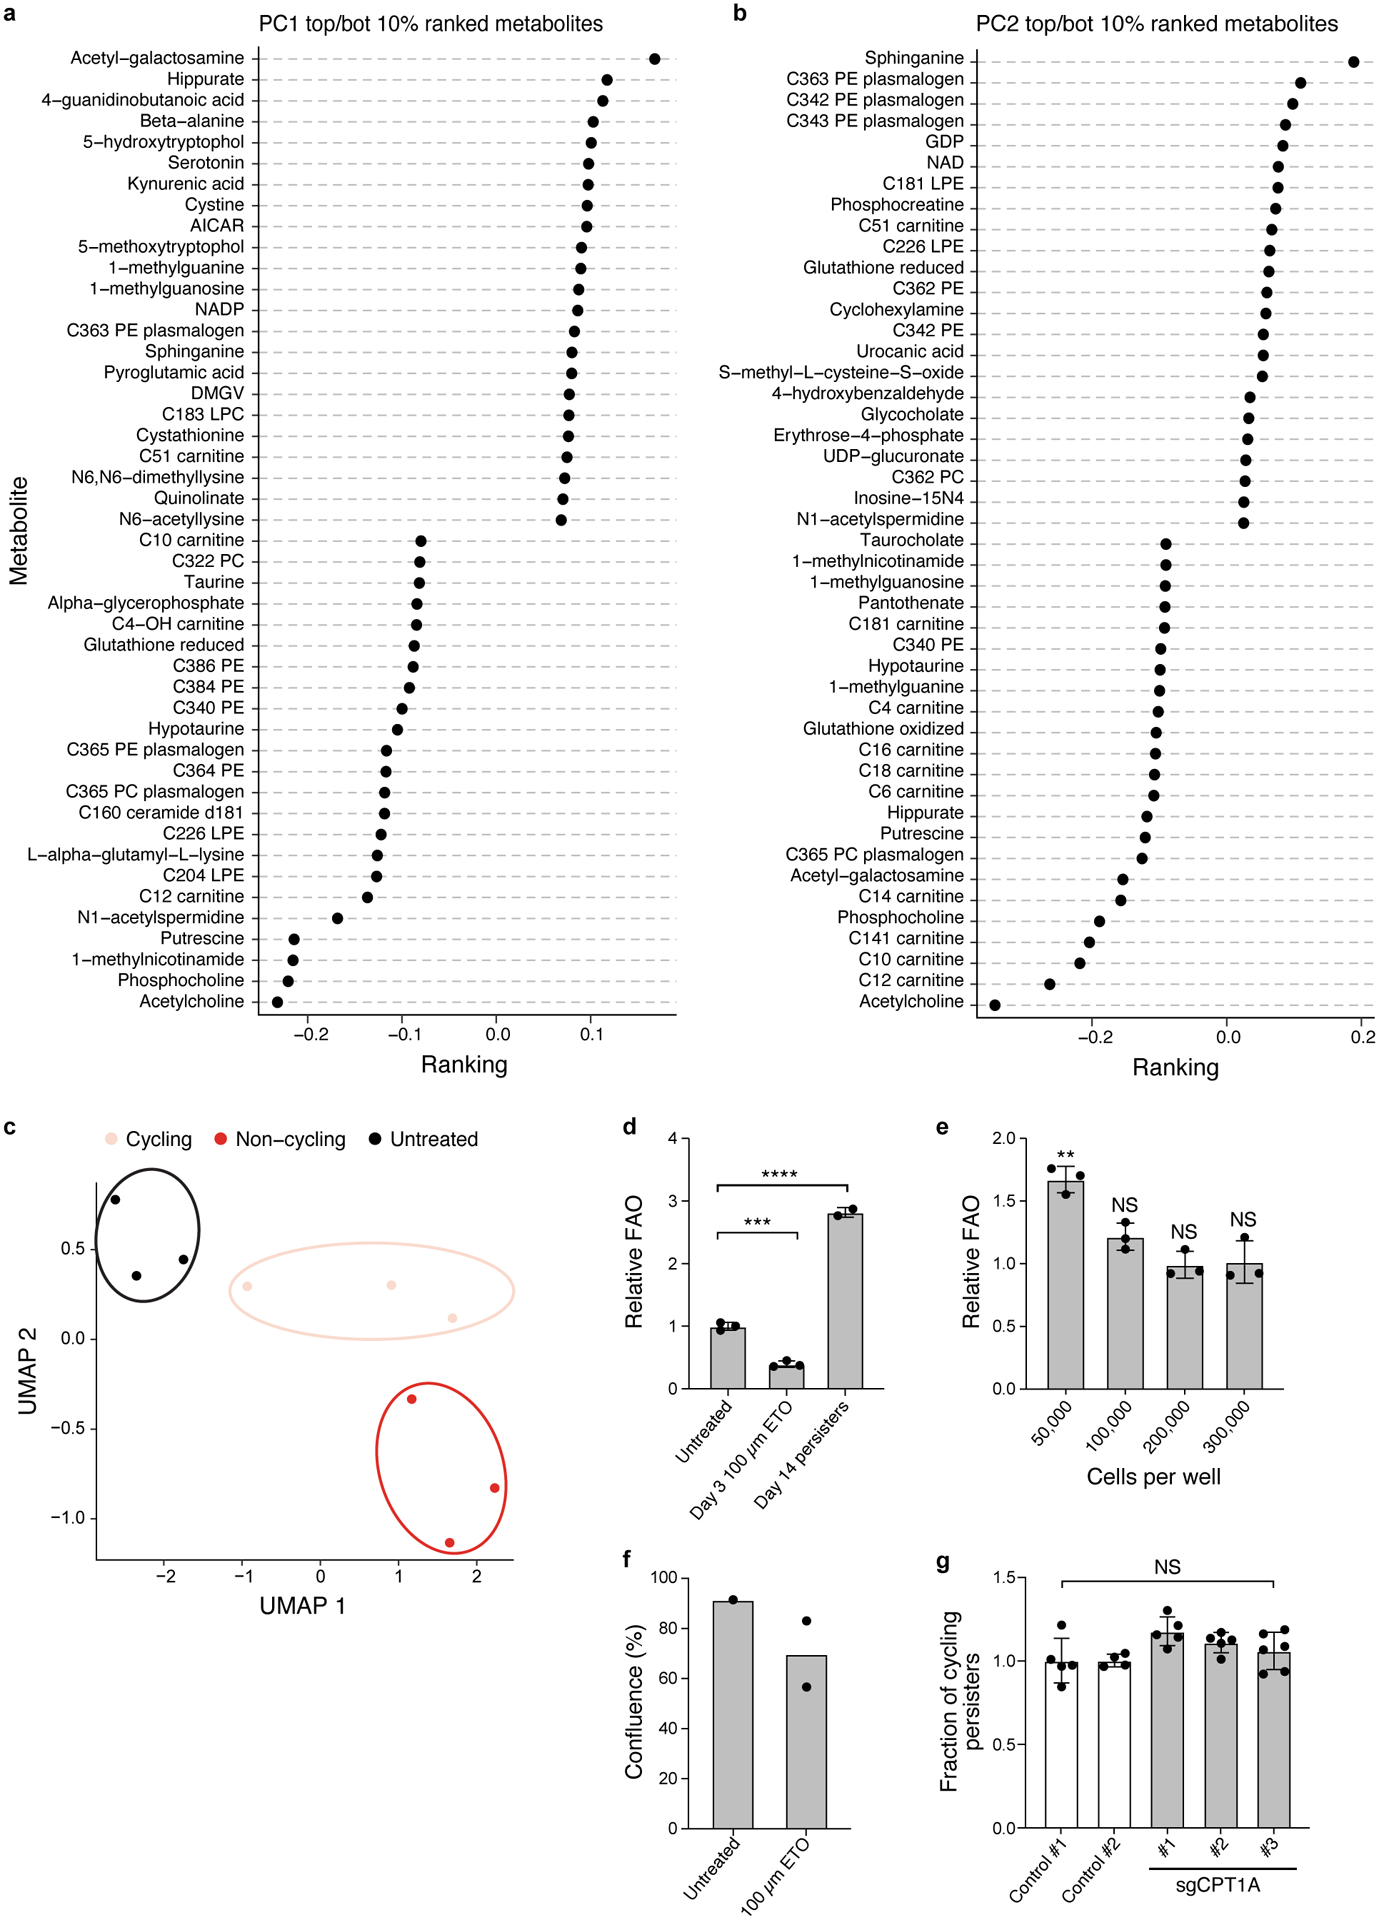
a,b. Principal Component Analysis (PCA) loadings (x axis) for the top 46 metabolites (y axis) associated with PC1 (a) and PC2 (b). c. UMAP representation of metabolomics data. d. Mean fatty acid oxidation (FAO) level (y axis, relative to mean of the untreated controls) measured by 3H-palmitic acid oxidation in PC9-Watermelon cells either untreated, treated only with 100 μM etomoxir for 3 days, or treated with 300nM osimertinib for 14 days. e. Mean FAO levels (y axis, relative to cells seeded at 300,000 per well, as used for the osimertinib time course) in PC9-Watermelon cells seeded at different densities (x axis) 24 hours prior to measurement. two tailed t-tests; **P < 0.01; NS – not significant (compared to 300,000 cells per well). f. Mean confluence (y axis) of PC9-Watermelon cells treated with 100μM Etomoxir for 14 days (Methods). g. Mean fraction of cycling persisters for control and sgCPT1A PC9 cells. Error bars are mean +/− SD of two (f) or three biologically independent experiments (d,e,g). **P < 0.01; ***P < 0.001; ****P < 0.0001; NS, not significant (P > 0.05); two-tailed t-tests (e-g).
Extended Data Figure 8. Single cell analysis of multiple watermelon persister models.
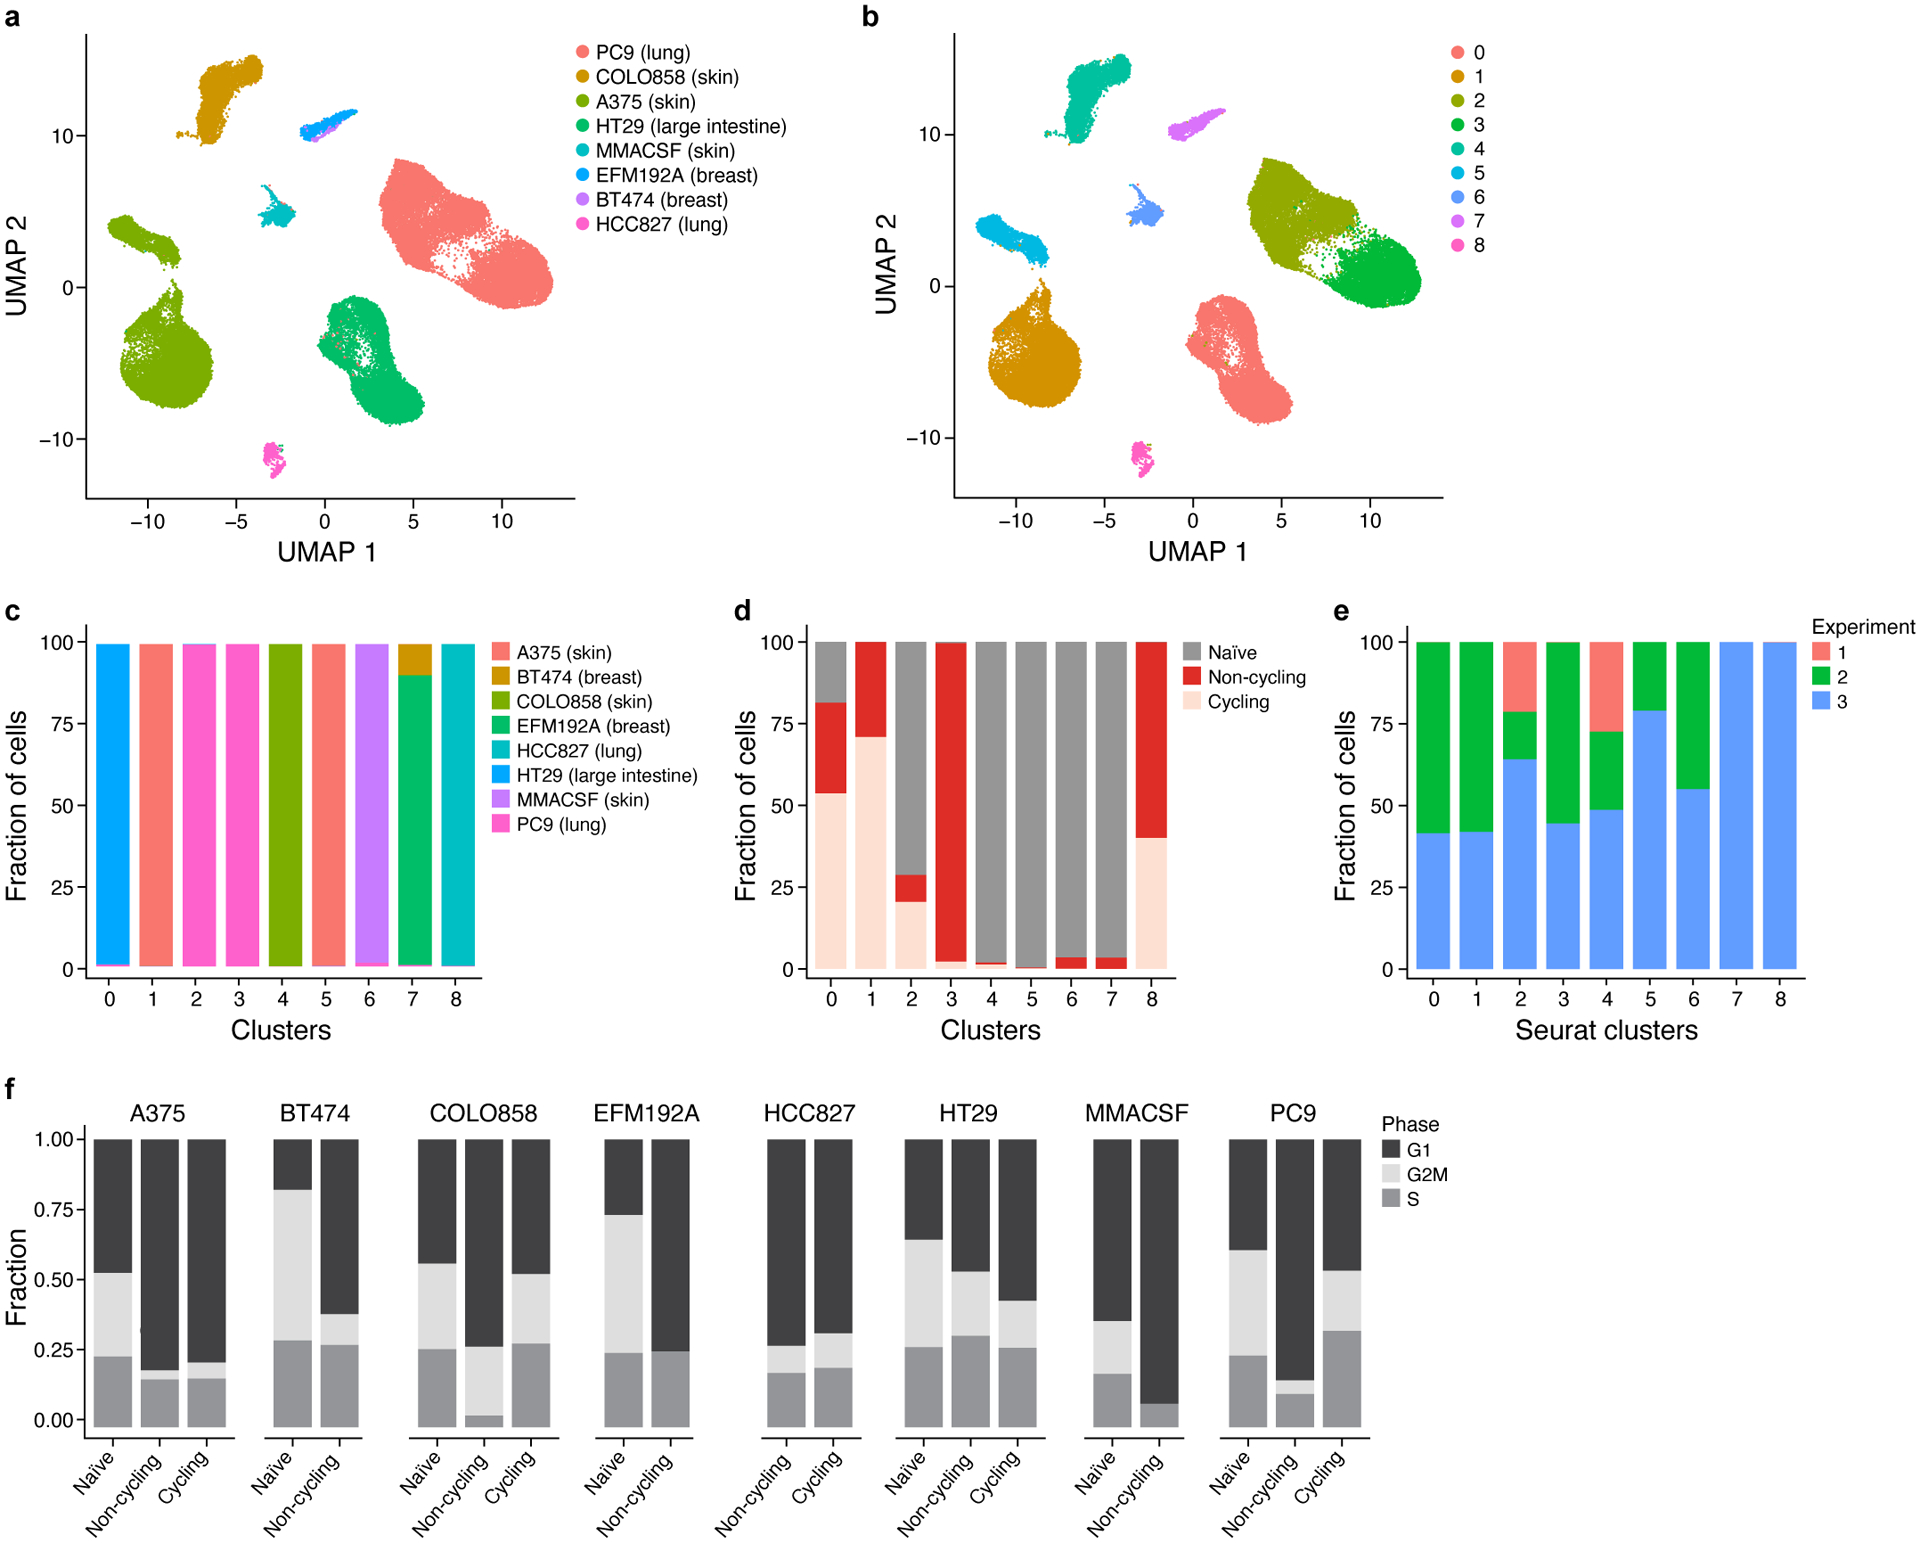
a,b.UMAP representation of cells colored by cell line (a) and cluster identify (b).c-e, Fraction of cells (y axis) in each cluster (x axis) colored by cell line (c), treatment (d) and experimental replicate (e). f. Proportion of cells (y axis) in each cell cycle phase (colored stacked bars) based on cell cycle scores inferred from scRNA-seq data across cell line models.
Extended Data Figure 9. Modeling minimal residual disease using an engineered transgenic mouse model.
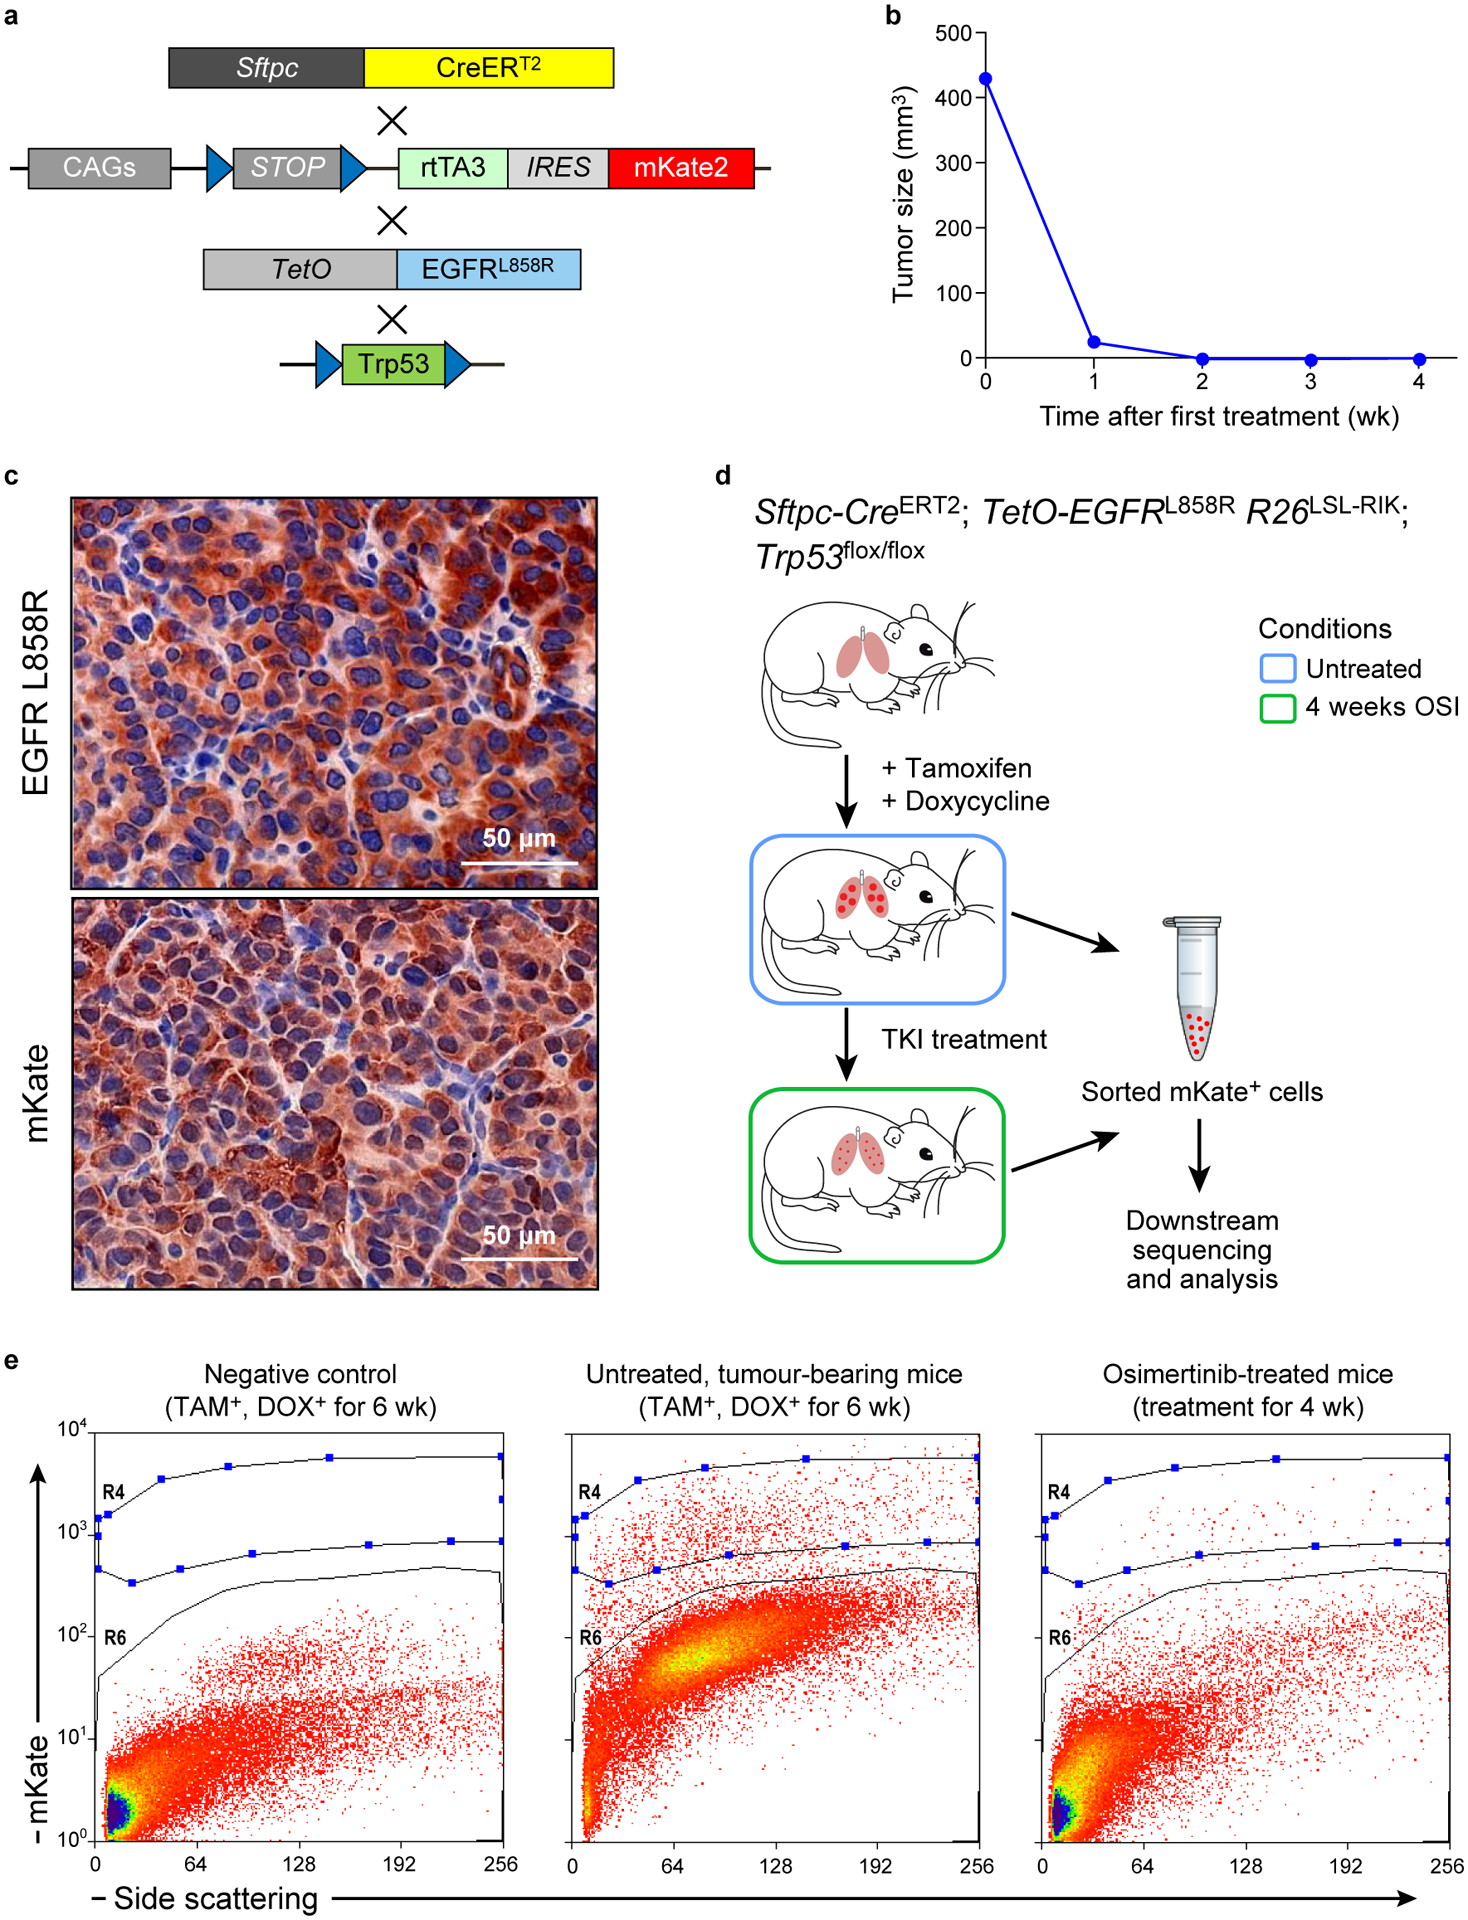
a. Transgenic composition of the EGFRL858R genetically engineered mouse model used in this study. b. Tumor burden in a osimertinib-treated representative mouse as measured by MRI. c. IHC staining for EGFR L858R mutant and mKate in treatment-naïve mouse lung tumors. d. Experimental schema for molecular profiling of mKate+ cells isolation. e. Flow gating scheme for mKate+ cells. R4 cells from untreated and MRD-bearing mice were sorted and subjected to sequencing. mKate negative cells (R6). Images in c are representative of three independent experiments.
Extended Data Figure 10. Changes in expression of metabolic programs in patient tumors.
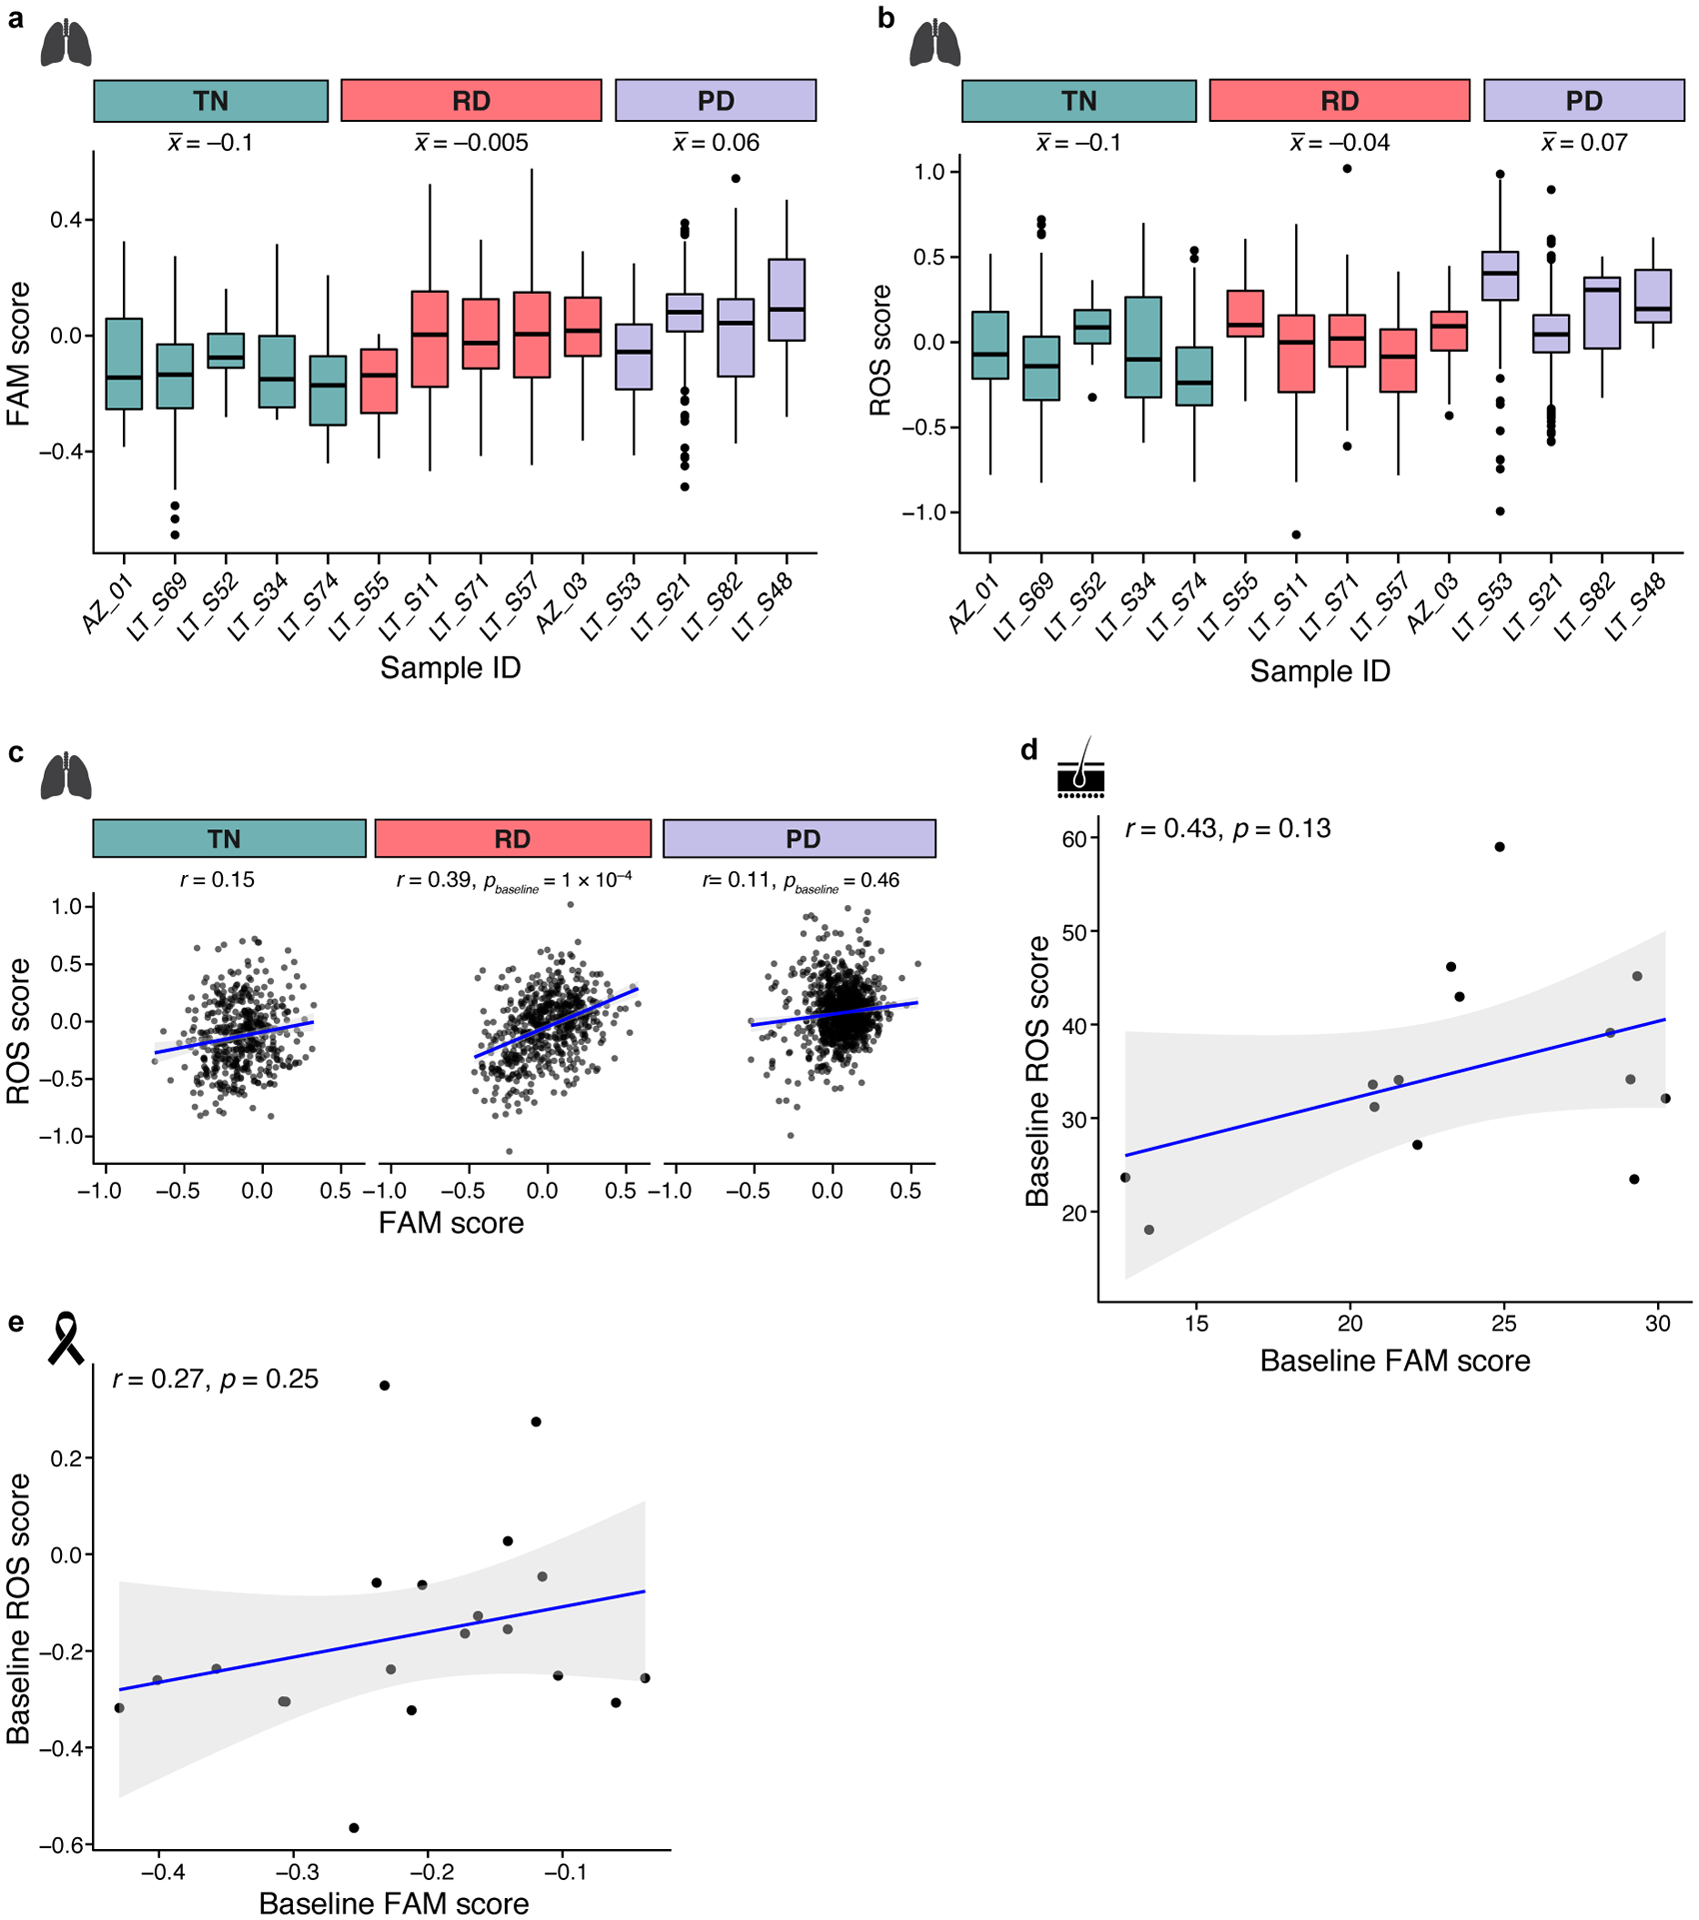
a,b. Increase in fatty acid metabolism and ROS pathway signatures in drug-treated human lung adenocarcinoma. Distribution of expression scores of FAM (a) and ROS (b) signatures in cells from individual EGFR-driven lung adenocarcinoma tumors (with more than 10 cells) across different treatment timepoints (x axis). Box plots are represented by center line, median; box limits, upper and lower quartiles; whiskers extend at most 1.5× interquartile range past upper and lower quartiles. : Mean signature level for time point. For number of cells per patient see Supplementary Table 3. c-e. Correlation between ROS (y axis) and FAM (x axis) signature scores in (c) treatment naïve (TN), residual disease (RD) and progressive disease (PD) human lung adenocarcinoma, (d) treatment naïve melanoma, and (e) treatment naïve breast cancer. Significance based on bootstrap test (c, Methods) and t distribution (d,e). 95% confidence interval (d-e, shaded area).
Supplementary Material
Supplementary Table 5. Gene signature list
Supplementary Table 1. Mean signatures expression of the three different persister subpopulations
Supplementary Table 2. pooled experiment cell number by model information
Supplementary Table 3. Patient information
Supplementary Table 4. Primers used in this study
Acknowledgments.
We thank the Broad Cytometry Facility (P. Rogers, S. Saldi, C. Otis and N. Pirete); Leslie Gaffney and Ania Hupalowska for help with figure preparation and artwork; and Angie Martinez Gakidis for scientific editing. We also thank the Yale Center for Genome Analysis (F. Lopez-Giraldez and D. Zhao) and the Yale Center for Research Computing for data processing, guidance, RNA-seq, and use of the research computing infrastructure, specifically the Ruddle Cluster. YO is supported by the Hope Fund for Cancer Research, Grillo-Marxuach Postdoctoral Fellowship and the Rivkin Scientific Scholar Award. MT was supported by the American Cancer Society - New England Pay-if Group Postdoctoral Fellowship, PF-18-126-01-DMC. HFC was supported by a V Foundation Scholar Award (D2015-027). PIT is supported by an NIH F32 Postdoctoral Fellowship from National Institute of Allergy and Infectious Disease (1F32AI138458-01). Funding for breast cancer patient study came from grants from Sanofi and GlaxoSmithKline. ANH was supported by NIH/NCI K08 CA197389.SH was supported in part by NCI/NIH CA016042 as well as the Marni Levine Memorial Research Award. BH received support from a Lo Graduate Fellowship for Excellence in Stem Cell Research. Additional support came from R01CA121210, R01CA120247 and P50CA196530. Yale Cancer Center Shared Resources used in this article were in part supported by NIH/NCI Cancer Center Support Grant P30 CA016359. The work was supported by the Klarman Cell Observatory, the NHGRI Center for Cell Circuits, and HHMI (AR) as well as by the Breast Cancer Research Foundation-BCRF-16-020 and the Sheldon and Miriam Adelson Medical Research Foundation (JSB).
Competing Interests statement. AR is a co-founder and equity holder of Celsius Therapeutics, an equity holder in Immunitas, and was a SAB member of ThermoFisher Scientific, Syros Pharmaceuticals, Neogene Therapeutics and Asimov until July 31, 2020. From August 1, 2020, A.R. is an employee of Genentech. YO, AR and JSB are inventors on US patent application 16/563,450 filed by the Broad Institute to expressed barcode libraries as described in this manuscript. CPF is now an employee of Bristol Myers Squibb. KP is co-inventor on a patent licensed to Molecular MD for EGFR T790M mutation testing (through MSKCC). KP has received Honoraria/Consulting fees from Takeda, NCCN, Novartis, Merck, AstraZeneca, Tocagen, Maverick Therapeutics, Dynamo Therapeutics, Halda and research support from AstraZeneca, Kolltan, Roche Boehringer Ingelheim and Symphogen. ANH a consultant for Nuvalent and is supported by Novartis, Pfizer, Amgen, Blueprint Medicines, Lilly, Roche/Genetech, Nuvalent, Relay Therapeutics. SH has contracted research with Ambrx, Amgen, Astra Zeneca, Arvinas, Bayer, Daiichi-Sankyo, Genentech/Roche, Gilead, GSK, Immunomedics, Lilly, Macrogenics, Novartis, Pfizer, OBI Pharma, Pieris, PUMA, Radius, Samumed, Sanofi, Seattle Genetics, Dignitana, Zymeworks, Phoenix Molecular Designs, Ltd. and Lilly and Stock Options in NK Max.
References
- 1.Salgia R & Kulkarni P The Genetic/Non-genetic Duality of Drug ‘Resistance’ in Cancer. Trends Cancer 4, 110–118, doi: 10.1016/j.trecan.2018.01.001 (2018). [DOI] [PMC free article] [PubMed] [Google Scholar]
- 2.Vallette FM et al. Dormant, quiescent, tolerant and persister cells: Four synonyms for the same target in cancer. Biochem Pharmacol 162, 169–176, doi: 10.1016/j.bcp.2018.11.004 (2019). [DOI] [PubMed] [Google Scholar]
- 3.Sharma SV et al. A chromatin-mediated reversible drug-tolerant state in cancer cell subpopulations. Cell 141, 69–80, doi: 10.1016/j.cell.2010.02.027 (2010). [DOI] [PMC free article] [PubMed] [Google Scholar]
- 4.Hata AN et al. Tumor cells can follow distinct evolutionary paths to become resistant to epidermal growth factor receptor inhibition. Nat Med 22, 262–269, doi: 10.1038/nm.4040 (2016). [DOI] [PMC free article] [PubMed] [Google Scholar]
- 5.Tirosh I et al. Dissecting the multicellular ecosystem of metastatic melanoma by single-cell RNA-seq. Science 352, 189–196, doi: 10.1126/science.aad0501 (2016). [DOI] [PMC free article] [PubMed] [Google Scholar]
- 6.Taniguchi H et al. AXL confers intrinsic resistance to osimertinib and advances the emergence of tolerant cells. Nat Commun 10, 259, doi: 10.1038/s41467-018-08074-0 (2019). [DOI] [PMC free article] [PubMed] [Google Scholar]
- 7.Dhimolea E et al. An Embryonic Diapause-like Adaptation with Suppressed Myc Activity Enables Tumor Treatment Persistence. Cancer Cell 39, 240–256 e211, doi: 10.1016/j.ccell.2020.12.002 (2021). [DOI] [PMC free article] [PubMed] [Google Scholar]
- 8.Rehman SK et al. Colorectal Cancer Cells Enter a Diapause-like DTP State to Survive Chemotherapy. Cell 184, 226–242 e221, doi: 10.1016/j.cell.2020.11.018 (2021). [DOI] [PMC free article] [PubMed] [Google Scholar]
- 9.Raoof S et al. Targeting FGFR overcomes EMT-mediated resistance in EGFR mutant non-small cell lung cancer. Oncogene 38, 6399–6413, doi: 10.1038/s41388-019-0887-2 (2019). [DOI] [PMC free article] [PubMed] [Google Scholar]
- 10.Zhu X, Chen L, Liu L & Niu X EMT-Mediated Acquired EGFR-TKI Resistance in NSCLC: Mechanisms and Strategies. Front Oncol 9, 1044, doi: 10.3389/fonc.2019.01044 (2019). [DOI] [PMC free article] [PubMed] [Google Scholar]
- 11.Garon EB et al. Antiestrogen fulvestrant enhances the antiproliferative effects of epidermal growth factor receptor inhibitors in human non-small-cell lung cancer. J Thorac Oncol 8, 270–278, doi: 10.1097/JTO.0b013e31827d525c (2013). [DOI] [PMC free article] [PubMed] [Google Scholar]
- 12.Hangauer MJ et al. Drug-tolerant persister cancer cells are vulnerable to GPX4 inhibition. Nature 551, 247–250, doi: 10.1038/nature24297 (2017). [DOI] [PMC free article] [PubMed] [Google Scholar]
- 13.Friedmann Angeli JP, Krysko DV & Conrad M Ferroptosis at the crossroads of cancer-acquired drug resistance and immune evasion. Nature Reviews Cancer 19, 405–414, doi: 10.1038/s41568-019-0149-1 (2019). [DOI] [PubMed] [Google Scholar]
- 14.Fox DB et al. NRF2 activation promotes the recurrence of dormant tumour cells through regulation of redox and nucleotide metabolism. Nat Metab 2, 318–334, doi: 10.1038/s42255-020-0191-z (2020). [DOI] [PMC free article] [PubMed] [Google Scholar]
- 15.Foggetti G et al. Genetic determinants of EGFR-Driven Lung Cancer Growth and Therapeutic Response In Vivo. Cancer Discov, doi: 10.1158/2159-8290.CD-20-1385 (2021). [DOI] [PMC free article] [PubMed] [Google Scholar]
- 16.Reczek CR & Chandel NS The Two Faces of Reactive Oxygen Species in Cancer. Annual Review of Cancer Biology 1, 79–98, doi: 10.1146/annurev-cancerbio-041916-065808 (2017). [DOI] [Google Scholar]
- 17.Zaugg K et al. Carnitine palmitoyltransferase 1C promotes cell survival and tumor growth under conditions of metabolic stress. Genes Dev 25, 1041–1051, doi: 10.1101/gad.1987211 (2011). [DOI] [PMC free article] [PubMed] [Google Scholar]
- 18.Kinker GS et al. Pan-cancer single-cell RNA-seq identifies recurring programs of cellular heterogeneity. Nat Genet 52, 1208–1218, doi: 10.1038/s41588-020-00726-6 (2020). [DOI] [PMC free article] [PubMed] [Google Scholar]
- 19.McFarland JM et al. Multiplexed single-cell transcriptional response profiling to define cancer vulnerabilities and therapeutic mechanism of action. Nat Commun 11, 4296, doi: 10.1038/s41467-020-17440-w (2020). [DOI] [PMC free article] [PubMed] [Google Scholar]
- 20.Maynard A et al. Therapy-Induced Evolution of Human Lung Cancer Revealed by Single-Cell RNA Sequencing. Cell 182, 1232–1251 e1222, doi: 10.1016/j.cell.2020.07.017 (2020). [DOI] [PMC free article] [PubMed] [Google Scholar]
- 21.Patel AP et al. Single-cell RNA-seq highlights intratumoral heterogeneity in primary glioblastoma. Science 344, 1396–1401, doi: 10.1126/science.1254257 (2014). [DOI] [PMC free article] [PubMed] [Google Scholar]
- 22.Kwong LN et al. Co-clinical assessment identifies patterns of BRAF inhibitor resistance in melanoma. J Clin Invest 125, 1459–1470, doi: 10.1172/JCI78954 (2015). [DOI] [PMC free article] [PubMed] [Google Scholar]
- 23.Viswanathan VS et al. Dependency of a therapy-resistant state of cancer cells on a lipid peroxidase pathway. Nature 547, 453–457, doi: 10.1038/nature23007 (2017). [DOI] [PMC free article] [PubMed] [Google Scholar]
- 24.Shaffer SM et al. Rare cell variability and drug-induced reprogramming as a mode of cancer drug resistance. Nature 546, 431–435, doi: 10.1038/nature22794 (2017). [DOI] [PMC free article] [PubMed] [Google Scholar]
- 25.Shah KN et al. Aurora kinase A drives the evolution of resistance to third-generation EGFR inhibitors in lung cancer. Nat Med 25, 111–118, doi: 10.1038/s41591-018-0264-7 (2019). [DOI] [PMC free article] [PubMed] [Google Scholar]
- 26.Havas KM et al. Metabolic shifts in residual breast cancer drive tumor recurrence. J Clin Invest 127, 2091–2105, doi: 10.1172/JCI89914 (2017). [DOI] [PMC free article] [PubMed] [Google Scholar]
- 27.Liau BB et al. Adaptive Chromatin Remodeling Drives Glioblastoma Stem Cell Plasticity and Drug Tolerance. Cell Stem Cell 20, 233–246 e237, doi: 10.1016/j.stem.2016.11.003 (2017). [DOI] [PMC free article] [PubMed] [Google Scholar]
- 28.Guler GD et al. Repression of Stress-Induced LINE-1 Expression Protects Cancer Cell Subpopulations from Lethal Drug Exposure. Cancer Cell 32, 221–237 e213, doi: 10.1016/j.ccell.2017.07.002 (2017). [DOI] [PubMed] [Google Scholar]
- 29.Yang C, Tian C, Hoffman TE, Jacobsen NK & Spencer SL Melanoma subpopulations that rapidly escape MAPK pathway inhibition incur DNA damage and rely on stress signalling. Nat Commun 12, 1747, doi: 10.1038/s41467-021-21549-x (2021). [DOI] [PMC free article] [PubMed] [Google Scholar]
- 30.Reyes J et al. Fluctuations in p53 Signaling Allow Escape from Cell-Cycle Arrest. Mol Cell 71, 581–591 e585, doi: 10.1016/j.molcel.2018.06.031 (2018). [DOI] [PMC free article] [PubMed] [Google Scholar]
- 31.Stuart T et al. Comprehensive Integration of Single-Cell Data. Cell 177, 1888–1902 e1821, doi: 10.1016/j.cell.2019.05.031 (2019). [DOI] [PMC free article] [PubMed] [Google Scholar]
- 32.Jerby-Arnon L et al. A Cancer Cell Program Promotes T Cell Exclusion and Resistance to Checkpoint Blockade. Cell 175, 984–997 e924, doi: 10.1016/j.cell.2018.09.006 (2018). [DOI] [PMC free article] [PubMed] [Google Scholar]
- 33.Chong J, Yamamoto M & Xia J MetaboAnalystR 2.0: From Raw Spectra to Biological Insights. Metabolites 9, doi: 10.3390/metabo9030057 (2019). [DOI] [PMC free article] [PubMed] [Google Scholar]
- 34.Kang HM et al. Multiplexed droplet single-cell RNA-sequencing using natural genetic variation. Nat Biotechnol 36, 89–94, doi: 10.1038/nbt.4042 (2018). [DOI] [PMC free article] [PubMed] [Google Scholar]
- 35.Erik Garrison GM Haplotype-based variant detection from short-read sequencing. arXiv (2012). [Google Scholar]
Associated Data
This section collects any data citations, data availability statements, or supplementary materials included in this article.
Supplementary Materials
Supplementary Table 5. Gene signature list
Supplementary Table 1. Mean signatures expression of the three different persister subpopulations
Supplementary Table 2. pooled experiment cell number by model information
Supplementary Table 3. Patient information
Supplementary Table 4. Primers used in this study
Data Availability Statement
RNA-seq data have been deposited in the NCBI Genome Expression Omnibus (GEO) under the accession code GSE150949. Watermelon library and plasmid are available on Addgene (IDs: 155257 and 155258). Code is available on https://github.com/yaaraore/watermelon (additional code is available upon request).


