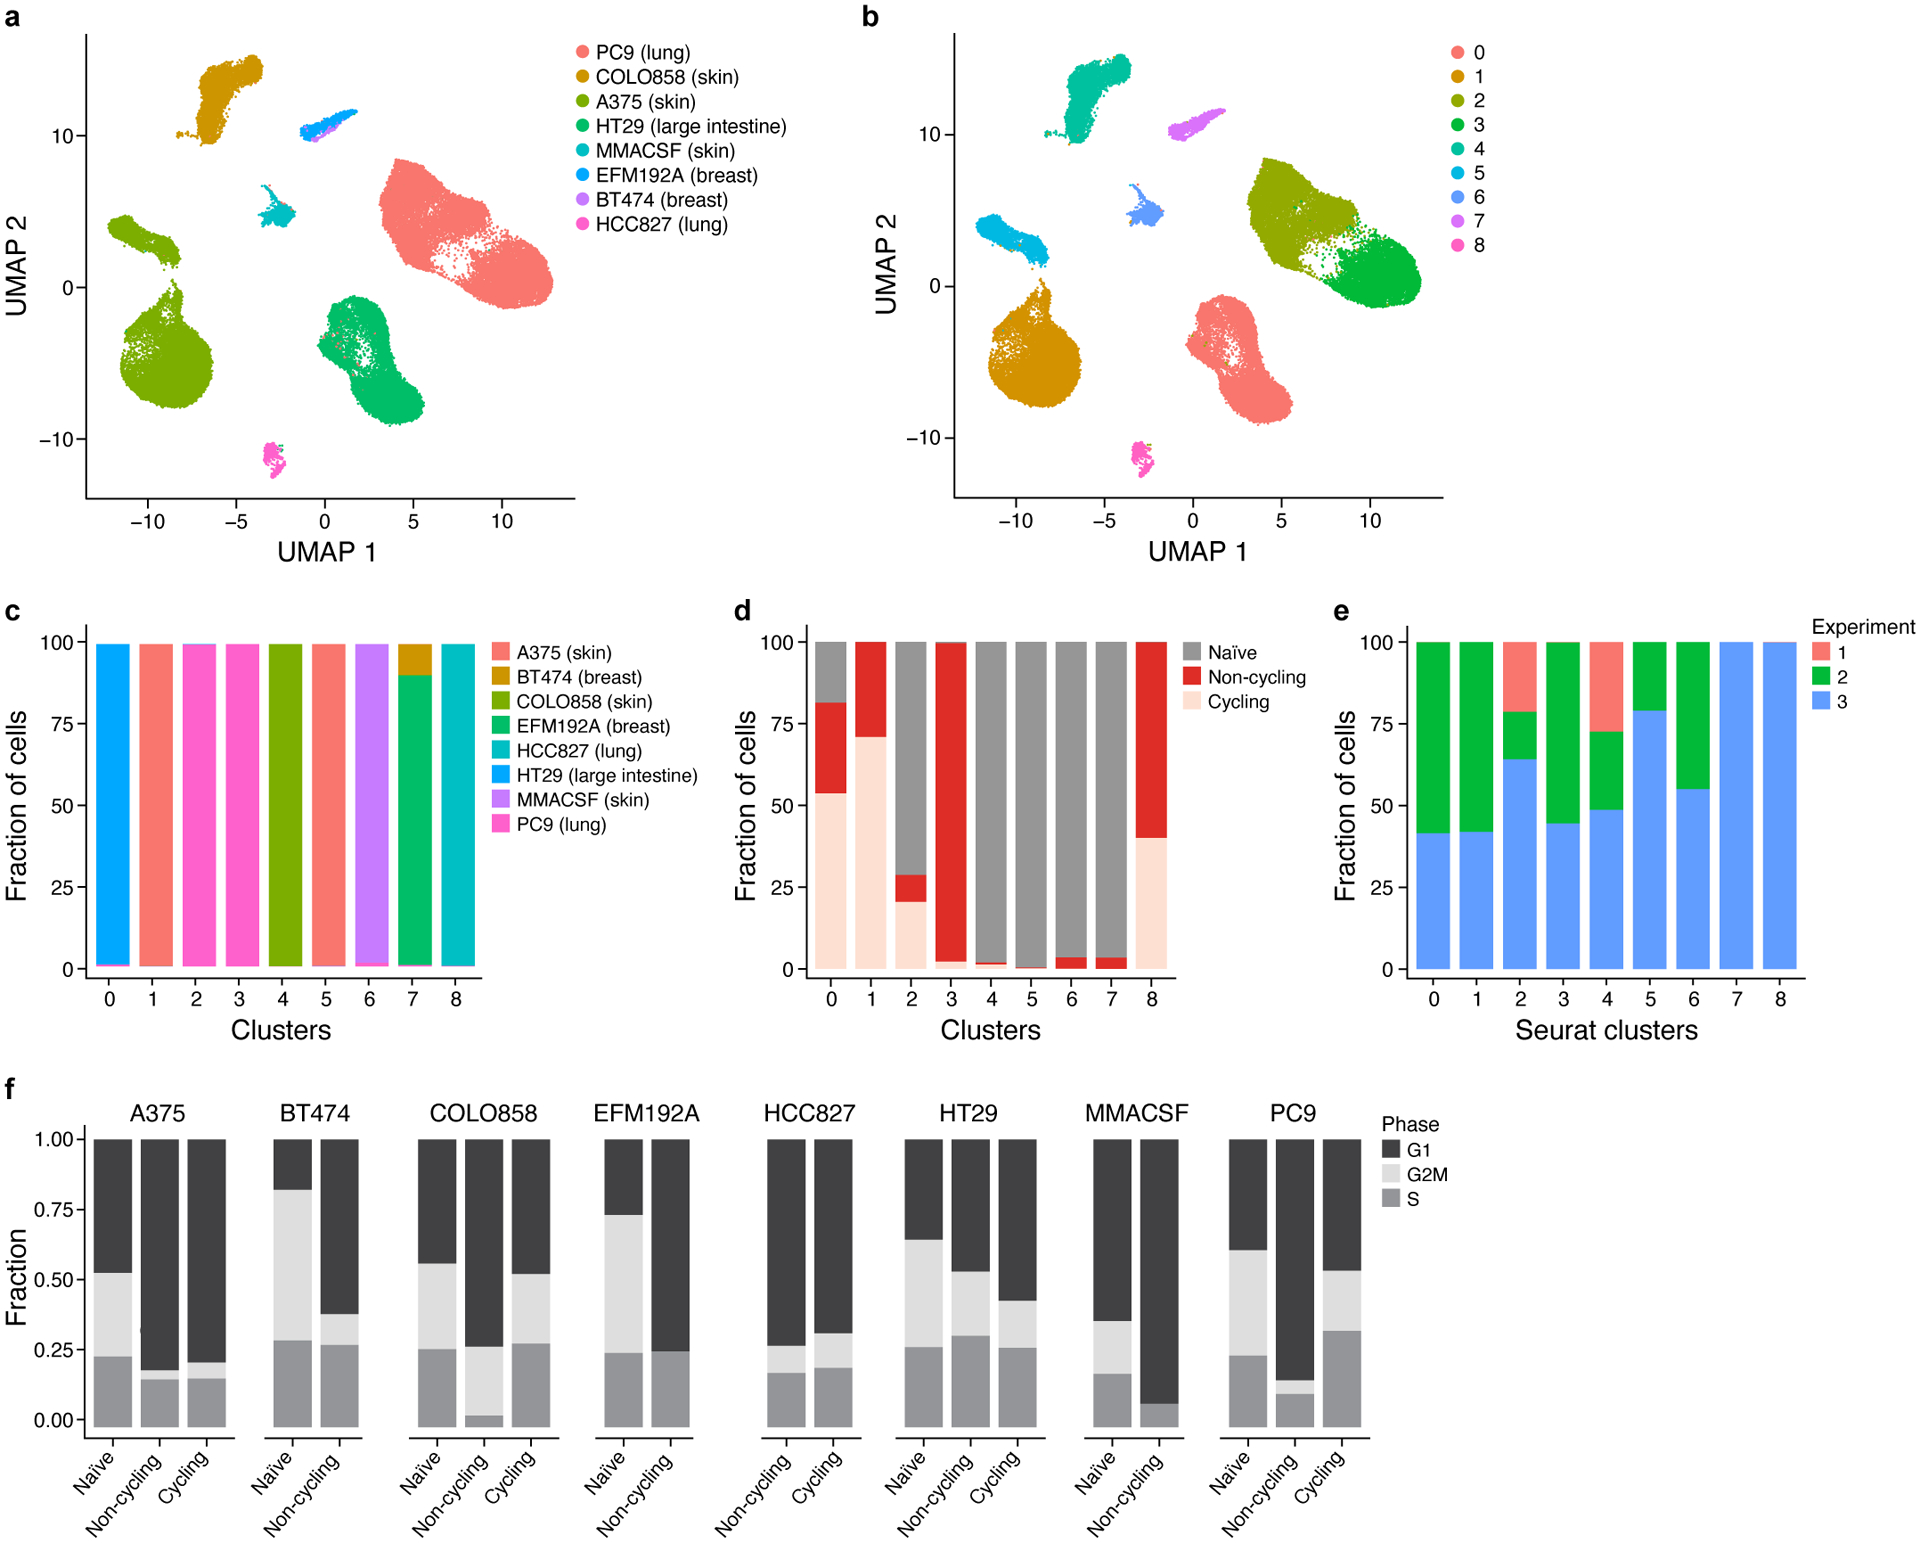
Extended Data Figure 8. Single cell analysis of multiple watermelon persister models.

a,b.UMAP representation of cells colored by cell line (a) and cluster identify (b).c-e, Fraction of cells (y axis) in each cluster (x axis) colored by cell line (c), treatment (d) and experimental replicate (e). f. Proportion of cells (y axis) in each cell cycle phase (colored stacked bars) based on cell cycle scores inferred from scRNA-seq data across cell line models.
