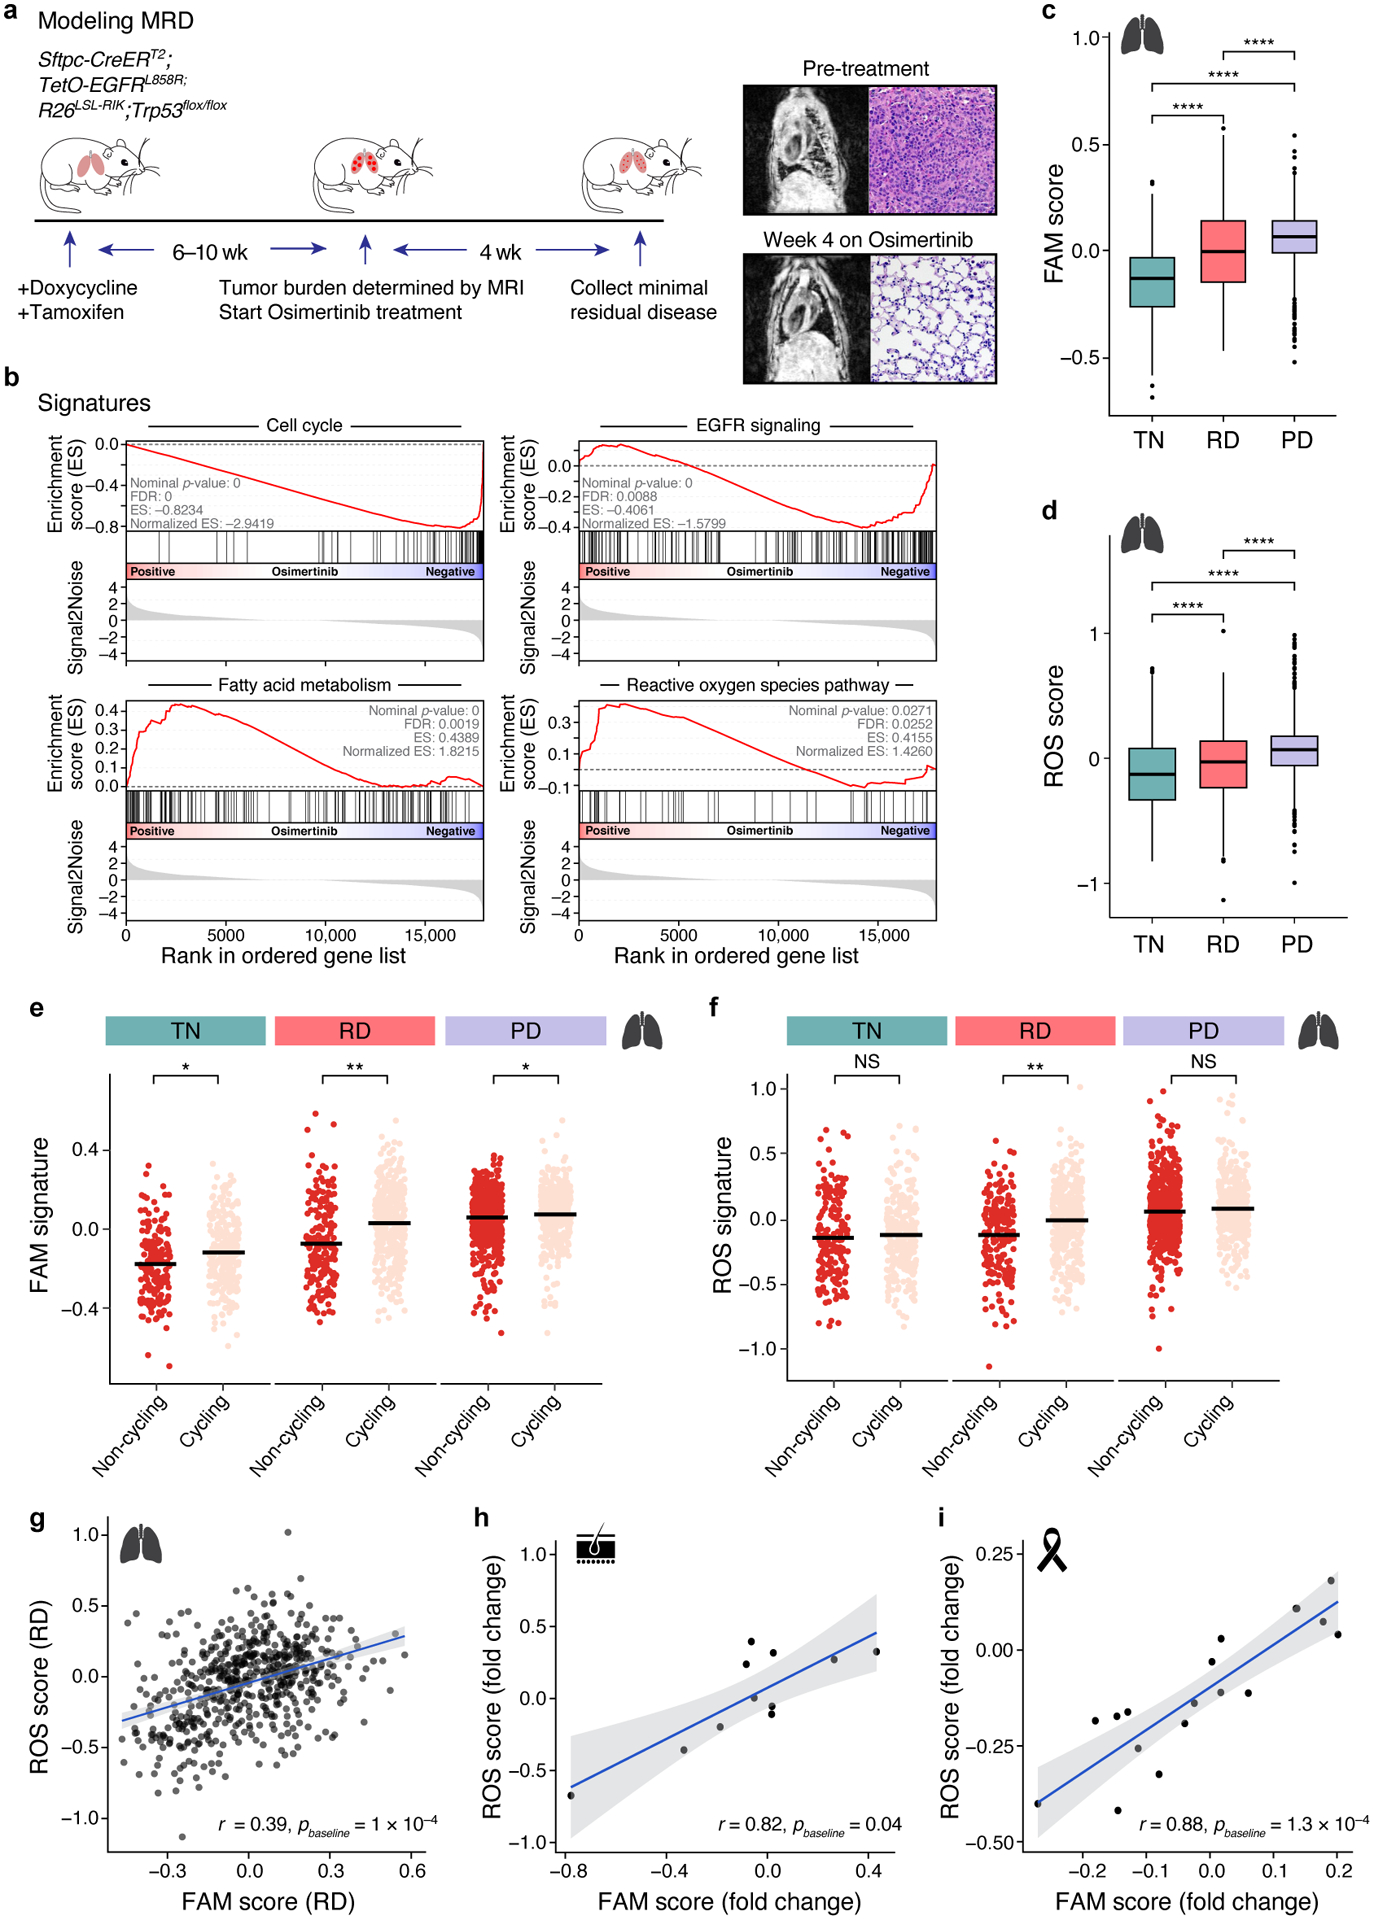
Figure 4. Metabolic shift in tumours treated with oncogene-targeted therapy.

a. Fatty acid metabolism (FAM) and reactive oxygen species (ROS) pathway signatures increase with treatment in a genetically engineered mouse model. Left: Experimental scheme for tumour development and drug treatment; middle: MRI (left) and H&E staining (right) of pre- (top) and post-treatment (bottom) mouse lungs. b. Gene Set Enrichment Analysis (GSEA) of cell cycle, EGFR signaling, ROS, and FAM related genes in minimal residual disease samples versus untreated control. c,d. Signature scores FAM (c, PTN,RD< 2×10⁻¹⁶, PTN,PD< 2×10⁻¹⁶, PRD,RD= 6×10⁻¹⁴) and ROS (d, PTN,RD=6.7×10⁻⁷, PTN,PD< 2×10⁻¹⁶, PRD,RD= 4.8×10⁻¹⁶) in treatment naïve (TN), residual disease (RD) and progressive disease (PD) of human lung adenocarcinoma (457, 557, and 1,088 cells per group, respectively). *** P < 0.001**** P<0.001; two-sided Wilcoxon test. Expression data from NCT03433469 trial. Box plots represented by center line, median; box limits, upper and lower quartiles; whiskers extend at most 1.5× interquartile range past upper and lower quartiles. e,f. FAM (e, PTN=1.2×10⁻², PRD=1.1×10⁻³, PPD=1.5×10⁻²) and ROS (f, PTN=0.9, PRD= 5.3×10⁻³, PPD=0.1) signature scores (y axis) in cells (dots) stratified by cycling (pink) vs. non-cycling (red) status across treatment phases of lung adenocarcinoma samples. * P < 0.05 (mixed linear model; Supplemental Methods). g. Correlation between ROS and FAM signature scores (x and y axes) in cells (dots) from lung adenocarcinoma residual disease. Bottom right: Correlation coefficient. h,i. Correlation between ROS and FAM signature scores in melanoma (h) and breast cancer (i) residual disease samples (dots). ROS (y axis) and FAM (x axis) signature scores in melanoma patients treated with BRAFi/MEKi (h) and HER2+ breast cancer patients treated with lapatinib (i). Bottom right: correlation coefficient. 95% confidence interval (g-i, shaded area).
