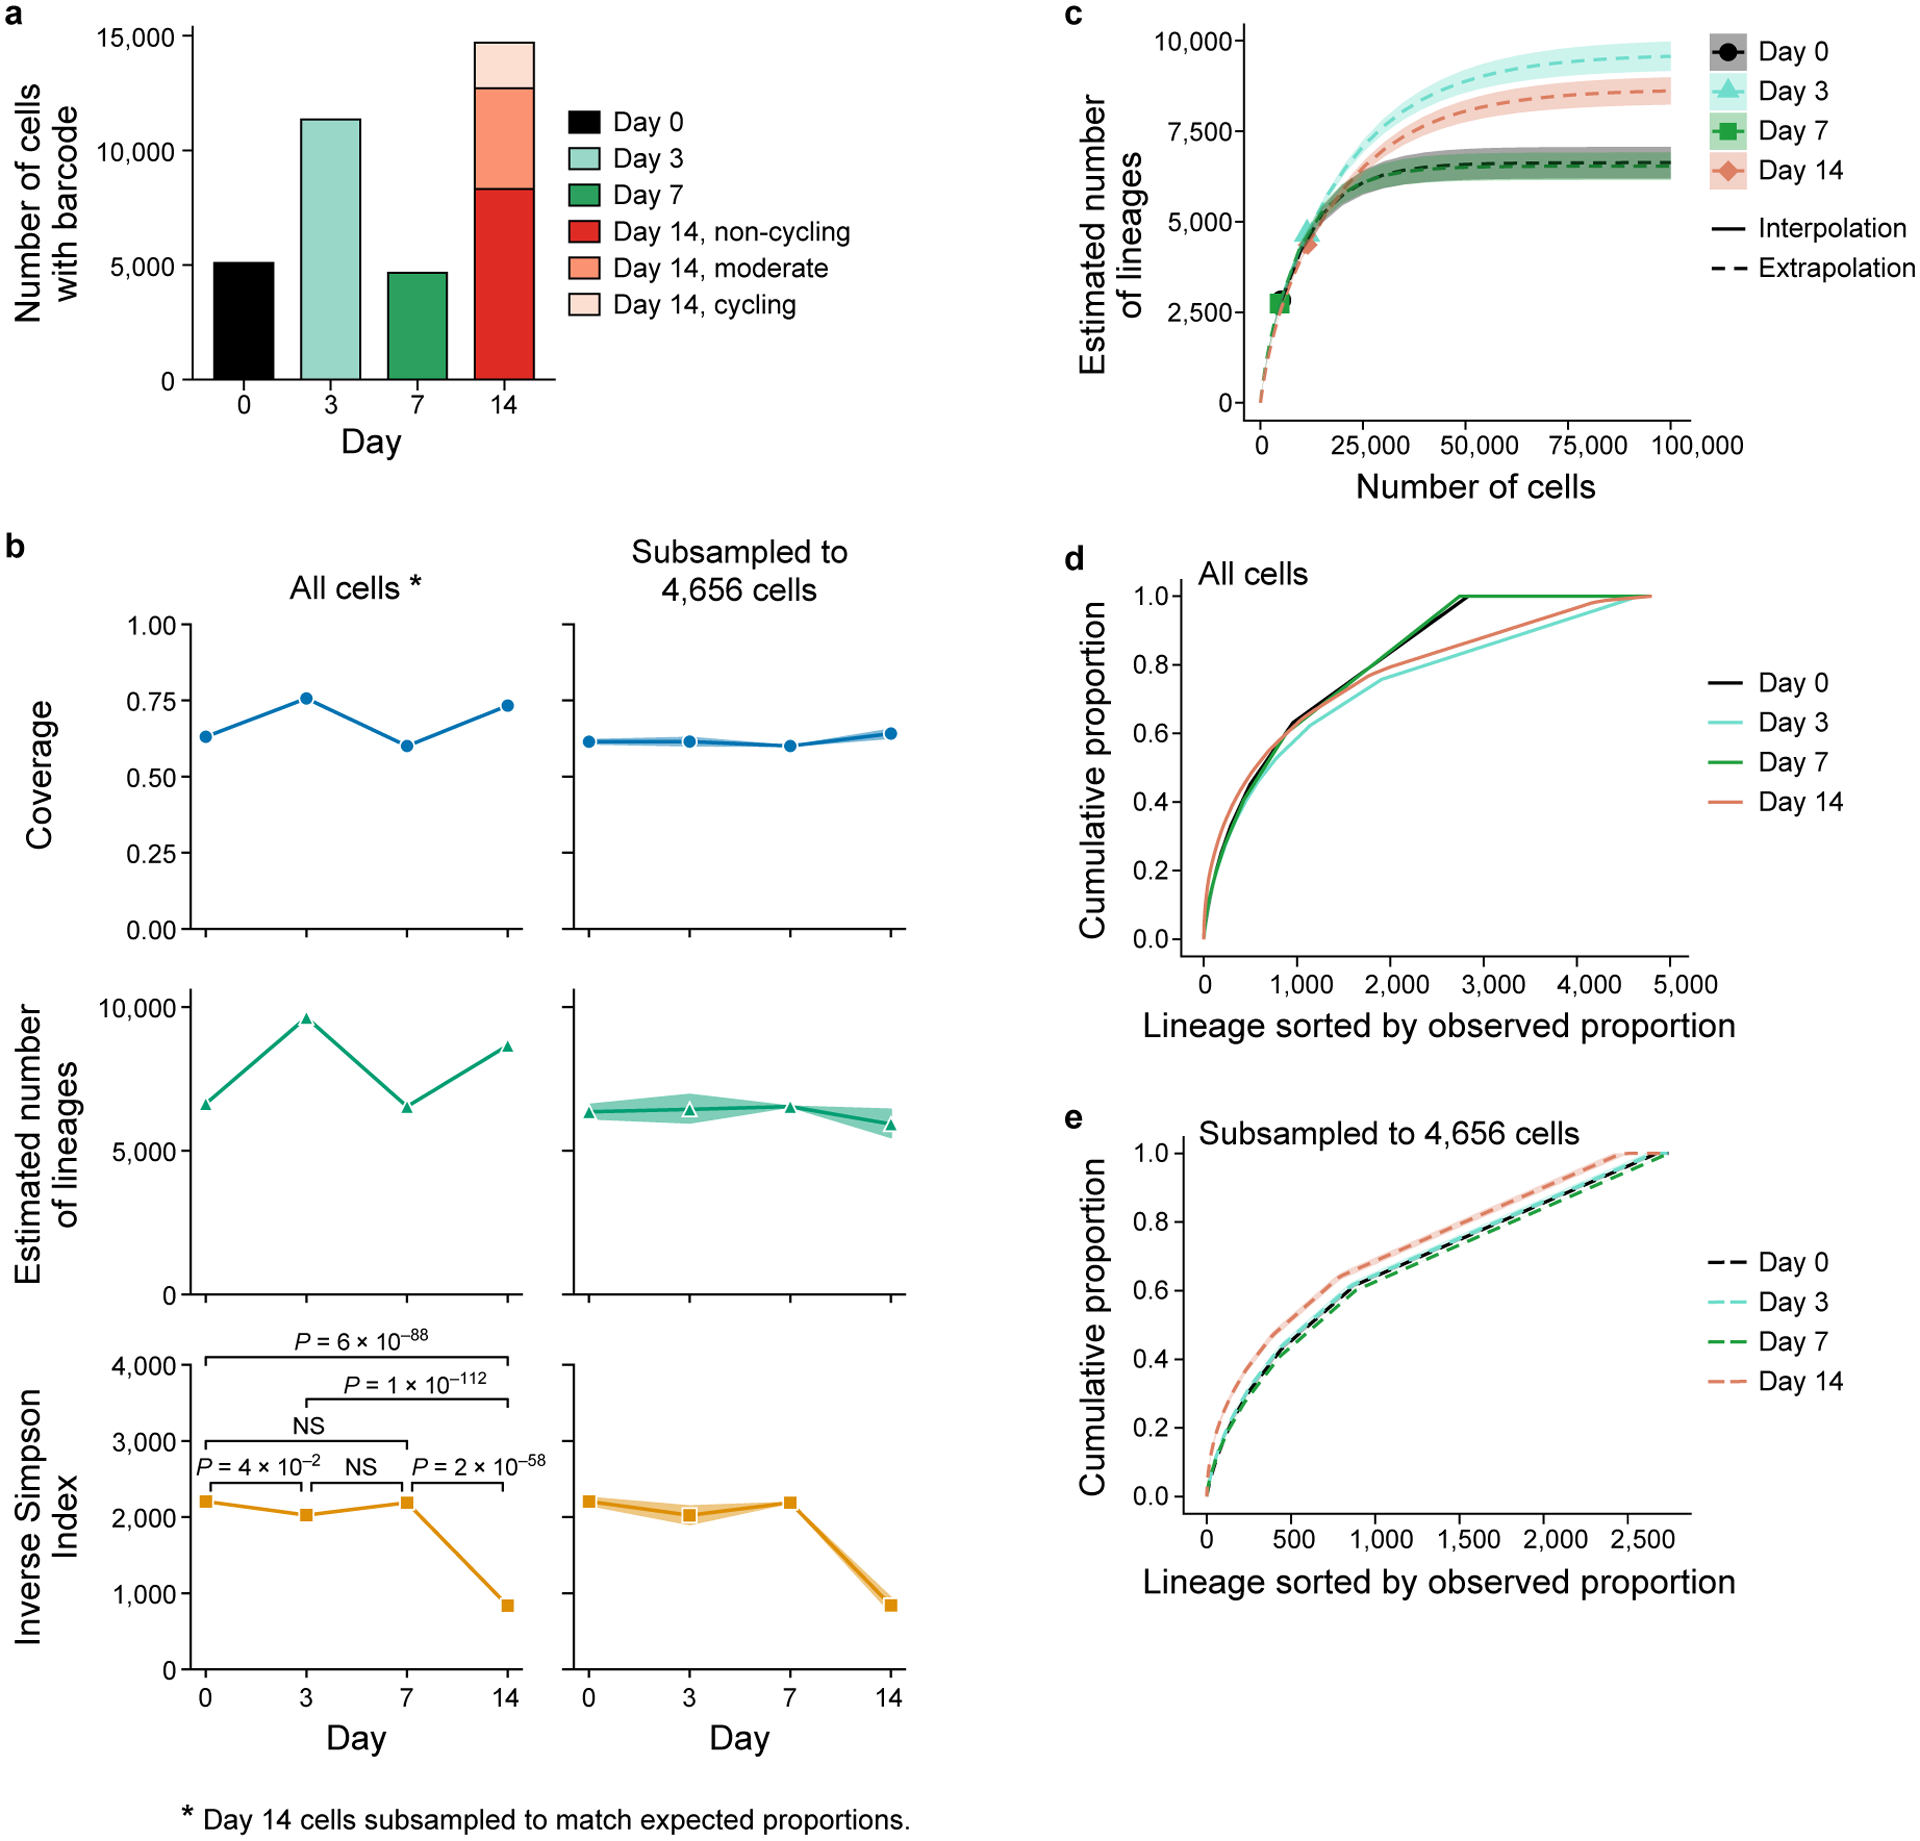
Extended Data Figure 3. Estimates of lineage diversity.

a. Difference in number of cells profiled per timepoint. Number of cells (y axis) with captured lineage barcode at each day (x axis). Day 14 cells are partitioned by the three mCherry populations (legend). b-e. Species diversity estimators can be biased by coverage. Estimated sample coverage (cumulative proportion of all lineages in the total population that were observed, top, y axis, Methods), estimated number of lineages in the population (middle, y axis, Methods), and estimated inverse Simpson Index, also known as Hill number of order 2 (bottom, y axis, Methods) at each timepoint (x axis), computed from all cells with barcodes (left) or subsampled without replacement to match the smallest number of cells per timepoint, 4,656 cells on day 7 (right). Confidence bands (shaded area) indicate the empirical pointwise 95% coverage confidence interval over 1,000 subsampling repetitions. Since standard species richness estimators are not suited for the analysis of estimated proportions from stratified sampling, we randomly subsampled 8,320, 1,949, and 1,276 day 14 cells without replacement from the cycling and moderate cyclers and non-cycling population, respectively (left panel, for unsorted population proportions see Extended Data Fig. 2a). P-values obtained by (asymptotic) two-sided Welch’s t-test with bootstrap estimated standard errors, Holm-corrected with level 5% (Methods, n = 5,087, day 0, n = 11,348, day 3, n = 4,656, day 7, n = 11,545, day 14 subsampled) c. Alternative estimates of number of lineages with rarefaction. Rarefaction curves for the expected observed number of different lineages (y axis) at varying hypothetical sample sizes (x axis) for each timepoint (colored lines). Actual number of observed lineages: marker; Interpolated results: solid lines; Extrapolation beyond the observed number: dashed lines. Day 14 cells were subsampled as done for the estimation of the number of lineages in the right-hand side panels of (b). Shaded areas: confidence bands at 95% confidence level. d,e. Estimated cumulative proportion (eCDF) of lineages in the total population (y axis) sorted in decreasing order of estimated lineage proportion (x axis) for each timepoint (colored lines) when estimating the proportion from all sequenced cells with barcodes (d) or subsampled to 4,656 cells (e) as in (b). Subsampling (b,e) and rarefaction (c) facilitate comparison between different timepoints since estimators of population diversity are strongly biased by sample size. Confidence bands indicate the empirical pointwise 95% coverage confidence interval over 1000 repetitions of the subsampling.
