

Abstract
Introduction
Overweight and obesity is a global problem incurring substantial health and economic implications. This has also been highlighted by the ongoing COVID-19 pandemic which has disproportionately affected overweight and obese individuals. Most of the interventions have concentrated on promotion of physical activities and healthy eating which may involve current sacrifices for future health gains. The purpose of this study was to explore the relationship between bodyweight and how individuals state they would trade-off immediate income for higher amounts in the future (time preference).
Methods
An online survey was conducted targeting adults aged >16 years in the UK (England, Northern Ireland, Scotland, and Wales) from January 1, 2016 to July 31, 2016. Using paid online adverts, as well as personal and professional networks for distribution of links to the online survey, the questionnaire asked respondents to report socio-economic and demographic information, height, and weight and to complete a time preference exercise. Data were analysed using descriptive statistics; associations were explored between BMI and respondents' characteristics and time preference using Spearman rank-order correlation and χ<sup>2</sup> tests as appropriate. We adopted STROBE guidelines for the reporting of the study.
Results
A total of 561 responses were analysed (female = 293, males = 268). The relationship between time preference and overweight/obesity, using BMI as the measure is highly significant (χ<sup>2</sup> = 95.92: p < 0.001). Individuals of normal weight have low time preferences and are more likely to invest in activities in a bid to reap future health benefits. There are also significant relationships between BMI and employment status (χ<sup>2</sup> = 37.03; p < 0.001), physical activities (p < 0.0001), income levels (χ<sup>2</sup> = 6.68; p < 0.035), family orientation, i.e., with or without children (χ<sup>2</sup> = 12.88; p < 0.012), and ethnicity (χ<sup>2</sup> = 18.31; p < 0.001). These imply that individuals in employment and with children in their families are less likely to be overweight or obese compared to those who do not. People from black backgrounds are also more likely to be overweight or obese and have higher time preferences compared to people from white backgrounds.
Discussions/Conclusions
People's preventive behaviours today can be predicted by their time preference and this understanding could be vital in improving population's uptake and maintenance of overweight and obesity prevention actions. People who have low time preference are more likely to invest time and resources in physical activities and healthy lifestyles to reap future health benefits hence value utilities-in-anticipation. Public health programmes should therefore use the knowledge of the association between time preference and overweight/obesity to inform designs of intervention programmes.
Keywords: Overweight, Obesity, Time preference, Behavioural economics, Economics of obesity, Physical activities, Intertemporal choice
Introduction
Overweight and obesity are major global health problems and among leading causes of preventable deaths in the UK [1, 2] and worldwide [3]. In Wales, England, Scotland, and Northern Ireland, the 2017/2018 national health surveys indicate 59%, 63%, 65%, and 65% of the adult population (16 years and over), respectively, were categorized as having overweight or obesity. The health and economic implications of these trends are enormous, obesity being not just a condition of its own [4, 5] but also a major risk factor for several chronic disease conditions. This has also been highlighted by the ongoing COVID-19 pandemic which has disproportionately affected people living with overweight or obesity. Dobbs et al. [6] estimated the global economic impact of obesity to be around USD 2.0 trillion or 2.8% of the global gross domestic product (at 2014 costs). The Obesity Health Alliance's 2017 estimates are that the cost of obesity to the wider society is estimated at GBP 27 billion in the UK. The UK-wide National Health Services (NHS) overweight and obesity attributable costs are projected to reach GBP 9.7 billion by 2050, while the wider costs to society are estimated to reach GBP 49.9 billion per year [7].
For Scotland, the 2017 NHS Scotland report indicated the cost to the economy to be between GBP 0.9 billion and GBP 4.6 billion [8]. In their assessment of the costs of alcohol and obesity to the NHS in Wales, Public Health Wales NHS Trust [9] put the cost of obesity at GBP 73 million and GBP 86 million at 2011 costs if overweight and obesity are considered together. For Northern Ireland, their government's Department of Health 2015 report estimated that obesity results in some 260,000 working days lost every year and costing the economy approximately GBP 0.5 billion [10].
While multifaceted factors may contribute to obesity, it largely arises from an energy imbalance between calories consumed and calories expended indicating a behavioural cause. To date, studies into the understanding of preventive behaviour and its determinants have been examined from psychological perspectives [11, 12, 13]. Efforts to understand individual decisions related to the consumption of goods for the prevention of overweight and obesity, and the factors that influence such decisions have been lacking in economic studies [14]. However, even though individual factors may be able to explain some of the variations in bodyweight between individuals, it can hardly explain the worldwide population-level rise in the prevalence of obesity during the past decades. In a survey of the economic causes of obesity, Rosin [15] identified genetics, biological basis, rational addiction, satisfaction, technological change, poverty, information, and time preference as some of the causes of obesity.
In conventional economic theory, demand derives from the utility yielded by consumption [16]. Prevention goods have been defined as any good (or service or activity) whose consumption reduces the risk of future illness and death (Cohen [11] 1984).
As many of the prevention goods relating to weight control, such as dieting, avoiding unhealthy foods (e.g., ready-made junk foods), or taking regular exercise can yield negative utility for some people, the demand for prevention goods is poorly explained by conventional economic theory. It has been proposed that there is a second type of utility associated with prevention goods which derives from the knowledge that consuming prevention goods today reduces the risk of future illness and that this type of utility, called utility-in-anticipation, accounts for a greater part of the demand for prevention goods than does conventional utility-in-use (Cohen [11] 1984).
It has further been proposed that utility-in-anticipation depends inter alia on individuals' personal time preference rates − defined as a willingness to trade current for future utility [17]. Individuals with high time preference rates will discount the future (negative) health consequences of having overweight or obesity more highly than will individuals with lower time preference rates, and hence will receive less utility-in-anticipation from consuming prevention goods. They will consequently be less likely to engage in preventive activities (i.e., weight control). This is the underlying hypothesis for the current analysis. The aim and objective of the current study were to explore and examine the relationship between overweight or obesity and time preference using empirical data from a survey conducted in the UK (England, Northern Ireland, Scotland, and Wales). The targeted population for the online survey were young people and adults aged ≥16 years.
Methods
Data Collection
A questionnaire was developed and piloted in two phases (phase 1 and phase 2) prior to its deployment via an online platform provided by Survey Monkey® (SurveyMonkey Europe UC, 2 Shelbourne Buildings, 2nd Floor, Shelbourne Road, Ballsbridge, Dublin 4, Ireland). In the second stage of phase 2, n = 47 participants were involved, and no significant changes were made to the questionnaire at that stage so the same version was used in the main online survey. The online data collection method was considered the most convenient in terms of time and costs for the circumstances. Participants were recruited via advertisements placed with online social media, including Facebook®, Google Plus®, and LinkedIn®. The advertisements targeted only UK residents and the survey could not be completed by people resident outside the UK unless they provided a UK postcode. However, in addition to these advertisements, the researchers also used their professional networks and social connections for the distribution of website links to the online survey.
The 15–30 min online questionnaire (see online suppl. material 1; see www.karger.com/doi/10.1159/000522651 for all online suppl. material) had 20 sections covering various areas, including consent (which must be completed before any participant could proceed to other sections), personal characteristics (including age, sex, height, weight), and ethnicity and cultural/religious backgrounds, residence, socio-economic background, stigma, social activities, food and exercise habits, physical activities, perceptions, and beliefs about overweight or obesity and its health/social outcomes, risk behaviours, and how they trade-off present for future benefits designed to measure their time preference. The time preference question follows standard time trade-off approaches to elicit participants' willingness to wait for higher future rewards [18, 19, 20, 21] and was developed through extensive consultations with economists, health economists, psychologists, and obesity researchers. People's willingness to trade-off present (often) smaller rewards for future larger rewards can be indications of their willingness to invest in their health hence engage in health improvement activities.
The question on how they trade-off present for future benefits presented a scenario with 6 options: option 1 − take GBP 1,000 now, option 2 − wait 3 months and receive GBP 1,100, option 3 − wait 6 months and receive GBP 1,200, option 4 − wait 1 year and receive GBP 1,300, option 5 − wait 2 years and receive GBP 1,400, and option 6 = wait 3 years and receive GBP 1,500. To reduce the occurrence of missing data, the survey was designed to prohibit progression if an item was not answered. The only exception was for height and weight for which this was not possible.
No private personal data which could be used to identify or contact participants such as dates of birth and addresses were collected. However, to encourage recruitment to target, if participants agreed to provide their details, they were entered into a prize draw for GBP 50 shopping vouchers.
Statistical Analysis
Survey data were downloaded from the SurveyMonkey® online platform into an Excel® spreadsheet (of Microsoft Corporation; One Microsoft Way, Redmond, WA, USA) for data cleaning and organization. All data analysis was then undertaken using the SPSS® (SPSS Inc., 233 S., Wacker Drive, 11th floor, Chicago, IL, USA) software package. As there is a possibility that some people may participate for the opportunity to enter in the voucher raffles hence may just be ticking boxes, we conducted a data reliability check with the aim of ensuring that participants were conscious of the responses they were providing in the completion of the questionnaire. Data reliability was checked using appropriate variables on risk preferences which are to be published separately.
Variables were analysed descriptively. To assess representativeness respondents were compared with the national population (of the four countries) with respect to geographical distribution, BMI, ethnicity, and education.
BMI was assessed (as the response variable) against predictor variables (participants' characteristics). The association between time preference and employment status, income levels, education, and ethnicity (Black vs. White, as there were small numbers of respondents in other ethnic groups) was assessed using Spearman's rank-order correlation coefficients; the association between BMI (normal versus overweight/obesity) and time preference was assessed using χ2 tests.
The online survey was generally designed not to accommodate missing data in that a question must be completed before one can proceed to another section of the questionnaire. However, there were two questions which were not made compulsory due to design limitations of the online survey platform. These were the questions on height and body weight which were designed as free text questions with answers to be given in metres or feet and inches for height and in kilograms or stones and pounds for weight. Patterns in missing values were analysed for patterns that could be of concern. Series mean method was used to impute missing values for height and weight because missingness was observed to be at random. The analysis is therefore based on data, including imputed missing values. The usual BMI formula of weight (in kg) divided by height (in metres) squared was used to compute BMI following imputations. BMI data were analysed for outliers.
Sample Size Estimation
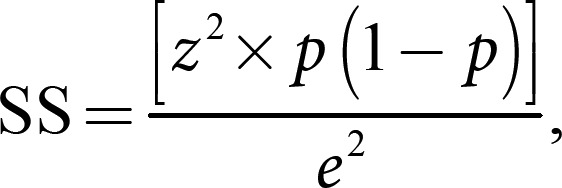
A sample size of 540 was estimated for the survey using the following formula by Charan and Biswas [22] for cross-sectional studies.

where SS = sample size; Z = the z-score (with alpha level of 0.05, z-score will be 1.96 for two-tailed test); p = the estimated prevalence of the various weight/height ratio categories (i.e., BMI prevalence); and e = the margin of error (which will be 5% for this analysis.
Ethical Approval
Ethical approval was given by the Ethics Committee of the Faculty of Life Sciences and Education, University of South Wales, Pontypridd, UK. We adopted STROBE guidelines for the reporting of the study (shown in online suppl. material 2).
Results
Response Rates
The main survey took place from January 15, 2016 (i.e., when the 1st consent was given) to July 31, 2016 (i.e., when the last survey was completed). The survey was completed by 80% of participants. Only those who completed the whole survey (i.e., all compulsory questions) were included in the analysis. Figure 1 provides the proportions of initial participants (n = 642) per country. Of n = 642 volunteers (clicked relevant survey links), 561 responses were analysed (Fig. 2).
Fig. 1.

Proportion of participants per country. Sky blue = England (9.3%); light purple, Northern Ireland (1.7%); yellow, Scotland (10.9%); light blue, Wales (5.8%); purple, other countries (10.9%).
Fig. 2.

Schema of participants' flow diagram. Black, participants processed for analysis; red, participants removed; green, final participants included in the analysis.
Figure 3 is a mapping of the postcodes of all the anonymous participants to provide some indication of their spread. For this research, postcodes were used as they are more indicative of locations than IP addresses. The reason we use postcodes is because, for example, someone may complete the survey while on a visit to London (England) but actually lives in Inverness (Scotland). Going by IP addresses, that person's location would be indicated as London instead. Also, the location of IP addresses can be dependent on the person's Internet service provider and not necessarily where the person lives.
Fig. 3.

Postcode distribution of participants. Blue “pins” or “markers,” location of postcodes of participants on Google® Maps.
National Representativeness of Sample of Respondents
Scotland and Wales were overrepresented amongst respondents, England was underrepresented (Table 1). Survey responses tend to underrepresent the prevalence of overweight and obesity compared with the national average, except in the morbidly obese group, and particularly in Northern Ireland (Table 2).
Table 1.
Comparisons with 2014 midyear estimates
| Countries | Populations* | Percentages |
Males, % |
Females, % |
|||
|---|---|---|---|---|---|---|---|
| populations* | survey | populations* | survey | population* | survey | ||
| England | 54,316,618 | 84.09 | 76.30 | 49.29 | 48.13 | 50.71 | 51.87 |
| Scotland | 5,347,600 | 8.28 | 11.90 | 48.55 | 44.78 | 51.45 | 55.22 |
| Wales | 3,092,036 | 4.79 | 9.80 | 49.20 | 49.09 | 50.80 | 50.91 |
| Northern Ireland | 1,840,498 | 2.85 | 2.00 | 49.05 | 45.45 | 50.95 | 54.55 |
| Total | 64,596,752 | 100.00 | 100.00 | 49.22 | 47.77 | 50.78 | 52.23 |
Based on mid year (2) Population Estimates by single year of age and sex for local authorities in the UK, mid-2014. Obtained from Population Estimates Unit, Office of National Statistics.
Table 2.
Comparisons of survey and national BMI prevalence estimates
| Walesactual | Wales-survey | Scotland-actual | Scotland-survey | Northern-Ireland-actual | Northern Ireland-survey | England-actual | England-survey | |
|---|---|---|---|---|---|---|---|---|
| BMI category | ||||||||
| Under weight | 0.02 | 0.02 | 0.02 | 0.02 | 0.01 | 0.09 | 0.02 | 0.05 |
| Normal weight | 0.40 | 0.58 | 0.33 | 0.55 | 0.39 | 0.55 | 0.37 | 0.46 |
| Overweight | 0.35 | 0.25 | 0.37 | 0.19 | 0.37 | 0.00 | 0.36 | 0.25 |
| Obese | 0.22 | 0.13 | 0.25 | 0.23 | 0.24 | 0.27 | 0.26 | 0.19 |
| Morbidly obese | 0.02 | 0.02 | 0.03 | 0.02 | 0.02 | 0.09 | 0.03 | 0.05 |
There are 12 missing BMI cases in the survey. These have been excluded from the survey prevalence estimations for above comparisons. The BMI prevalence data on England, Wales, Scotland, and Northern Ireland were obtained from their respective health survey data for 2014.
The proportion of people from Black backgrounds and with higher education were higher in the sample than in the national population (n = 91, 16.2% vs. 13%, from 2011 UK census) (Table 3). There were 48.1% of survey respondents with a University degree (Table 4), compared to 18,6% nationally (Office of National Statistics 2013).
Table 3.
Ethnicity representations in the survey
| Frequency | Percent | |
|---|---|---|
| Asian (In/Pk/Bd) | 22 | 3.9 |
| Asian: Chinese | 4 | 0.7 |
| Asian (other) | 4 | 0.7 |
| Black: African/Caribbean | 86 | 15.3 |
| Black (other) | 5 | 0.9 |
| Hispanic or Latino | 6 | 1.1 |
| White: Welsh/English/Scottish/NI | 373 | 66.5 |
| White: Any other white background | 47 | 8.4 |
| Arab | 2 | 0.4 |
| Mixed race (all) | 6 | 1.1 |
| Prefer not to answer | 2 | 0.4 |
| Other ethnicities | 4 | 0.7 |
| Total | 561 | 100.0 |
Table 4.
Education levels of respondents
| Frequency | Percent | |
|---|---|---|
| Primary education | 3 | 0.5 |
| Secondary/high school/grammar | 33 | 5.9 |
| Completed secondary/high/grammar school | 127 | 22.6 |
| Some additional training (apprenticeship, technical, vocational, further education courses, etc.) | 128 | 22.8 |
| Undergraduate (university/college/professional) | 141 | 25.1 |
| Postgraduate (university/college/professional) | 129 | 23.0 |
| Total | 561 | 100.0 |
Analysis by Age and Sex
There were slightly more women than men respondents. Three-quarters (75.4%) of respondents were aged 16–24 years. The mean age of women was less than men but the mean BMI was similar. Please see Tables 5, 6, 7.
Table 5.
Place of residence × gender cross tabulation
| Gender |
Total, n (%) | ||
|---|---|---|---|
| male | female | ||
| Place of residence | |||
| Wales | 27 | 28 | 55 (9.80) |
| Scotland | 30 | 37 | 67 (11.94) |
| Northern Ireland | 5 | 6 | 11 (1.96) |
| England | 206 | 222 | 428 (76.30) |
| Total, N (%) | 268 (48) | 293 (52) | 561 (100) |
Table 6.
Age group × place of residence cross tabulation
| Count | Place of residence |
Total, n (%) | |||
|---|---|---|---|---|---|
| Wales | Scotland | Northern Ireland | England | ||
| Age group | |||||
| 16–24 years old | 17 | 15 | 7 | 112 | 151 (26.92) |
| 25–34 years old | 14 | 14 | 3 | 108 | 139 (24.78) |
| 35–44 years old | 11 | 14 | 1 | 107 | 133 (23.71) |
| 45–54 years old | 9 | 8 | 0 | 48 | 65 (11.59) |
| 55–64 years old | 3 | 7 | 0 | 34 | 44 (7.84) |
| 65–75 years old | 1 | 9 | 0 | 19 | 29 (5.17) |
| Total | 55 | 67 | 11 | 428 | 561 (100) |
Table 7.
Age and BMI characteristics of respondents
| Gender | Age |
BMI* |
||||||||
|---|---|---|---|---|---|---|---|---|---|---|
| N | min | max | mean | std. dev | N | min | max | mean | std. dev | |
| Male | 268 | 16 | 70 | 38.15 | 14.99 | 259 | 11.67 | 50.06 | 26.49 | 6.49 |
| Female | 293 | 16 | 70 | 33.71 | 13.79 | 290 | 11.43 | 61.88 | 26.14 | 6.38 |
| All | 561 | 16 | 70 | 35.83 | 14.53 | 549 | 11.67 | 61.88 | 26.30 | 6.43 |
Twelve missing data. These are explained under missing data analysis section.
Data Reliability
To examine the reliability of the survey data, the overall rationality of respondents was assessed. This was done through exploring questions on risk preferences. As the risks increase, respondents' preferences are expected to change accordingly. In this respect, the greater the increase in risks the lower the number of choices for that option. Figure 4 indicates that overall, the higher the risks the lower the preferences for the option (scale from 0 for high-risk to 6 for low-risk). This is therefore a justification that respondents were rational in the completion of the survey and were not just ticking boxes for the sake of completing the questionnaire. The J-shaped histogram shows that respondents' risk preferences are skewed in favour of non- or less-risky options.
Fig. 4.
Histogram on respondents' risk preferences. Black curved line, distribution curve; blue bars, frequencies of options.
BMI outliers were analysed. The outlier analysis revealed nothing improbable hence all were considered to be possible realistic measurements.
Relationship Analysis
Participants' Characteristics in Terms of BMI
Respondents were significantly more likely to have overweight or obesity if they did not live with children, were Black (vs. White), were not in employment, and didn't exercise − especially likely to have morbid obesity if they did not live with children or were not in employment. Please see Tables 8, 9, 10, 11, 12.
Table 8.
BMI and family status
| Living with children × BMI category (imputed) cross tabulation |
χ2 tests |
|||||||||
|---|---|---|---|---|---|---|---|---|---|---|
| family situation | weight (BMI) category (imputed) |
total |
Pearson χ2 | value | df | asymp. Sig. (2-sided) | ||||
| under weight, N (%), std residual | normal weight, N (%), std residual | over weight, N (%), std residual | obese, N (%), std residual | morbidly obese, N (%), std residual | total, N (%) | |||||
| Living with children | 7 (3.20),–1.1 | 107 (48.90), 0.3 | 60 (27.40), 0.8 | 43 (19.60), 0.3 | 2 (0.90), −2.4 | 219 (100.00) | 12.884a | 4 | p = 0.012 | |
| Not living with children | 20 (5.80), 0.9 | 160 (46.80), −0.2 | 78 (22.80), −0.7 | 62 (18.10), −0.3 | 22 (6.40), 1.9 | 342 (100.00) | ||||
| Total | 27 (4.80) | 267 (47.60) | 138 (24.60) | 105 (18.70) | 24 (4.30) | 561 (100.00) | ||||
Table 9.
Black or white only × BMI category (imputed) cross tabulation
| Ethnic group | Weight (BMI) category (imputed) |
Total |
χ2 tests |
|||||||
|---|---|---|---|---|---|---|---|---|---|---|
| under weight, N (%), std residual | normal weight, N (%), std residual | over weight, N (%), std residual | obese, N (%), std residual | morbidly obese, N (%), std residual | total, N (%), std residual | Pearson χ2 | value | df | asymp. Sig. (2-sided) | |
| Black | 6 (6.60), 0.6 | 30 (33.00),–2.0 | 35 (38.50), 2.8 | 19 (20.90),0.4 | 1 (1.10),–1.6 | 91 (100.00) | 18.309 | 4 | p < 0.001 | |
| White | 20 (4.80), −0.3 | 211 (50.20), 0.9 | 87 (20.70),–1.3 | 79 (18.80),–0.2 | 23 (5.50),0.7 | 420 (100.00) | ||||
| Total | 26 (5.10) | 241 (47.20) | 122 (23.90) | 98 (19.20) | 24 (4.70) | 511 (100.00) | ||||
Table 10.
Occupation (employed-Y/N) × BMI category (imputed) cross tabulation
| Employment status (employed-Y/N) | Weight (BMI) category (imputed) |
χ2 tests |
||||||||
|---|---|---|---|---|---|---|---|---|---|---|
| underweight, N (%), std residual | normal weight, N (%), std residual | overweight, N (%), std residual | obese, N (%), std residual | morbidly obese, N (%), std residual | total, N (%) | Pearson χ2 | value | df | asymp. Sig. (2-sided) | |
| Employed | 20 (5.00), 0.1 | 212 (52.60), 1.5 | 98 (24.30),–0.1 | 67 (16.60),–1.0 | 6 (1.50), −2.7 | 403 (100.00) | 37.030 | 4 | p < 0.001 | |
| Not employed | 7 (4.40), −0.2 | 55 (34.80), −2.3 | 40 (25.30), 0.2 | 38 (24.10), 1.5 | 18 (11.40), 4.3 | 158 (100.00) | ||||
| Total | 27 (4.80) | 267 (47.60) | 138 (24.60) | 105 (18.70) | 24 (4.30) | 561 (100.00) | ||||
Table 11.
Do physical activity × BMI category (imputed) cross tabulation
| Do physical activity | BMI category (imputed) |
χ2 tests |
||||||||
|---|---|---|---|---|---|---|---|---|---|---|
| underweight, N (%), std residual | normal weight, N (%),std residual | overweight, N (%), std residual | obese, N (%),std residual | morbidly obese, N (%), std residual | total, N (%) | Pearson χ2 | value | df | asymp. Sig. (2-sided) | |
| Yes | 9 (2.60), −1.8 | 198 (57.90), 2.8 | 83 (24.30),–0.1 | 48 (14.00),–2.0 | 4 (1.20), −2.8 | 342 (100.00) | 58.279 | 4 | p < 0.0001 | |
| No | 18 (8.20), 2.3 | 69 (31.50),–3.5 | 55 (25.10), 0.2 | 57 (26.00), 2.5 | 20 (9.10), 3.5 | 219 (100.00) | ||||
| Total | 27 (4.80) | 267 (47.60) | 138 (24.60) | 105 (18.70) | 24 (4.30) | 561 (100.00) | ||||
Table 12.
Do physical activity × overweight/obese combined (imputed) cross tabulation
| Do physical activity | Overweight/obese combined (imputed) |
χ2 tests |
|||||
|---|---|---|---|---|---|---|---|
| normal weight, N (%), residual | overweight/obese, N (%), residual | total, N(%), residual | Pearson χ2 | value | df | asymp. Sig. (2-sided) | |
| Yes | 198 (59.5), 2.4 | 135 (40.5), −2.4 | 333 (100.00) | 31.665 | 1 | p < 0.0001 | |
| No | 69 (61.70),–3.1 | 132 (38.30), 3.1 | 201 (100.00) | ||||
| Total | 267 (50.00) | 129 (50.00) | 534 (100.00) | ||||
The analysis of income vis-à-vis BMI categories (reduced to two categories namely normal weight and overweight/obese) indicates a higher prevalence of overweight and obesity in the lowest income bracket compared to others (Table 13).
Table 13.
Overweight/obese combined (imputed) × income cross tabulation
| Weight (BMI) category (imputed) | Income |
χ2 tests |
||||||
|---|---|---|---|---|---|---|---|---|
| less than GBP 231 per week or less than GBP 12,000 per year, N (%), residual | GBP 231–673 per week or GBP 12,001–35,000 per year, N(%), residual | over GBP 673 per week or over GBP 35,000 per year N(%), residual | total, N (%) | Pearson χ2 | value | df | asymp. Sig. (2-sided) | |
| Normal weight | 115 (43.10),–0.9 | 111 (41.60), 0.1 | 41 (15.40), 1.6 | 267 (100.00) | 6.681 | 2 | p = 0.035 | |
| Overweight/obese | 135 (50.60), 0.9 | 109 (40.80),–0.1 | 23 (8.60),–1.6 | 267 (100.00) | ||||
| Total | 250 (46.80) | 220 (41.20) | 64 (12.00) | 534 (100.00) | ||||
Time Preference and Overweight/Obesity
In the evaluation of time preference against people's obesity status, BMI groups were categorized into normal weight (n = 267) and overweight or obese categories (n = 267). This categorization, therefore, excludes the underweight individuals. To assess participants' time preference, they were presented with 6 options (see Tables 14, 15). Option 1 involves immediate consumption of the good, with the waiting time and reward increasing with the options, up to 3 years and GBP 1,500, respectively, for option 6.
Table 14.
Overweight/obese combined (imputed) × b14_time_pref cross tabulation
| Weight (BMI) category (imputed) | b14_time_pref |
χ2 tests |
|||||||||
|---|---|---|---|---|---|---|---|---|---|---|---|
| option 1: take GBP 1,000 now, N (%), residual | option 2: wait 3 months and receive GBP 1,100, N (%), residual | option 3: wait 6 months and receive GBP 1,200, N (%), residual | option 4: wait 1 year and receive GBP 1,300, N(%), residual | option 5: wait 2 years and receive GBP 1,400, N (%), residual | option 6: wait 3 years and receive GBP 1,500, N(%), residual | total, N (%) | Pearson χ2 | value | df | asymp. Sig. (2-sided) | |
| Normal weight | 38 (14.20),–5.2 | 18 (6.70), −0.4 | 89 (33.60), 1.7 | 85 (31.80), 4.0 | 10 (3.70),0.2 | 27 (10.10), 1.1 | 267 (100.00) | 95.921 | 5 | p< 0.0001 | |
| Overweight/obese | 135 (50.60),5.2 | 22 (8.20), 0.4 | 59 (22.10),–1.7 | 25 (9.40), −4.0 | 9 (3.40), −0.2 | 17 (6.40),–1.1 | 267 (100.00) | ||||
| Total | 173 (32.40) | 40 (7.50) | 148 (27.70) | 110 (20.60) | 19 (3.60) | 44 (8.20) | 534 (100.00) | ||||
Table 15.
Crosstab physical activity × risk/time preference
| Crosstab do physical activity | Time preference |
χ2 tests |
|||||||||
|---|---|---|---|---|---|---|---|---|---|---|---|
| option 1: take GBP 1,000 now, N(%), residual | option 2: wait 3 months and receive GBP 1,100, N(%), residual | option 3: wait 6 months and receive GBP 1,200, N(%), residual | option 4: wait 1 year and receive GBP 1,300, N(%), residual | option 5: wait 2 years and receive GBP 1,400, N(%), residual | option 6: wait 3 years and receive GBP 1,500, N(%), residual | total, N (%) | Pearson χ2 | value | df | asymptotic significance (2-sided) | |
| Yes | 76 (22.20),–3.0 | 26 (7.60), 0.2 | 104 (30.40),1.0 | 81 (23.70), 0.8 | 16 (4.70),0.7 | 39 (11.40), 1.9 | 342 (100.00) | 37.832 | 5 | p < 0.0001 | |
| No | 99 (45.20),3.7 | 15 (6.80), −0.3 | 51 (23.30),–1.2 | 40 (18.30),–1.1 | 6 (2.70), −0.9 | 8 (3.70), −2.4 | 219 (100.00) |
||||
| Total count | 175 (31.20) | 41 (7.30) | 155 (27.60) | 121 (21.60) | 22 (3.90) | 47 (8.40) | 561 (100.00) |
||||
The results presented in Table 14 indicate significant association between time preference and overweight/obesity (Pearson χ2 = 95.921, df = 5, and p < 0.0001) with normal weight persons preferring to wait longer for a larger reward compared to those having overweight or obesity who prefer immediate less rewards than larger rewards in the future. As waiting time increases, less of those having overweight or obesity choose that option indicating the high level of impatience for people having overweight or obesity.
Further analysis was conducted to explore the relationship between time preference and employment status, income and education levels, and ethnicity. Time preference is significantly associated with employment status, income levels, education levels, and ethnicity (blacks and whites only) with p < 0.0001 (Table 16) for all of them. There is a similar result in terms of physical activity and time preference (p < 0.0001) as reported above in Table 15.
Table 16.
Correlations
| Spearman's ρ | Occupation (employed-Y/N) | Income | Education (high or low) | Ethnicity (black or white only) |
|---|---|---|---|---|
| Time preference | ||||
| Rho | −0.171** | 0.230** | 0.258** | 0.169** |
| p value | <0.0001 | <0.0001 | <0.0001 | <0.0001 |
| N | 561 | 561 | 561 | 511 |
Correlation is significant at the 0.01 level (2-tailed).
Discussion
Intertemporal choice, which is about the relative value people assign to payoffs at different points in time, has relevance for the understanding of people's obesity risk reduction behaviours. There have been many suggestions, largely based on analysis of survey and real-world data collected for different purposes, that increase in obesity is linked to a general increase in people's time preference and discount rates. However, there is no strong empirical evidence of this [23] particularly in the UK context. Most weight control interventions at individual levels require the person to forgo sedentary lifestyles and the current consumption of unhealthy foods in order to reap future health gains. When an individual makes immediate decisions of diet and activity, the future health consequences should normally be incorporated into the decision-making process. We therefore need to understand how people make decisions involving outcomes occurring at different time-points. This would inform policies and intervention programmes to better target and influence behaviours away from unhealthy lifestyles.
This research provides valuable understanding of people having overweight and obesity in the UK vis-à-vis the people having normal weight. People that reported to be having families with children have less cases of overweight and obesity compared to people who do not have children in their families.
The established relationship between higher BMI and less physical activities and black populations is confirmed by our analysis. The latter could be because the extra weight is regarded as a sign of affluence in some black cultures. This is even more pronounced in the first generation of black immigrants. We did not collect further information to indicate whether the people are from 1st, 2nd, or 3rd immigrant generation backgrounds. However, there could be possibilities of assimilation effects among people who have been in the UK for long as revealed by Akresh [24] among Hispanic immigrants in the USA. However, an alternative explanation might be that socio-economic disadvantages (a well-established risk factor for obesity) is concentrated among Black population groups.
Consistent with Morris [25] whose modelling studies using data from Health Survey for England “show that obesity has a statistically significant and negative effect on employment in both males and females,” those in employment in our sample are more likely to be within normal weight (BMI) categories compared to the unemployed population. Higher BMI in lower income groups has also been observed. We speculate this could be explained, by extension, by the relationship between employment status and BMI. People who are employed are expected to earn higher than those who are not in any form of employment.
Our findings indicate that people who are overweight or obese tend to prefer less immediately than more in the future. An earlier study by Borghans and Golsteyn [26] from a Dutch survey found no evidence of direct relationship between discounting rate and weight status. They therefore suggested that increase in BMI is more likely explained by changes in other parameters that determine the intertemporal decisions. Similarly, in a more recent study in older English population using savings as a proxy for time preference, Pickering et al. [27] found no clear “relationship between saving behaviour and being overweight or obese.” These conclusions were largely drawn from studies or surveys conducted for purposes other than investigating the association between time preference and obesity. In a systematic literature review by Barlow et al. [28], “five cross-sectional studies report higher discount rates in individuals with higher BMIs when measuring discounting using hypothetical monetary and food rewards.”
For their part, Stoklosa et al. [29], using data obtained from Family Health Habits Survey, an Internet-based survey conducted in 2011 among the participants of the Nielsen National Consumer Panel in the USA, found that intertemporal preferences have intergenerational effects in that “children of impatient or present-biased parents have a significantly higher likelihood of being obese, too.”
This study has several limitations. Participants in the survey are not a true representation of cross-sections of the UK's population. However, the sample size required was exceeded (561 vs. 540). The study underreports participants from Asian and Middle East backgrounds. However, an Iranian study of 792 participants using a structured questionnaire found a “statistically significant correlation between obesity and both the long-run patience and present-biased preferences of participants [30].”
Our survey had a higher proportion of younger participants compared to the UK's population. This is not inconsistent with many surveys [31, 32, 33, 34, 35, 36]. This can be explained by the medium or the platform used for the survey. The presence of younger people in Internet-based social media platforms is higher than older populations [37, 38, 39, 40]. We also acknowledge that the proportion of participants from black backgrounds is higher than what one will find in the UK population because a very high number of flyers were distributed in events and to groups of African backgrounds. This has however presented an opportunity to provide critical and greater in-depth analysis of that population.
There is higher than normal proportion of participants from higher education backgrounds. A number of academic research organizations such as the Association of the Studies of Obesity in the UK and its affiliated regional associations/societies advertised the survey in their websites. These are in addition to the several academic conferences attended by the researchers where posters on the survey were displayed.
As results of stigma [41], there is a possibility that people with overweight or obesity may be reluctant to complete the survey. Notwithstanding, the survey provided details of overweight/obesity consultant for participants to contact for help. This may also entice people to complete the survey. However, for ethical reasons, we did not collect any form of data or information on who may have contacted the consultant. BMI scores were calculated from height and weight measurements provided by the participants themselves. Self-reporting can be prone to bias.
Conclusions
The relationship between time preference and overweight/obesity is clear in this research. Individuals with low time preference, who are prepared to wait for higher returns in the future, are less likely to have overweight or obesity than those who prefer immediate rewards. Individuals having normal weight are also more likely to have higher uptakes of physical activities and healthy behaviours.
As far as our knowledge is concerned, this is the first study of its kind in the UK using empirical data collected specifically to assess time preference and overweight/obesity. Previous economic studies exploring the influence of time preference on weight gain, mostly in the USA and other countries, used already existing data collected for other purposes to assess the relationship between obesity and time preference.
The findings of this empirical study have salient policy implications. The public health programmes of promoting physical activities and healthy eating should include economic intervention strategies aimed at influencing people's time preference and intertemporal choice to value larger and future health benefits described as utilities-in-anticipation, hence, see physical activities and healthy lifestyles as investments in health. Behavioural economists have acknowledged that individuals often take the path of placing disproportionate emphasis on utilities-in-use (immediate gratification), for example, sedentary lifestyles and unhealthy eating instead of utilities-in-anticipation (future health benefits), such as obesity risk reduction activities through exercise and healthy eating. People's preventive behaviours today can be predicted by finding out what their rates of time preference are. This could therefore be vital in improving population's uptake and maintenance of health behaviours.
The cultural or ethnic variations in relation to time preference could be a factor in the high prevalence of overweight and obesity in some ethnic groups. People from black backgrounds tend to have overweight or obesity and have high time preference compared to those from white backgrounds. Public health interventions should therefore factor such ethnic variations and have tailored programmes for people from black backgrounds.
Statement of Ethics
This research was approved by the Research and Innovation Services Department of the University of South Wales (approved date − April 14, 2016) and conducted in accordance with guidelines of the University of South Wales and ESRC framework for research ethics. This study complies with the Ethical Principles for Medical Research Involving Human Subjects of the World Medical Association Declaration of Helsinki. All study participants were provided with participant information sheet covering all aspects of confidentiality and data collection, usage, storage, and sharing. No one could participate in the online survey without consenting to do so.
Conflict of Interest Statement
The authors have no conflicts of interest to declare.
Funding Sources
We have not received any specific funding for this research.
Author Contributions
Dr. Morro M.L. Touray designed, sought ethical approval, setup, and carried out the study. Dr. Morro was also responsible for data management, cleaning, analysis, and wrote the study report. He also drafted the manuscript and approved the final version of the manuscript. Prof. David Cohen was the study director and supervised the design, implementation of the study, data analysis, and interpretation. He also directed and supervised the writing up of the final reports and this manuscript. He has approved the final version of the manuscript. Dr. Simon Williams served as a subject specialist adviser and contributed to study design, data analysis, and interpretation. Dr. Williams commented on the study reports and earlier versions of the manuscript and approved the final version of the manuscript. Dr. Mohammed Fasihul Alam helped with supervision and statistical data analysis. He commented on the earlier versions of the manuscript and approved the final version of the manuscript. Dr. Sam Groves helped with supervision and contributed to the design of the questionnaire and led the piloting and approved the final version of the manuscript. Dr. Mirella Longo reviewed study design and contributed to the data analysis and interpretation and study write-ups and approved the final version of the manuscript. Prof. Heather Gage made significant contributions to the earlier and all versions of the manuscript and approved the final version.
Data Availability Statement
Ownership of the study data belongs to USW. This study took place before the introduction of the General Data Protection Regulation (EU) 2016/679 in the UK (in May 2018), and consent to share the data was not sought.
Supplementary Material
Supplementary data
Supplementary data
Acknowledgments
We are very grateful to the study participants who took the time to help us with the piloting of the questionnaire and took part in the main survey. We would like to thank Dr. Paul Jarvis and other Statisticians based at the University of South Wales and the University of Surrey, respectively, for their advice on the statistical analyses.
Study registration: The study was not registered. It was part of packages of Ph.D. research projects funded by the University of South Wales (USW). No specific protocol was therefore prepared prior, and the study was directed by a study director and guided by an obesity specialist adviser and a team of Ph.D. Research Supervisors − all of whom are co-authors of the paper. The arrangement is in line with the rules and regulations of USW.
References
- 1.The NHS Information Centre Lifestyle Statistics . Statistics on obesity, physical activity and diet. 1st ed. England: The Health and Social Care Information Centre, NHS, UK; 2009. [Google Scholar]
- 2.Owen L, Morgan A, Fischer A, Ellis S, Hoy A, Kelly MP. The cost-effectiveness of public health interventions. J Public Health. 2011;34((1)):37–45. doi: 10.1093/pubmed/fdr075. [DOI] [PubMed] [Google Scholar]
- 3.Greenway FL. Physiological adaptations to weight loss and factors favouring weight regain. Int J Obes. 2015;39:1188–96. doi: 10.1038/ijo.2015.59. [DOI] [PMC free article] [PubMed] [Google Scholar]
- 4.Jung RT. Obesity as a disease. Br Med Bull. 1997;53((2)):307–21. doi: 10.1093/oxfordjournals.bmb.a011615. [DOI] [PubMed] [Google Scholar]
- 5.Jastreboff AM, Kotz CM, Kahan S, Kelly AS, Heymsfield SB. Obesity as a disease: the obesity society 2018 position statement. Obesity. 2019;27((1)):7–9. doi: 10.1002/oby.22378. [DOI] [PubMed] [Google Scholar]
- 6.Dobbs R, Sawers C, Thompson F, Manyika J, Woetzel JR, Child P, et al. Overcoming obesity: an initial economic analysis. McKinsey Global Institute; 2014. [Google Scholar]
- 7.Public Health England . Guidance − Health Matters: Obesity and the food environment. England, London: Public Health England; 2017. [Google Scholar]
- 8.National Health Service Scotland . Public attitudes towards reducing levels of overweight and obesity in Scotland. Glasgow: NHS Scotland; 2017. [Google Scholar]
- 9.Public Health Wales NHS Trust . The case for action on obesity in Wales. Cardiff: Public Health Wales NHS Trust; 2018. [Google Scholar]
- 10.McGimpsey MMLA. A fitter future for all consultation report: obesity prevention framework for Northern Ireland 2011–2021. Belfast, Northern Ireland: Ministry for Health; 2011. [Google Scholar]
- 11.Cohen DR. Utility model of preventive behaviour. J Epidemiol Community Health. 1984;38:61–5. doi: 10.1136/jech.38.1.61. [DOI] [PMC free article] [PubMed] [Google Scholar]
- 12.Becker MH, Maiman LA. Sociobehavioral determinants of compliance with health and medical care recommendations. Med Care. 1975;13:10–24. doi: 10.1097/00005650-197501000-00002. [DOI] [PubMed] [Google Scholar]
- 13.Rosenstock IM. Why people use health services. Milbank Mem Fund Q. 1966;44 [PubMed] [Google Scholar]
- 14.Philipson T. The world-wide growth in obesity: an economic research agenda. Health Econ. 2001;10((1)):1–7. doi: 10.1002/1099-1050(200101)10:1<1::aid-hec586>3.0.co;2-1. [DOI] [PubMed] [Google Scholar]
- 15.Rosin O. The economic causes of obesity: a survey. J Econ Sur. 2008;22((4)):617–47. [Google Scholar]
- 16.Grossman M. The demand for health: a theoretical and empirical investigation. Columbia, USA: Columbia University Press; 2017. [Google Scholar]
- 17.Smith PK, Bogin B, Bishai D. Are time preference and body mass index associated? Evidence from the national longitudinal survey of youth. Econ Hum Biol. 2005;3((2)):259–70. doi: 10.1016/j.ehb.2005.05.001. [DOI] [PubMed] [Google Scholar]
- 18.Falk A, Becker A, Dohmen T, Huffman D, Sunde U. The preference survey module: a validated instrument for measuring risk, time, and social preferences. 2016. [Google Scholar]
- 19.Kirby KN. One-year temporal stability of delay-discount rates. Psychon Bull Rev. 2009;16((3)):457–62. doi: 10.3758/PBR.16.3.457. [DOI] [PubMed] [Google Scholar]
- 20.Anokhin AP, Golosheykin S, Grant JD, Heath AC. Heritability of delay discounting in adolescence: a longitudinal twin study. Behav Genet. 2011;41((2)):175–83. doi: 10.1007/s10519-010-9384-7. [DOI] [PMC free article] [PubMed] [Google Scholar]
- 21.Cairns JA, van der Pol M. The estimation of marginal time preference in a UK-wide sample (TEMPUS) project: a review. Health Tech Assess. 2000;4((1)):84. [PubMed] [Google Scholar]
- 22.Charan J, Biswas T. How to calculate sample size for different study designs in medical research? Indian J Psychol Med. 2013;35((2)):121–6. doi: 10.4103/0253-7176.116232. [DOI] [PMC free article] [PubMed] [Google Scholar]
- 23.Dodd M. Obesity and time-inconsistent preferences. Obes Res Clin Pract. 2008;2((2)):71–142. doi: 10.1016/j.orcp.2008.04.006. [DOI] [PubMed] [Google Scholar]
- 24.Akresh IR. Dietary assimilation and health among hispanic immigrants to the United States. J Health Soc Behav. 2007;48((4)):404–17. doi: 10.1177/002214650704800405. [DOI] [PubMed] [Google Scholar]
- 25.Morris S. The impact of obesity on employment. Labour Economics. 2007;14((3)):413–33. [Google Scholar]
- 26.Borghans L, Golsteyn BH. Time discounting and the body mass index: Evidence from the Netherlands. Econ Hum Biol. 2006;4((1)):39–61. doi: 10.1016/j.ehb.2005.10.001. [DOI] [PubMed] [Google Scholar]
- 27.Pickering K, Monahan M, Guariglia A, Roberts TE. Time to tighten the belts? Exploring the relationship between savings and obesity. PLoS One. 2017;12((6)):e0179921. doi: 10.1371/journal.pone.0179921. [DOI] [PMC free article] [PubMed] [Google Scholar]
- 28.Barlow P, Reeves A, McKee M, Galea G, Stuckler D. Unhealthy diets, obesity and time discounting: a systematic literature review and network analysis. Obes Rev. 2016;17((9)):810–9. doi: 10.1111/obr.12431. [DOI] [PMC free article] [PubMed] [Google Scholar]
- 29.Stoklosa M, Shuval K, Drope J, Tchernis R, Pachucki M, Yaroch A, et al. The intergenerational transmission of obesity: the role of time preferences and self-control. Econ Hum Biol. 2018;28:92–106. doi: 10.1016/j.ehb.2017.12.004. [DOI] [PubMed] [Google Scholar]
- 30.Soofi M, Sari A, Rezaei S, Hajizadeh M, Najafi F. Individual time preferences and obesity: a behavioral economics analysis using a quasi-hyperbolic discounting approach. Int J Soc Econ. 2019;47((1)):16–26. [Google Scholar]
- 31.Smith G. ERIC document reproduction service no ED 501717. 2008. Does gender influence online survey participation? A record-linkage analysis of university faculty online survey response behavior. [Google Scholar]
- 32.Markanday S, Brennan SL, Gould H, Pasco JA. Sex-differences in reasons for non-participation at recruitment: geelong osteoporosis study. BMC Res Notes. 2013;6((1)):104. doi: 10.1186/1756-0500-6-104. [DOI] [PMC free article] [PubMed] [Google Scholar]
- 33.Porter SR, Whitcomb ME. Non-response in student surveys: the role of demographics, engagement and personality. Res High Educ. 2005;46((2)):127–52. [Google Scholar]
- 34.Underwood D, Kim H, Matier M. AIR 2000 annual forum paper. 2000. To mail or to web: comparisons of survey response rates and respondent characteristics. [Google Scholar]
- 35.Dunn KM, Jordan K, Lacey RJ, Shapley M, Jinks C. Patterns of consent in epidemiologic research: evidence from over 25,000 responders. Am J Epidemiol. 2004;159((11)):1087–94. doi: 10.1093/aje/kwh141. [DOI] [PubMed] [Google Scholar]
- 36.Scottish Care Experience Survey Programme . Technical report: a national statistics publication for Scotland St Andrew's House Edinburgh EH1 3DG. The Scottish Government; 2016. [Google Scholar]
- 37.Glass DC, Kelsall HL, Slegers C, Forbes AB, Loff B, Zion D, et al. A telephone survey of factors affecting willingness to participate in health research surveys. BMC public health. 2015;15:1017. doi: 10.1186/s12889-015-2350-9. [DOI] [PMC free article] [PubMed] [Google Scholar]
- 38.Fang X, Yen DC. Demographics and behavior of internet users in China. Technol Soc. 2006;28((3)):363–87. [Google Scholar]
- 39.Office for National Statistics . Internet users: 2015-Adults who have and have not used the internet in the last 3 months including adults who have never used the internet. Government Buildings, Cardiff Road, Newport, South Wales, NP10 8XG: 2015. [Google Scholar]
- 40.Morris A, Goodman J, Brading H. Internet use and non-use: views of older users. Univ Access Inf Soc. 2007;6((1)):43–57. [Google Scholar]
- 41.Fruh SM, Nadglowski J, Hall HR, Davis SL, Crook ED, Zlomke K. Obesity stigma and bias. J Nurse Pract. 2016;12((7)):425–32. doi: 10.1016/j.nurpra.2016.05.013. [DOI] [PMC free article] [PubMed] [Google Scholar]
Associated Data
This section collects any data citations, data availability statements, or supplementary materials included in this article.
Supplementary Materials
Supplementary data
Supplementary data
Data Availability Statement
Ownership of the study data belongs to USW. This study took place before the introduction of the General Data Protection Regulation (EU) 2016/679 in the UK (in May 2018), and consent to share the data was not sought.