

Abstract
Background:
Predictive analytics monitoring, the use of patient data to provide continuous risk estimation of deterioration, is a promising new application of Big Data analytical techniques to the care of individual patients. We tested the hypothesis that continuous display of novel electronic risk visualization of respiratory and cardiovascular events would impact ICU patient outcomes.
Methods:
In an adult tertiary care Surgical Trauma ICU, we displayed risk estimation visualizations on a large monitor, but in the Medical ICU in the same institution we did not. The risk estimates were based solely on analysis of continuous cardiorespiratory monitoring. We examined 4275 individual patient records within a seven month time period preceding and following data display. We determined cases of septic shock, emergency intubation, hemorrhage, and death to compare rates per patient care pre-and post-implementation.
Results:
Following implementation, the incidence of septic shock fell by half (p<0.01 in a multivariate model that included age and APACHE) in the Surgical Trauma ICU, where the data were continuously on display, but by only 10% (p=NS) in the control Medical ICU. There were no significant changes in the other outcomes.
Conclusion:
Display of a predictive analytics monitor based on continuous cardiorespiratory monitoring was followed by a reduction in the rate of septic shock, even when controlling for age and APACHE score.
Keywords: predictive analytics monitoring, continuous display, big data, sepsis
Introduction
Surgical trauma intensive care unit (ICU) patients are at high risk for unexpected clinical deterioration. Subacute illnesses, such as hemorrhage, sepsis, or respiratory decompensation occur in up to 10% of ICU patients and increase the length of stay and the death rate by several-fold.1,2 Decisions to treat in early stages of subacute illness may improve clinical outcomes3, yet recognizing early stages continues to be elusive for clinicians. Drawing attention to patients who may be deteriorating can allow for earlier clinical intervention and improved patient outcomes.4,5
We developed a visual representation of fold-risk for clinical deterioration and continuously display this representation on LCD monitors within patient care units. Known as CoMET ® (Continuous Monitoring of Event Trajectories; Advanced Medical Predictive Devices, Diagnostics, and Displays, Charlottesville, VA), these displays were employed on large screens in an adult Surgical and Trauma ICU (STICU) at a tertiary care academic medical center since June 2015. CoMET utilizes multivariate predictive models based on, for example, heart rate, respiratory rate (RR), SpO2, the RR-SPO2 correlation coefficient, detrended fluctuation analysis of RR intervals,27,28 density scores, and the standard deviation of RR intervals gleaned from continuous cardiorespiratory models taken every 2 seconds with model risk updates every 15 minutes. Only continuous cardiorespiratory monitoring data are used in the risk estimations. As shown in Figure 1, we display the fold-increase in risk of respiratory failure leading to urgent unplanned intubation9 on the vertical axis and the fold-increase in risk of hemorrhage leading to large unplanned transfusion26 on the horizontal axis. Based on feedback from ICU bedside clinicians, the axes are labeled “Respiratory instability” and “Cardiovascular instability,” respectively. Previously, we showed that the risk of sepsis was more correlated with the respiratory failure model in the STICU, and with the hemorrhage model in the Medical ICU (MICU).1 We hypothesized that display of this predictive analytics monitor would improve patient outcomes based on the premise of earlier detection and clinical action.
Figure 1.

(top) Visual representation of the CoMET display as it appeared on a large screen monitor in the Surgical ICU. Units on the Respiratory and Cardiovascular instability axes represent the fold-increase in risk compared to average for emergency intubation and hemorrhage, respectively. Each bed is represented by a comet with the bed number in the head. The head of the comet represents the risks at the current time, and the tail is three hours long. (bottom) A patient in bed 86 has been selected for individual inspection. This patient’s respiratory (green) and cardiovascular (orange) instability over the preceding 24 hours is displayed in the bottom right. The respiratory instability rose from average risk (1-fold) to 5-fold average risk over the ten hours prior to emergency intubation at 19:35. Similarly, cardiovascular instability fluctuated between average and 2-fold average; a blood culture for suspicion of infection was ordered at 18:22. These data were taken from recorded real-time monitoring performed during this patient’s hospital stay, prior to the period that CoMET was displayed in the SICU.
Methods
Study design
We conducted a retrospective cohort study to assess differences in clinical outcomes pre-and post-implementation of the CoMET display where the STICU served as the test unit (i.e., CoMET displayed) compared to the MICU, the control unit (i.e., no display), at a large tertiary care academic center. We reviewed individual patient records from all admissions from December 2014 to February 2016 to the medical and surgical intensive care units (n = 4,275) using the Epic electronic medical record and clinical databases (e.g., clinical data warehouse, blood bank records), we collected the following data: APACHE score, age, gender, length of ICU and hospital stay, mortality, packed red blood cell transfusion, and identified septic shock and emergent intubation cases.
Clinical outcomes of interest
Sepsis cases (Figure 2).
Figure 2.
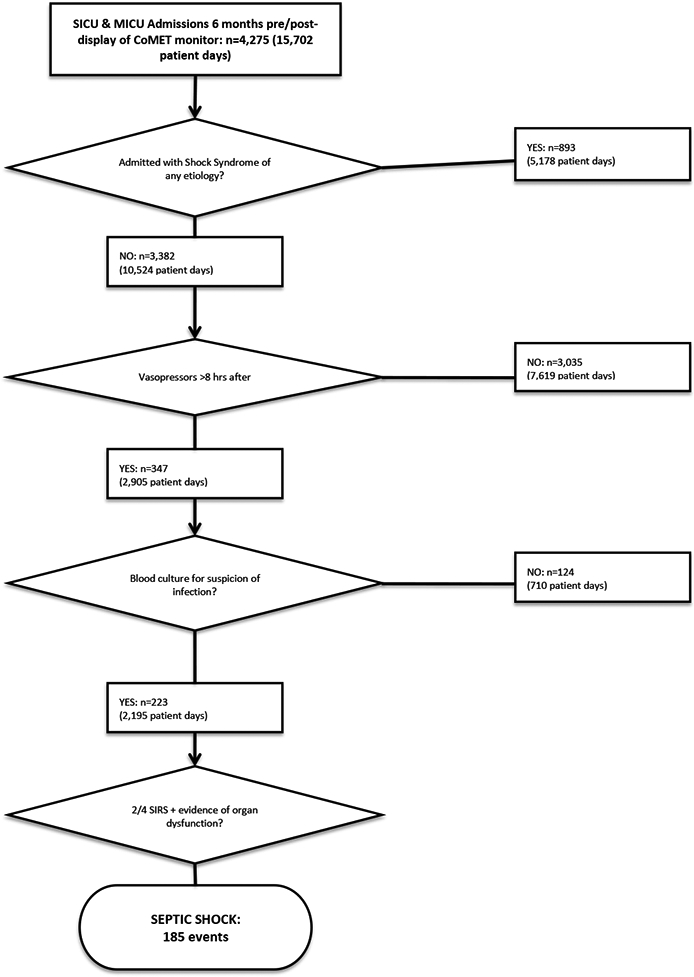
Flowchart depiction of the methodology for evaluation for septic shock in the electronic medical record.
We used Surviving Sepsis Campaign guidelines where the suspicion of infection was a blood culture with documentation in the record supporting the clinical intent. This is a Sepsis-2 definition. To identify cases of septic shock, patient records were first screened for mean arterial pressure less than 60mm Hg despite fluid resuscitation, or vasopressor administration >8 hours after time of admission. We then sought blood culture orders for suspicion of infection within 48 hours prior to or after being placed on vasopressors. Finally, if a patient met criteria for severe sepsis (2/4 SIRS plus organ failure) within 12 hours prior to or after their blood culture order, the admission was recorded as an instance of septic shock. Patients admitted with a shock syndrome, as indicated by admission diagnosis and/or treatment with vasoactive medications within 8 hours of ICU admission, were excluded.
Emergent intubation cases (Figure 3).
Figure 3.
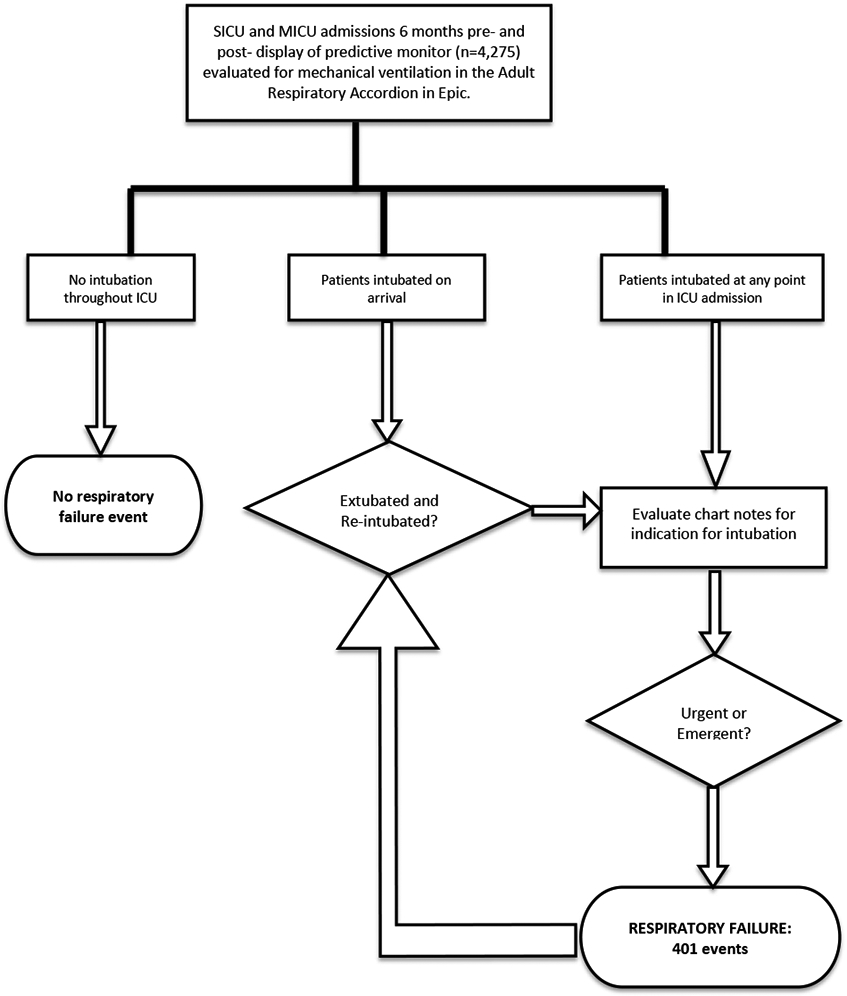
Flowchart depiction of methodology for the evaluation of respiratory failure events in the electronic medical record.
Respiratory failure was defined as emergent or urgent intubation occurring after admission to the intensive care unit. A flowsheet in our electronic medical record (the Adult Respiratory Accordion) was examined for mechanical ventilation during each patient’s ICU stay. Intubations occurring in the field, emergency department (ED), operating room (OR), another inpatient unit, or in an outside hospital were excluded, as indicated by a patient arriving to the unit on mechanical ventilation. If an intubation was identified in the Adult Respiratory Accordion, the Respiratory Therapy note or the Intubation Procedure note were searched for the indication for intubation. If a clinician documented the event as emergent or urgent, it was recorded as an instance of respiratory failure.
Hemorrhage.
Hemorrhage was defined as infusion of three units of packed red blood cells within 24 hours. Data was obtained from the institution’s blood bank records.
Mortality.
Mortality was defined as death occurring in the intensive care unit during that admission. Data were obtained from the institution’s Data Warehouse.
Length of stay.
Data on patient length of stay were obtained from the institution’s clinical data repository.
Statistical Methods:
Rate ratio, or events per patient per day post-CoMET implementation divided by events per patient per day pre-CoMET implementation, was calculated for each outcome of interest. We compared groups using a Wilcoxon rank sum test for continuous variables and using the pooled sample proportion for rate data. Confidence intervals for individual event rates were based on a Poisson distribution. An exact binomial test was used to determine the confidence intervals and p-values for rate ratios. A p-value <0.05 was considered statistically significant. We used R version 3.3 software.
Results
Patent population
From December 1, 2014 to February 1, 2016, there were 1,747 admissions to the STICU and 2,528 admissions to the MICU. These data represented 5,780 SICU patient days and 9,922 MICU patient days. Demographics appear in Table 1. 1,410 and 1,972 patients, for the STICU and MICU, respectively, met inclusion criteria for evaluation for septic shock (i.e., were not admitted with any shock syndrome). All admissions were evaluated for respiratory failure, hemorrhage, death, and length of stay.
Table 1:
Demographics of the study population showing median (IQR)
| STICU | MICU | |||||
|---|---|---|---|---|---|---|
| Pre-CoMET | Post-CoMET | p | Pre-CoMET | Post-CoMET | p | |
| Admits | 840 | 907 | 1204 | 1324 | ||
| ICU stay (days) | 1.6 (0.9 - 3.2) | 1.6 (0.9 - 3.2) | 0.917 | 2.3 (1.1 - 4.5) | 2.2 (1.2 - 4.4) | 0.837 |
| Shock on admit | 16% | 22% | 0.002 | 21% | 23% | 0.453 |
| Male | 59% | 60% | 0.760 | 55% | 54% | 0.729 |
| Age | 59 (46 - 70) | 61 (48 - 72) | 0.090 | 62 (52 - 72) | 63 (50 - 73) | 0.990 |
| APACHE | 9 (5 - 14) | 9 (5 - 14) | 0.639 | 12 (6 - 17) | 11 (6 - 17) | 0.482 |
| CCI | 2 (0 - 6) | 2 (0 - 5) | 0.257 | 4 (2 - 8) | 4 (2 - 8) | 0.045 |
| DNR | 6% | 8% | 0.193 | 27% | 29% | 0.354 |
| DNI | 0.10% | 0.20% | 0.609 | 1.20% | 2.90% | 0.003 |
An example of the predictive analytics monitoring display
A representative case illustrating a situation in which CoMET may have impacted a patient’s course, is demonstrated in Figure 1. This patient ultimately underwent emergent intubation and a blood culture order for suspicion of infection. We note that the respiratory instability score rose from average (1-fold) to 5-fold average risk over the 10 hours prior to both respiratory failure and the clinical concern for sepsis. We hypothesized that the presence of the CoMET monitor would have prompted an unscheduled clinician visit to the patient for a more in-depth evaluation, which would have facilitated an earlier intervention, possibly averting adverse outcomes.
Event rates before and after display implementation
Table 2 shows the major results of the study. The number of events and the event rate per patient day are given for the periods before and after implementation of the predictive analytics monitoring in the STICU. The rate of septic shock in the STICU decreased by more than half after the display of the monitor (rate ratio = 0.478, p = 0.012, Table 2). In the MICU, the rate fell by 10%, a non-significant change. The rates of respiratory failure and mortality did not change significantly in either unit when comparing the periods before and after monitor display (Table 2). The rate of hemorrhage did not change in the STICU and increased in the MICU (p = 0.001, Table 2). The average hospital length of stay did not change after display of the predictive analytics monitor (see Table 1).
Table 2.
Events, event rates per patient days, and ratios of event rates before and after CoMET display with confidence intervals and p values.
| Event | Unit | Pre CoMET | Post CoMET | Rate ratio | P value |
|---|---|---|---|---|---|
| Event, rate | Event, rate | ||||
| Septic shock | STICU | 34, 0.022 | 17, 0.010 | 0.478 (0.250 - 0.880) | 0.012 |
| Septic shock | MICU | 67, 0.024 | 67, 0.022 | 0.899 (0.631 - 1.281) | 0.546 |
| Respiratory failure | STICU | 62, 0.023 | 62, 0.020 | 0.895 (0.619 - 1.294) | 0.59 |
| Respiratory failure | MICU | 132, 0.028 | 145, 0.028 | 1.020 (0.801 - 1.302) | 0.904 |
| Hemorrhage | STICU | 128, 0.047 | 120, 0.039 | 0.839 (0.649 - 1.085) | 0.182 |
| Hemorrhage | MICU | 74, 0.015 | 129, 0.025 | 1.619 (1.208 - 2.185) | 0.001 |
| Mortality | STICU | 55, 0.020 | 70, 0.023 | 1.140 (0.789 - 1.653) | 0.475 |
| Mortality | MICU | 197, 0.041 | 225, 0.044 | 1.061 (0.872 - 1.291) | 0.559 |
To test the possibility that the fall in septic shock in the STICU was due to a large change in the patient demographics and severity of illness during the study period, we used multivariable logistic regression. The small number of septic shock events – 34 before implementing the predictive analytics monitoring display and 17 afterwards – allowed only two additional variables besides the presence or absence of display in the analysis. We chose age and APACHE score to reflect important risk factors for STICU outcomes. We found that the fall in rate of septic shock remained significant after accounting for these other risk factors (p=0.016), suggesting that the display independently impacted the outcome.
Discussion
We evaluated the impact of predictive analytics monitoring based only on continuous cardiorespiratory monitoring on patient outcomes in the ICU environment. We found a decreased rate of septic shock in the Surgical ICU where real time risk estimates for respiratory and cardiovascular instability were displayed as compared to a Medical ICU where it was not. These results remained statistically significant even after adjusting for age and APACHE score. We did not observe statistically significant differences in the rates of respiratory failure, hemorrhage, mortality, or length of stay in the year-long, single ICU study. The results are consistent with the aim of predictive analytics monitoring, which is not so much to prevent the critical illness itself – sepsis, hemorrhage or respiratory failure – as it is to allow early detection and reduce the complications, such as septic shock.
Advances in continuous bedside monitoring technology capabilities make a wealth of data available to healthcare providers’ evaluation. These data form the foundation for computational algorithms that integrate real-time bedside monitor physiologic data to provide early warning of potentially catastrophic physiologic events.1,6-15 In premature infants, for example, continuous display of the fold-increase in risk (relative to the average risk) of neonatal sepsis using a predictive analytics monitor decreased mortality in a large randomized trial of 3000 very low birth weight infants.16 The development, utilization, and testing of continuous predictive analytics monitoring in adult ICU populations are less well addressed, and produced inconsistent results.17-23 For example, display of an instability score did not change the rate of major events in 201 high-risk medical and surgical ICU patients compared to 201 controls,23 but the same intervention led to reduced instability episodes in 306 patients compared to 326 controls in a subsequent study.19 Most recently, display of a vital signs-based risk score led to reduced length of stay and mortality in 67 ICU patients compared to 75 controls.22 These algorithms all used hourly vital signs entered into the electronic health record, often as systemic inflammatory response syndrome (SIRS) criteria, and lab tests. Thus, these studies tested strategies based on static, intermittent measures from patients.
Using data from continuous bedside cardiorespiratory monitoring offers a complementary approach to early warning of patient decline. We and others have integrated continuous physiologic data into care to predict outcomes ranging from complications of subarachnoid hemorrhage to neonatal cardiopulmonary deterioration.1,6,7,9-15,26,29 while others developed models for early and more accurate sepsis prediction14,15,30-34 and tested them retrospectively. For example, we detected signatures of illness in the bedside monitor physiological data streams in adult ICU patients prior to clinical signs of sepsis, hemorrhage resulting in large transfusion, and respiratory failure resulting in urgent, unplanned intubation.1 Additionally, we found that subtle physiologic signatures of these events are detectable up to 24-hours in advance of clinical deterioration through advanced mathematical analysis of cardiorespiratory dynamics 1,9,24-26.
Our study has several strengths. First, the algorithms were developed using clinical and adverse events identified through individual medical record review.1,9 This gold standard is superior to computer database queries for clinical or coding information.35 In all, more than 8000 individual patient charts were examined for algorithm development and testing. Additionally, we controlled for institutional and other systemic changes in sepsis diagnosis and treatment by examining outcomes in the Medical ICU, that did not have CoMET and employed only conventional care. Finally, CoMET used only continuous physiologic data from the bedside monitors and did not use conventional EHR data elements such as demographics, diagnoses, lab values or nurse-charted vital signs, data prone to delayed entry and missing values.36
The study also has limitations. This was a retrospective cohort study based on outcome ascertainment conducted at a single center and may yet reflect practice changes unrelated to CoMET. Seasonal variability could not be accounted for because the study period ranged from 7 months pre-intervention to 7 months post-intervention. To counter seasonal effects, we elected to use the neighboring medical ICU as one measure of control. Possible mechanisms unrelated to the predictive analytics monitoring display that might have led to reduced septic shock in one ICU compared to another include staffing (they are very similar, with one attending intensivist per 14 to 15 beds), different sepsis-specific initiatives in the ICUs (there were none), or different levels of sepsis-specific scrutiny for quality reporting reasons (both units are scrutinized by the same central quality office using the same metrics).
Mechanisms of provider acceptance of continuous predictive analytics monitoring is not well understood, and there is little guidance to promote adoption in practice.37 Previously, we investigated factors underlying implementation of a predictive analytics monitor in the neonatal ICU that reported fold-increase in risk of neonatal sepsis in the next 24 hours. We interviewed 22 clinicians and found that the information was increasingly viewed as important once nurses and physicians routinely collected, documented, and reported the risk score during patient rounds and patient handoffs.38 Adoption increased further after finding that display of the predictive analytics monitor reduced NICU mortality by more than 20% in a very large randomized trial,16 and by 40% in infants who were diagnosed with sepsis.8
Similarly, we interviewed 14 Surgical ICU clinicians involved in this study. They expressed hesitancy in responding to a rising risk with direct clinical action because they felt the monitor reported a future state rather than routine ‘in the moment’ physiologic parameters.37 Rather, they felt they first must accept that the prediction is sufficiently reliable to support proactive intervention.37 We found other elements of clinician engagement with predictive analytics monitoring included accepting the reliability of the risk score, understanding the science underlying the algorithm, developing clinical pathways that correspond to varying levels of risk, and integrating the risk score into the electronic medical record as a vital sign.37
In conclusion, the display of a predictive analytics monitor in a Surgical ICU was followed by a reduction in the rate of septic shock that was statistically significant even when controlling for age and APACHE score. We propose that there is clinical value of predictive analytics monitoring, especially when continuous data from bedside monitoring are used.
Figure 4.

Comparison of event rates between the periods prior to risk monitor display (red) and after risk monitor display (blue), categorized by event of interest and unit; error bars represent confidence intervals for each rate, based on a Poisson distribution.
ACKNOWLEDGMENTS
We thank I. Nickel and S. Rikhi for assistance with data collection.
We thank our colleagues in UVa hospital IT (HSTS) for systems administration, network, infrastructure, computing hardware, and database administration.
Footnotes
COMPETING INTERESTS
MTC and JRM are Chief Science and Chief Medical Officers of and hold equity in Advanced Medical Predictive Devices, Diagnostics, and Displays (AMP3D), Charlottesville, VA. MTC is employed by AMP3D.
References
- 1.Moss TJ, Lake DE, Calland JF, et al. Signatures of subacute potentially catastrophic illness in the ICU: Model development and validation. Crit Care Med. 2016;44(9):1639–1648. doi: 10.1097/CCM.0000000000001738 [doi]. [DOI] [PMC free article] [PubMed] [Google Scholar]
- 2.Ramachandran SK, Nafiu OO, Ghaferi A, Tremper KK, Shanks A, Kheterpal S. Independent predictors and outcomes of unanticipated early postoperative tracheal intubation after nonemergent, noncardiac surgery. Anesthesiology. 2011;115(1):44–53. doi: 10.1097/ALN.0b013e31821cf6de [doi]. [DOI] [PubMed] [Google Scholar]
- 3.Gaieski DF, Mikkelsen ME, Band RA, et al. Impact of time to antibiotics on survival in patients with severe sepsis or septic shock in whom early goal-directed therapy was initiated in the emergency department. Crit Care Med. 2010;38(4):1045–1053. doi: 10.1097/CCM.0b013e3181cc4824 [doi]. [DOI] [PubMed] [Google Scholar]
- 4.Zimlichman E, Szyper-Kravitz M, Shinar Z, et al. Early recognition of acutely deteriorating patients in non-intensive care units: Assessment of an innovative monitoring technology. Journal of hospital medicine. 2012;7(8):628–633. [DOI] [PubMed] [Google Scholar]
- 5.Landrigan CP, Parry GJ, Bones CB, Hackbarth AD, Goldmann DA, Sharek PJ. Temporal trends in rates of patient harm resulting from medical care. N Engl J Med. 2010;363(22):2124–2134. [DOI] [PubMed] [Google Scholar]
- 6.Blackburn HN, Clark MT, Moss TJ, et al. External validation in an intermediate unit of a respiratory decompensation model trained in an intensive care unit. Surgery. 2017;161(3):760–770. doi: S0039-6060(16)30599-2 [pii]. [DOI] [PubMed] [Google Scholar]
- 7.Blackburn HN, Clark MT, Moorman JR, Lake DE, Calland JF. Identifying the low risk patient in surgical intensive and intermediate care units using continuous monitoring. Surgery. 2018;163(4):811–818. doi: S0039-6060(17)30656-6 [pii]. [DOI] [PubMed] [Google Scholar]
- 8.Fairchild KD, Schelonka RL, Kaufman DA, et al. Septicemia mortality reduction in neonates in a heart rate characteristics monitoring trial. Pediatr Res. 2013;74(5):570–575. doi: 10.1038/pr.2013.136 [doi]. [DOI] [PMC free article] [PubMed] [Google Scholar]
- 9.Politano AD, Riccio LM, Lake DE, et al. Predicting the need for urgent intubation in a surgical/trauma intensive care unit. Surgery. 2013;154(5):1110–1116. doi: 10.1016/j.surg.2013.05.025 [doi]. [DOI] [PMC free article] [PubMed] [Google Scholar]
- 10.Schmidt JM, Sow D, Crimmins M, et al. Heart rate variability for preclinical detection of secondary complications after subarachnoid hemorrhage. Neurocrit Care. 2014;20(3):382–389. doi: 10.1007/s12028-014-9966-y [doi]. [DOI] [PMC free article] [PubMed] [Google Scholar]
- 11.Zimlichman E, Szyper-Kravitz M, Shinar Z, et al. Early recognition of acutely deteriorating patients in non-intensive care units: Assessment of an innovative monitoring technology. J Hosp Med. 2012;7(8):628–633. doi: 10.1002/jhm.1963 [doi]. [DOI] [PubMed] [Google Scholar]
- 12.Rusin CG, Acosta SI, Shekerdemian LS, et al. Prediction of imminent, severe deterioration of children with parallel circulations using real-time processing of physiologic data. J Thorac Cardiovasc Surg. 2016;152(1):171–177. doi: 10.1016/j.jtcvs.2016.03.083 [doi]. [DOI] [PMC free article] [PubMed] [Google Scholar]
- 13.Clark MT, Vergales BD, Paget-Brown AO, et al. Predictive monitoring for respiratory decompensation leading to urgent unplanned intubation in the neonatal intensive care unit. Pediatr Res. 2013;73(1):104–110. doi: 10.1038/pr.2012.155 [doi]. [DOI] [PMC free article] [PubMed] [Google Scholar]
- 14.Danner OK, Hendren S, Santiago E, Nye B, Abraham P. Physiologically-based, predictive analytics using the heart-rate-to-systolic-ratio significantly improves the timeliness and accuracy of sepsis prediction compared to SIRS. Am J Surg. 2017;213(4):617–621. doi: S0002-9610(17)30025-9 [pii]. [DOI] [PubMed] [Google Scholar]
- 15.Taylor RA, Pare JR, Venkatesh AK, et al. Prediction of in-hospital mortality in emergency department patients with sepsis: A local big data-driven, machine learning approach. Acad Emerg Med. 2016;23(3):269–278. doi: 10.1111/acem.12876 [doi]. [DOI] [PMC free article] [PubMed] [Google Scholar]
- 16.Moorman JR, Carlo WA, Kattwinkel J, et al. Mortality reduction by heart rate characteristic monitoring in very low birth weight neonates: A randomized trial. J Pediatr. 2011;159(6):900–6.e1. doi: 10.1016/j.jpeds.2011.06.044 [doi]. [DOI] [PMC free article] [PubMed] [Google Scholar]
- 17.Berger T, Birnbaum A, Bijur P, Kuperman G, Gennis P. A computerized alert screening for severe sepsis in emergency department patients increases lactate testing but does not improve inpatient mortality. Appl Clin Inform. 2010;1(4):394–407. doi: 10.4338/ACI-2010-09-RA-0054 [doi]. [DOI] [PMC free article] [PubMed] [Google Scholar]
- 18.Hooper MH, Weavind L, Wheeler AP, et al. Randomized trial of automated, electronic monitoring to facilitate early detection of sepsis in the intensive care unit*. Crit Care Med. 2012;40(7):2096–2101. doi: 10.1097/CCM.0b013e318250a887 [doi]. [DOI] [PMC free article] [PubMed] [Google Scholar]
- 19.Hravnak M, Devita MA, Clontz A, Edwards L, Valenta C, Pinsky MR. Cardiorespiratory instability before and after implementing an integrated monitoring system. Crit Care Med. 2011;39(1):65–72. doi: 10.1097/CCM.0b013e3181fb7b1c [doi]. [DOI] [PMC free article] [PubMed] [Google Scholar]
- 20.Sawyer AM, Deal EN, Labelle AJ, et al. Implementation of a real-time computerized sepsis alert in nonintensive care unit patients. Crit Care Med. 2011;39(3):469–473. doi: 10.1097/CCM.0b013e318205df85 [doi]. [DOI] [PubMed] [Google Scholar]
- 21.Semler MW, Weavind L, Hooper MH, et al. An electronic tool for the evaluation and treatment of sepsis in the ICU: A randomized controlled trial. Crit Care Med. 2015;43(8):1595–1602. doi: 10.1097/CCM.0000000000001020 [doi]. [DOI] [PMC free article] [PubMed] [Google Scholar]
- 22.Shimabukuro DW, Barton CW, Feldman MD, Mataraso SJ, Das R. Effect of a machine learning-based severe sepsis prediction algorithm on patient survival and hospital length of stay: A randomised clinical trial. BMJ Open Respir Res. 2017;4(1):e000234-2017-000234. eCollection 2017. doi: 10.1136/bmjresp-2017-000234 [doi]. [DOI] [PMC free article] [PubMed] [Google Scholar]
- 23.Watkinson PJ, Barber VS, Price JD, Hann A, Tarassenko L, Young JD. A randomised controlled trial of the effect of continuous electronic physiological monitoring on the adverse event rate in high risk medical and surgical patients. Anaesthesia. 2006;61(11):1031–1039. doi: ANA4818 [pii]. [DOI] [PubMed] [Google Scholar]
- 24.Griffin MP, O'Shea TM, Bissonette EA, Harrell FE Jr, Lake DE, Moorman JR. Abnormal heart rate characteristics preceding neonatal sepsis and sepsis-like illness. Pediatr Res. 2003;53(6):920–926. doi: 10.1203/01.PDR.0000064904.05313.D2 [doi]. [DOI] [PubMed] [Google Scholar]
- 25.Clark MT, Vergales BD, Paget-Brown AO, et al. Predictive monitoring for respiratory decompensation leading to urgent unplanned intubation in the neonatal intensive care unit. Pediatr Res. 2013;73(1):104–110. doi: 10.1038/pr.2012.155 [doi]. [DOI] [PMC free article] [PubMed] [Google Scholar]
- 26.Moss TJ, Clark MT, Lake DE, Moorman JR, Calland JF. Heart rate dynamics preceding hemorrhage in the intensive care unit. J Electrocardiol. 2015;48(6):1075–1080. doi: 10.1016/j.jelectrocard.2015.08.007 [doi]. [DOI] [PubMed] [Google Scholar]
- 27.Goldberger AL, Amaral LA, Glass L, et al. PhysioBank, PhysioToolkit, and PhysioNet: Components of a new research resource for complex physiologic signals. Circulation. 2000;101(23):E215–20. [DOI] [PubMed] [Google Scholar]
- 28.Peng CK, Buldyrev SV, Havlin S, Simons M, Stanley HE, Goldberger AL. Mosaic organization of DNA nucleotides. Phys Rev E Stat Phys Plasmas Fluids Relat Interdiscip Topics. 1994;49(2):1685–1689. [DOI] [PubMed] [Google Scholar]
- 29.Naraghi L, Mejaddam AY, Birkhan OA, et al. Sample entropy predicts lifesaving interventions in trauma patients with normal vital signs. J Crit Care. 2015;30(4):705–710. doi: 10.1016/j.jcrc.2015.03.018 [doi]. [DOI] [PubMed] [Google Scholar]
- 30.Henry KE, Hager DN, Pronovost PJ, Saria S. A targeted real-time early warning score (TREWScore) for septic shock. Sci Transl Med. 2015;7(299):299ra122. doi: 10.1126/scitranslmed.aab3719 [doi]. [DOI] [PubMed] [Google Scholar]
- 31.Mao Q, Jay M, Hoffman JL, et al. Multicentre validation of a sepsis prediction algorithm using only vital sign data in the emergency department, general ward and ICU. BMJ Open. 2018;8(1):e017833-2017-017833. doi: 10.1136/bmjopen-2017-017833 [doi]. [DOI] [PMC free article] [PubMed] [Google Scholar]
- 32.Shashikumar SP, Stanley MD, Sadiq I, et al. Early sepsis detection in critical care patients using multiscale blood pressure and heart rate dynamics. J Electrocardiol. 2017;50(6):739–743. doi: S0022-0736(17)30254-6 [pii]. [DOI] [PMC free article] [PubMed] [Google Scholar]
- 33.Tsoukalas A, Albertson T, Tagkopoulos I. From data to optimal decision making: A data-driven, probabilistic machine learning approach to decision support for patients with sepsis. JMIR Med Inform. 2015;3(1):e11. doi: 10.2196/medinform.3445 [doi]. [DOI] [PMC free article] [PubMed] [Google Scholar]
- 34.Desautels T, Calvert J, Hoffman J, et al. Prediction of sepsis in the intensive care unit with minimal electronic health record data: A machine learning approach. JMIR Med Inform. 2016;4(3):e28. doi: v4i3e28 [pii]. [DOI] [PMC free article] [PubMed] [Google Scholar]
- 35.Rhee C, Dantes R, Epstein L, et al. Incidence and trends in US hospitals using clinical vs. claims data, 2009-2014. JAMA. 2017; 318(13): 1241–1249. [DOI] [PMC free article] [PubMed] [Google Scholar]
- 36.Ludikhuize J, Smorenburg SM, de Rooij SE, de Jonge E. Identification of deteriorating patients on general wards; measurement of vital parameters and potential effectiveness of the modified early warning score. J Crit Care. 2012;27(4):424.e7–424.13. doi: 10.1016/j.jcrc.2012.01.003 [doi]. [DOI] [PubMed] [Google Scholar]
- 37.Keim-Malpass J, Kitzmiller R, Skeeles-Worley A, et al. Advancing continuous predictive analytics monitoring: Moving from implementation to clinical action in a learning health system. Crit Care Clin North Am. 2018;30(2). [DOI] [PubMed] [Google Scholar]
- 38.Kitzmiller R, Vaughan A, Skeeles-Worley A, et al. User perceptions of big data innovations: Clues to implementation strategies. Abstract submitted for poster presented at Toward a Carolina Improvement Science Initiative: A Lightning Symposium, Chapel Hill, NC. 2017. [Google Scholar]