Abstract
Purpose:
The assessment of cellular energy metabolism is crucial for understanding myocardial physiopathology. Here, we conducted a pilot study to develop an alternative imaging approach for the assessment of myocardial energy metabolism.
Methods:
We developed a deuterium MRSI method to noninvasively monitor the accumulation of deuterated downstream metabolites and deuterated water in rat hearts infused with deuterated glucose or acetate substrate on a 16.4 Tesla animal scanner.
Results:
We found that the deuterated water accumulation rate and isotopic turnover rate of deuterated glutamate/glutamine via the tricarboxylic acid cycle and exchange in rat hearts were much higher when infused with acetate compared to that with glucose, demonstrating the myocardium substrate preference for acetate over glucose.
Conclusion:
We demonstrated the feasibility of deuterium MRSI for noninvasive imaging and assessment of myocardial energy metabolism in vivo. Although the strong signal and large dynamics of myocardial deuterated water may provide a sensitive imaging biomarker, quantifying the metabolic rates still poses a challenge due to the confounding effects of blood recirculation, perfusion, and multiple deuterated water production pathways. In contrast, the deuterated glutamate/glutamine signal and change should directly reflect the metabolic activity of the myocardial tricarboxylic acid cycle, which can be used to study the metabolic shift in substance preference between acetate and glucose in the diseased state. Deuterium MRSI is noninvasive and robust and may have the potential to assess myocardial energy metabolism in human patients.
Keywords: acetate, glucose, In vivo deuterium MRS imaging, myocardial energy metabolism, myocardial TCA cycle activity
1 ∣. INTRODUCTION
Cardiovascular disease is the leading cause of death worldwide. For instance, 6.2 million people in the United States are affected by heart failure.1 One of the most common hypotheses is that cardiovascular diseases stem from a shortage of myocardial energy delivery; nonetheless, this concept has not been widely accepted because of the limited imaging techniques that can rigorously assess cardiac energy metabolism under normal and diseased conditions in vivo.2 Imaging methods for the early diagnosis of abnormal myocardial metabolism are essential for people with cardiovascular disease or high cardiovascular risk.3 As a result, the interest in developing novel cardiometabolic imaging techniques is growing tremendously.
Currently, cardiovascular MR imaging is a clinically well-established and noninvasive tool used to evaluate known or suspected heart diseases. However, cardiovascular MR imaging alone cannot provide information related to myocardial metabolism. Other imaging methods, such as PET, are required to assess and understand changes in myocardial metabolism.4 Advances in MRSI, such as hydrogen-1 (1H) and phosphorus-31 (31P) MRSI, also provide new tools for this purpose. Compared with PET that uses ionizing radiation, 1H or 31P MRSI can be used to assess cardiac function and tissue viability5 and to noninvasively measure myocardial concentrations of many metabolites without using any radioactive tracer. However, despite the advantages of 1H and 31P MRSI methods, their applications in studying myocardial energy metabolism remain limited because they are not suitable for monitoring glucose or acetate metabolism in the heart. On the other hand, although conventional 13C MRS can be used to assess metabolic activities in vivo due to its relatively low SNR, it is difficult to perform because it requires a long scan time for signal averaging. Therefore, 13C MRS has not been accepted as a clinical imaging tool.6,7
The recently developed hyperpolarized 13C MRS can greatly amplify 13C MRS signals, and it has been applied to evaluate physiopathological changes, including the cellular metabolic pathways in a living heart.8,9 Several studies have demonstrated the feasibility of hyperpolarized 13C MRS/MRSI for assessing myocardial metabolism through infused hyperpolarized 13C pyruvate and its downstream metabolites (eg, bicarbonate, lactate, and alanine). Abnormal myocardial metabolism is generally considered an indicator of various heart diseases.8-11 Nevertheless, the time window to obtain the enhanced 13C MRS signals of hyperpolarized 13C substrates and 13C-labeled metabolites or intermediates is determined by their T1s, usually within a few min, or 5 times the T1 value. Due to the difficulty of gaining SNR through signal averaging, the spatial resolution of hyperpolarized 13C imaging is still relatively low. In addition, once downstream metabolites enter the tricarboxylic acid (TCA)cycle, the 13C signal of hyperpolarized intermediates such as glutamate/glutamine becomes weak and difficult to detect in vivo.12 Therefore, it is necessary to develop an alternative metabolic imaging technique that not only measures myocardial energy metabolism through the glycolytic pathway but also the TCA cycle activity, which dominates the mitochondrial adenosine triphosphate production in supporting cardiac function.
In the late 1980s, Ackerman et al. pioneered the use of deuterium (2H) MRI and D2O as a freely diffusible tracer for measuring blood perfusion in normal tissues and tumors.13,14 More recently, deuterium MRS (DMRS) or imaging (DMRSI) in combination with an infusion of deuterium-labeled glucose has been introduced to simultaneously determine the rates of glucose metabolism and the TCA cycle in the rat brain at an ultrahigh field of 16.4 Tesla.15 Unlike 13C MRS, 2H nuclides have a larger spin quantum number (I = 1 vs. I = 1/2 for 13C), with a much shorter T1 due to quadrupolar relaxation (eg, 50 ms for the deuterated glucose in the brain), resulting in a higher SNR per unit sampling time of DMRS/DMRSI for studying cellular energy metabolism in vivo.15-17 Furthermore, in vivo DMRSI does not have baseline signal contamination due to the low natural abundance of 2H (approximately 0.0156%), which simplifies image detection and quantification.15 Although DMRSI has shown advantages in studying brain energy metabolism, its ability to assess myocardial metabolism has not yet been investigated and reported.
Unlike the brain, which primarily relies on glucose as an energy fuel, the cardiac muscle uses both fatty acids and glucose as the main substrates for energy metabolism but prefers fatty acids under healthy conditions.18 Approximately 95% of short chain fatty acids are present as acetate (2 carbons), propionate (3 carbons), and butyrate (4 carbons), in which acetate is the most abundant form (approximately 60%).19,20 When combining DMRS detection with deuterated glucose and/or acetate infusion, DMRSI can be used to detect changes of the deuterated substrate and its metabolic products or intermediates, such as deuterated mixed glutamate/glutamine (Glx), lactate, and water (HDO), with known chemical shifts and well-resolved resonance signals.15,16,21,22 Therefore, the DMRSI approach may have the potential for imaging and assessing major pathways of myocardial energy metabolism in vivo under varied physiopathology conditions using different deuterated substrates.
To assess myocardial energy metabolism and substrate preference at 16.4 Tesla using a closed-chest rat model, we utilized the 3D chemical shift imaging (CSI) approach and evaluated the feasibility and sensitivity of DMRSI for heart application. By infusing deuterated glucose or acetate substrate, dynamic changes in deuterated metabolites in cardiac tissues were detected. We first tested the sensitivity of imaging deuterated metabolites in rat hearts and then evaluated the metabolic preference of energy substrates between glucose and acetate.
2 ∣. METHODS
Twelve female Sprague Dawley rats (body weight: 292 ± 23 g) were used in this study. The rats were initially kept in an induction box under 5% isoflurane for several min, after which the animals were mechanically ventilated under 2% isoflurane anesthesia. The femoral artery and vein were cannulated for physiological monitoring, blood sampling, and chemical administration. The animals’ rectal temperature was maintained at 37 ± 1°C using heated circulating water; the arterial blood pressure and heart rate were monitored and maintained under normal physiological conditions throughout the experiment. The University of Minnesota Institutional Animal Care and Use Committee approved the animal protocols used in this study.
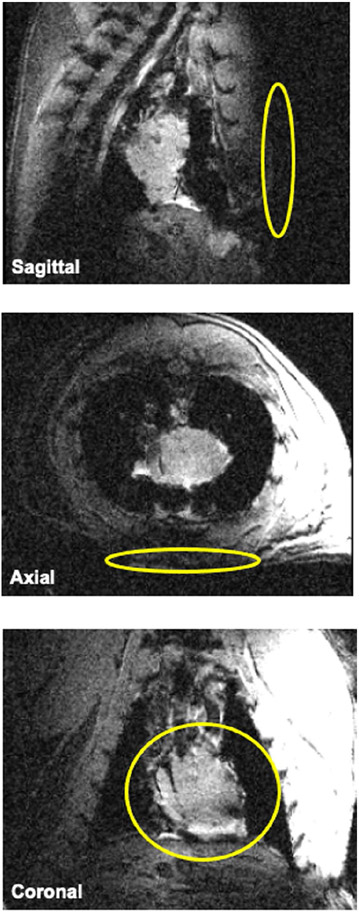
All experiments were conducted on a 16.4 Tesla/26-cm bore scanner (Varian/VNMRJ, Palo Alto, CA) using a 2H/2H dual-frequency single-loop radiofrequency (RF) surface coil (1.7 cm diameter) placed underneath the intact chest muscle with the animal in a prone position (see Figure 1). The RF coil was based on a newly reported design offering an optimal performance for low-frequency 2H detection but sacrificing some degree of performance for high-frequency 1H detection.23 The RF coil was manually tuned and matched to either 1H Larmor frequency (698 MHz) for anatomic MRI and B0 shimming or 2H Larmor frequency (107 MHz) for DMRSI. A 3D CSI method based on the Fourier series window k-space weighting24,25 was used to obtain dynamic 3D DMRSI with the following acquisition parameters: 9 × 9 × 5 3D phase-encoding matrix, 6 cm × 6 cm × 5 cm field of view, 45 ms TR, 175 complex points of FIDs, 4112 Hz spectral width, 69 s acquisition time per 3D DMRSI volume, and approximately 80 min imaging acquisition time. A hard RF pulse (200 μs pulse width) was applied to excite the 2H HDO signals from both the chest muscle and heart, and its power was calibrated using a single-pulse acquisition sequence and 100 signal averages with varied RF pulse power to optimize the 2H signal of the natural abundance HDO from the rat heart.
FIGURE 1.
Anatomical images of a representative rat heart in a closed-chest model. A 1H/2H dual-frequency RF surface coil (yellow rings shown in each panel) was placed underneath the intact chest muscle with the animal in a prone position. 1H/2H, hydrogen-1/hydrogen-2; RF, radiofrequency
The Fourier series window weighting is based on the Fourier coefficients of a predetermined voxel shape following the optimal termination of the series. A voxel FID in space can be generated by the summation with respect to the phase-encoding domain, and the voxel position can be shifted arbitrarily in the desired phase-encoding directions to generate a 3D CSI. The FID was zero-filled before performing Fourier transformation. The Fourier series window-based CSI approach is characterized by better sensitivity and smaller out-of-voxel contamination compared to the conventional FT approach.24,25 The nominal voxel size of the 3D 2H CSI was 0.44 mL. Considering a rat heart weight of approximately 1.1 g for Sprague Dawley rats26 and a myocardial tissue density of 1.1 g/mL, the myocardial tissue volume was estimated to be approximately 1.0 mL and thus covered by 2-3 CSI voxels. To demonstrate in vivo 2H CSI results and metabolite maps, the CSI data were zero-filled to a 17 × 17 2D in-plane matrix for display purposes.
For the substrate preparation, we consistently used [6,6-d2]-D-glucose (99% enrichment, Cambridge Isotope Laboratories, Inc., Tewksbury, MA) with 1.0 g/kg body weight. However, we varied the [2,2,2-d3]-acetate (99% enrichment, Sigma-Aldrich, St. Louis, MO) infusions with 3 different substrate concentrations, 1.0 g/kg body weight, 0.5 g/rat, or 1.0 g/rat—dissolved in 2.5 mL saline solution to examine whether the Glx or HDO production rate would differ while utilizing different acetate infusion protocols. To introduce these deuterium-labeled substrates for DMRSI studies, the first 5 min of baseline DMRSI acquisition was followed by an 8 min bolus IV infusion of [6,6-d2]-D-glucose (n = 5) or an 18-75 min infusion of [2,2,2-d3]-acetate (n = 7).
All 2H resonance signals of HDO and deuterated metabolites (chemical shifts: deuterated HDO at 4.8 ppm, glucose at 3.8 ppm, Glx at 2.4 ppm, and acetate at 1.9 ppm) from each DMRSI voxels measured at different time points were first preprocessed in the time domain with line broadening (20 Hz) and phase correction before having them fitted and quantified in the frequency domain (assuming Lorentzian lineshape) using a MatLab-based program (MATLAB 9.4, MathWorks, Natick, MA) and the nonlinear curve fitting toolbox.15
To correct the T1 saturation effect of deuterated compounds for quantification of concentration, we adapted the following 2H T1 values (50-400 ms) taken from brain studies: tissue HDO, 0.36 s; glucose, 0.05 s; Glx, 0.20 s.15 Furthermore, to correct the saturation effect of the deuterated acetate, an inversion recovery pulse sequence was used to measure the deuterated acetate T1 values in the heart in vivo and in an acetate phantom at 20°C using the following acquisition parameters: 4 ms hyperbolic secant inversion pulse, and 100 μs excitation (hard) pulse with a nominal 90° flip angle; 15 s TR; 10 inversion recovery times (0.012, 0.02, 0.1, 0.5, 0.8, 2, 4, 6, 8, and 12 s); 3004 Hz spectral width; 2000 complex points of FIDs; and 4 signal averages. For quantification, the natural abundance HDO signal of cardiac muscle acquired before infusion served as an internal standard (assumed to be 13.7 mM) to calculate the concentration and dynamic change of deuterated compounds in vivo.
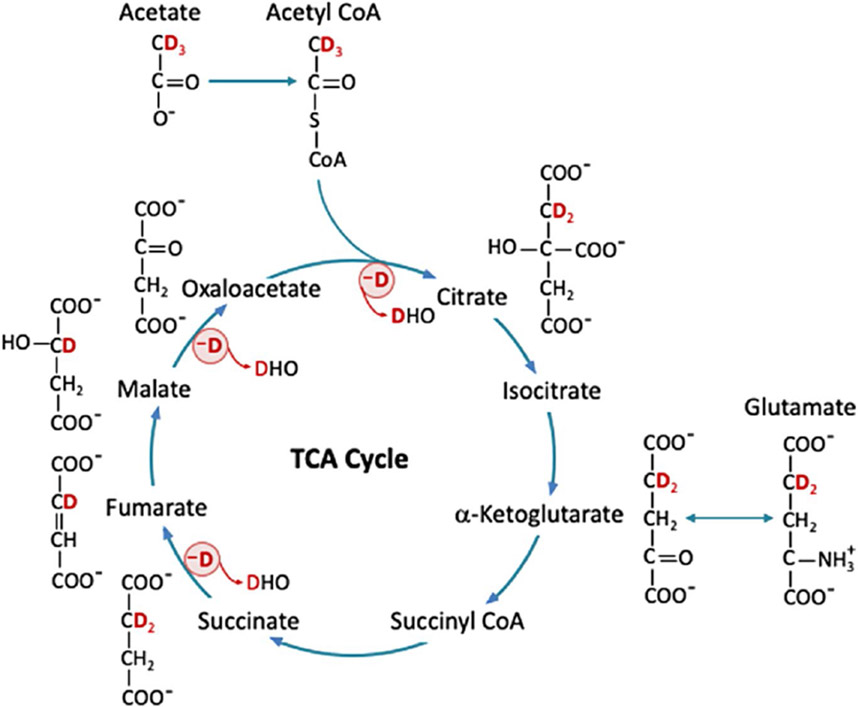
According to the acetate (Figure 2) and glucose metabolic pathway described in a previous work,15 the number of deuterons per molecule, that is, 3 deuterons per acetate (on C2), 2 deuterons per glucose (on C6), and 2 or 1.33 deuterons per Glx (on C4) for acetate or glucose substrate, was determined according to the theoretical probability of 2H atoms in each molecule16 and used to quantify metabolite concentrations. Finally, by correcting the T1 saturation factor, the absolute concentration of each metabolite or HDO was determined.
FIGURE 2.
Acetate labeled with three 2H atoms ([2,2,2-d3]-acetate) is converted to acetyl-CoA, which then enters the TCA cycle and is converted to citrate and α-ketoglutarate, with possible loss of one 2H atom. Meanwhile, α-ketoglutarate can exchange with glutamate to produce [4,4-d2]-glutamate. Then, succinyl-CoA is generated and followed by the conversion from succinate to fumarate with possible loss of another 2H atom. Finally, fumarate is converted to malate, which then turns into oxaloacetate with possible loss of the last 2H atom. The deuterium lost via the TCA cycle could end up in HDO. Deuterium-labeled acetate or other substrates, glutamate, and HDO can be measured by DMRSI; other intermediates are below detectable concentration. DMRSI, deuterium (2H) MRS imaging; HDO, deuterated water; TCA, tricarboxylic acid
Compared to previously described glucose metabolic pathways,15 deuterated pyruvate and lactate are not expected to form through infusing [2,2,2-d3]-acetate; instead, [2,2,2-d3]-acetyl-CoA is produced in the cytoplasm through the direct esterification of acetate before entering the mitochondria. In the initial steps of the TCA cycle, [2,2,2-d3]-acetyl-CoA becomes [4,4-d2]-citrate and [4,4-d2] α-ketoglutarate and then labels [4,4-d2]-glutamate via chemical exchange, which can be detected by in vivo DMRSI. Succinyl-CoA can be generated through the dehydrogenase of α-ketoglutarate, which then produces succinate through succinyl-CoA synthetase. Isotope-labeled malate, fumarate, and oxaloacetate could also be generated through subsequent reactions in the TCA cycle. Once [2,2,2-d3]-acetyl-CoA enters the TCA cycle, all labeled 2H atoms are lost through multiple reactions in the first turn of the TCA cycle (marked by a red circle with a symbol of -D in Figure 2), resulting in HDO,15,16 which can be detected by in vivo DMRSI.
3 ∣. RESULTS
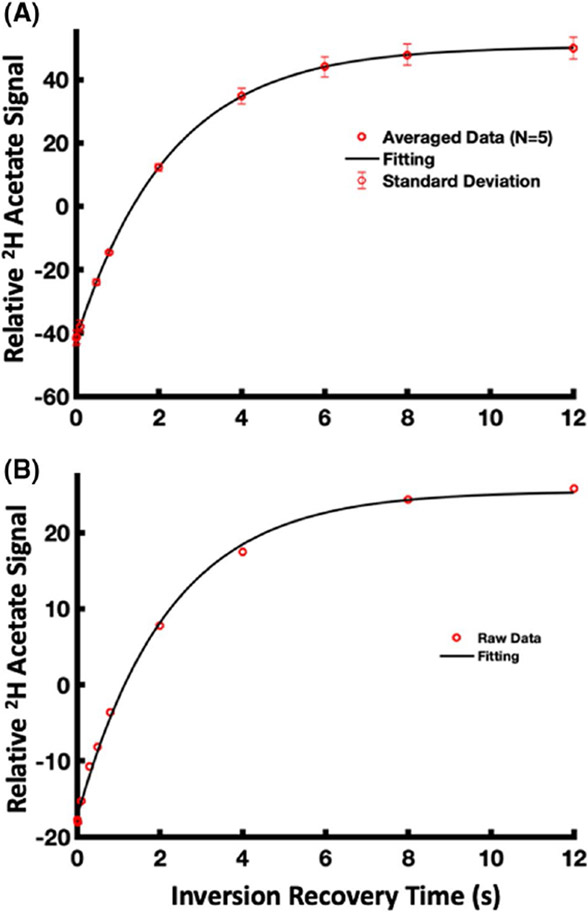
Figure 3 shows the fitting results of [2,2,2-d3]-acetate T1 measurements for water solution phantom at the room temperature (T1 = 2.26 ± 0.02 s, mean ± STD; n = 5) (Figure 3A) and in vivo heart (T1 = 2.21 s; n = 1) (Figure 3B). The measured T1 value of acetate at 16.4 Tesla, either in vivo or in phantom, was much longer than that of Glx, glucose, and HDO.15
FIGURE 3.
[2,2,2-d3]-acetate T1 measurements and fitting results for (A) water solution phantom at the room temperature (T1 = 2.26 ± 0.02 s, mean ± STD; n = 5) and (B) in vivo rat heart (T1 = 2.21 s; n = 1)
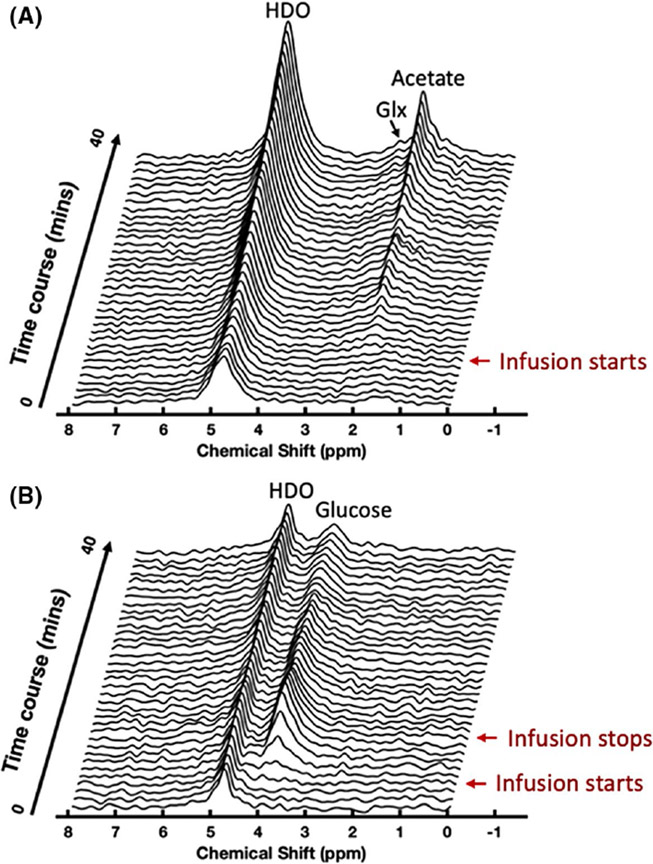
Figure 4 shows the stacked DMRS plots of a representative 3D DMRSI voxel located in the heart region obtained from the acetate (Figure 4A) and glucose (Figure 4B) infusion experiments, demonstrating the dynamic changes of deuterated metabolites and HDO in the initial 40 min of the DMRSI measurements before (baseline, 5 min), during, and/or after substrate infusion. In particular, Figure 4A shows the results of a continuous infusion of deuterated acetate. There was a large increase of HDO and acetate resonance signals at 4.8 ppm and 1.9 ppm, respectively, once the acetate entered the animal body. We also observed relatively slower labeling of the deuterated Glx resonance signals at approximately 2.4 ppm. Figure 4B illustrates the results from an 8 min deuterated glucose infusion experiment; the signals of myocardial HDO and Glx were much smaller than those of acetate infusion (Figure 4A).
FIGURE 4.
Stacked plots of dynamic DMRSI spectra of a representative voxel in the heart show early changes in 2H-labeled metabolites and HDO in 2 different infusion protocols. (A) Demonstration of experimental results with continuous infusion of [2,2,2-d3]-acetate. During the infusion, HDO and acetate signals continuously increase. The Glx resonance peak also gradually appears in the stacked plot. (B) Demonstration of experimental results with 8 min bolus infusion of [6,6-d2]-D-glucose. After the infusion of [6,6-d2]-D-glucose, the HDO signals did not increase significantly, and the Glx signal was not obvious. Glx, glutamate/glutamine
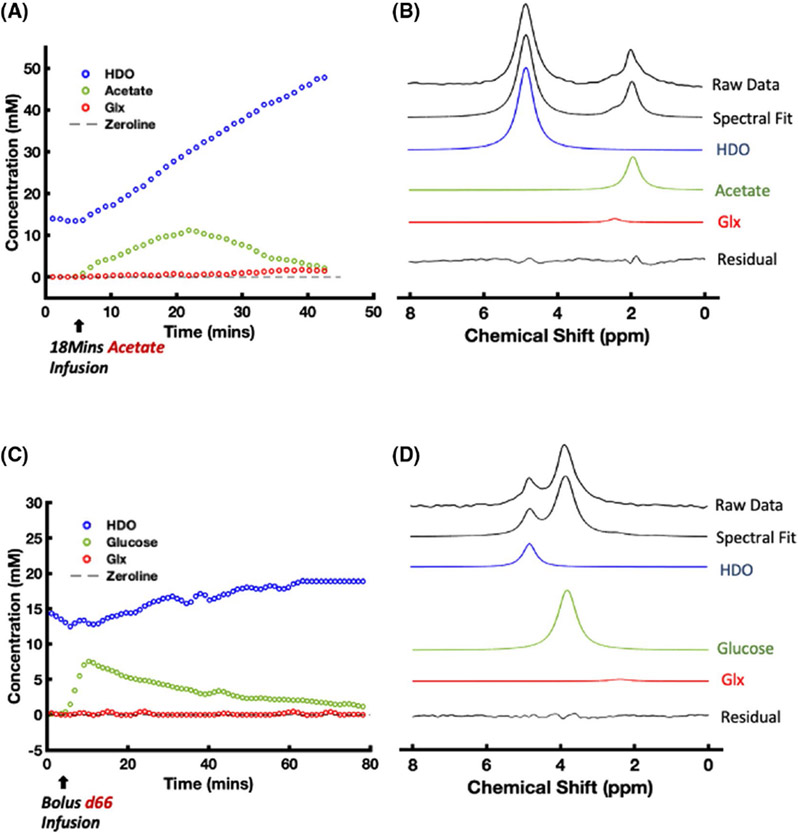
Figure 5 illustrates the dynamic changes and spectrum fitting of labeled metabolites and HDO after intravenous infusion of acetate (Figure 5A,B) and glucose (Figure 5C,D) from a representative rat heart voxel. Figure 5A shows the time course of 2H labeled water, acetate, and Glx concentrations measured from the rat heart in an 18 min acetate infusion experiment. The concentrations of HDO and acetate began to increase immediately after the acetate substrate entered the animal body. The acetate concentration peaked at approximately 23 min, that is, at the end of the acetate infusion period, which was then followed by an onset of acetate decline, whereas the myocardial HDO concentration continuously increased in an approximately linear fashion for at least 30 to 40 min, and the labeling appearance in Glx was also observed. Figure 5B demonstrates the spectral fitting of the data acquired 32 min after the start of acetate infusion. Figure 5C displays the time courses of the labeled metabolites and HDO in an 8 min glucose infusion experiment. Similar to what was observed in Figure 4B, deuterated Glx and lactate signals were not obvious. This observation is consistent with the spectral fitting result shown in Figure 5D, indicating that the Glx signal at the 20-min time point was negligible.
FIGURE 5.
Representative DMRSI voxel time courses ((A) acetate, and (C) glucose) and spectral fitting obtained in [2,2,2-d3]-acetate ((B) 18 min infusion) and [6,6-d2]-D-glucose (D, 8 min infusion) experiments. The HDO signal in (A) continuously increases during and after the [2,2,2-d3]-acetate infusion, whereas the acetate signal peaks at approximately 23 min. In contrast, the HDO signal in (C) increases slowly, whereas the glucose signal peaks at approximately 12 min. The Glx signal is observed in (A) and (B), whereas that in (C) and (D) is negligible. 2H resonance chemical shift assignments: water, 4.8 ppm (set as a chemical shift reference); acetate, 1.8 ppm; and Glx, 2.4 ppm
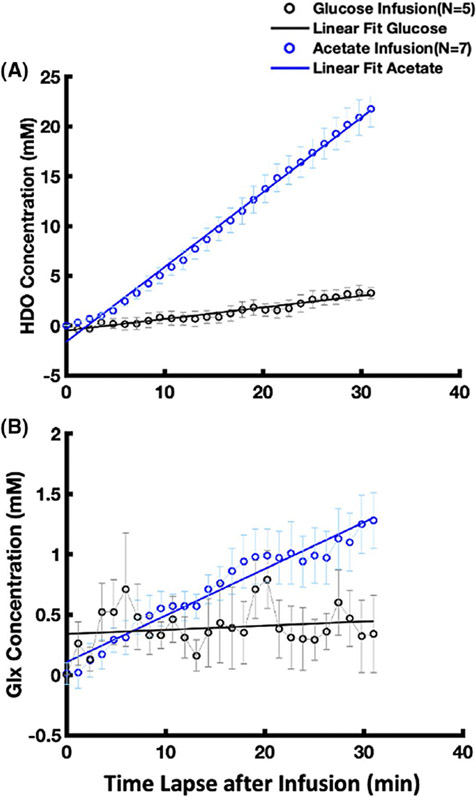
Figure 6A summarizes and compares the intersubject averaged time courses and linear regressions of deuterated HDO signal accumulation with glucose (n = 5) or acetate (n = 7) infusion from the onset of infusion to approximately 30 min after the start of the infusion. It shows distinct dynamic characteristics and an approximately 6 times higher accumulation rate of the myocardial deuterated HDO with acetate infusion (0.75 mM/min determined by the linear regression slope, n = 7) than that with glucose infusion (0.12 mM/min, n = 5). Moreover, as shown in Figure 6B, in most of the acetate infusion experiments (n = 5) we detected a reliable signal of labeled Glx that increased during and/or after acetate infusion with a linear regression slope of 0.04 mM/min. In contrast, the labeled Glx signal after glucose infusion was barely detectable (Figure 6B) under the physiological conditions studied herein.
FIGURE 6.
(A) Comparison of the grouped HDO signal increasing rates in rat hearts with [2,2,2-d3]-acetate infusion (linear regression slope = 0.75 mM/min, R2 = 0.995, n = 7) and [6,6-d2]-D-glucose infusion (slope = 0.12 mM/min, R2 = 0.944 n = 5). After considering the number of deuterons in substrate molecules, the HDO signal increasing rate with [2,2,2-d3]-acetate infusion is approximately 4 times of that with [6,6-d2]-D-glucose infusion. Glx is observed in most of the [2,2,2-d3]-acetate infusion studies (slope = 0.04 mM/min, R2 = 0.950, n = 5) but negligible in the [6,6-d2]-D-glucose infusion studies (slope = 0.004 mM/min, R2 = 0.034, n = 5) as displayed in (B)
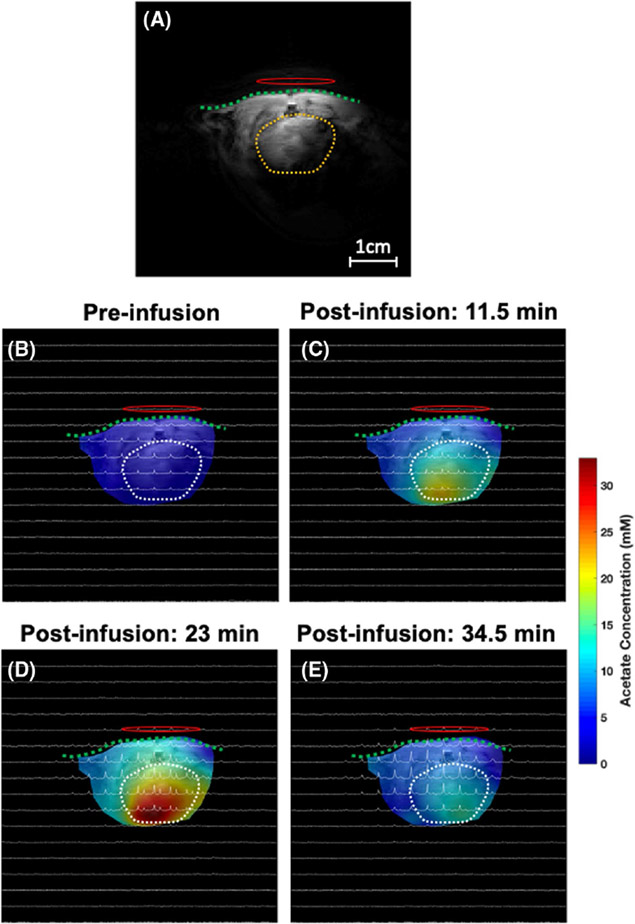
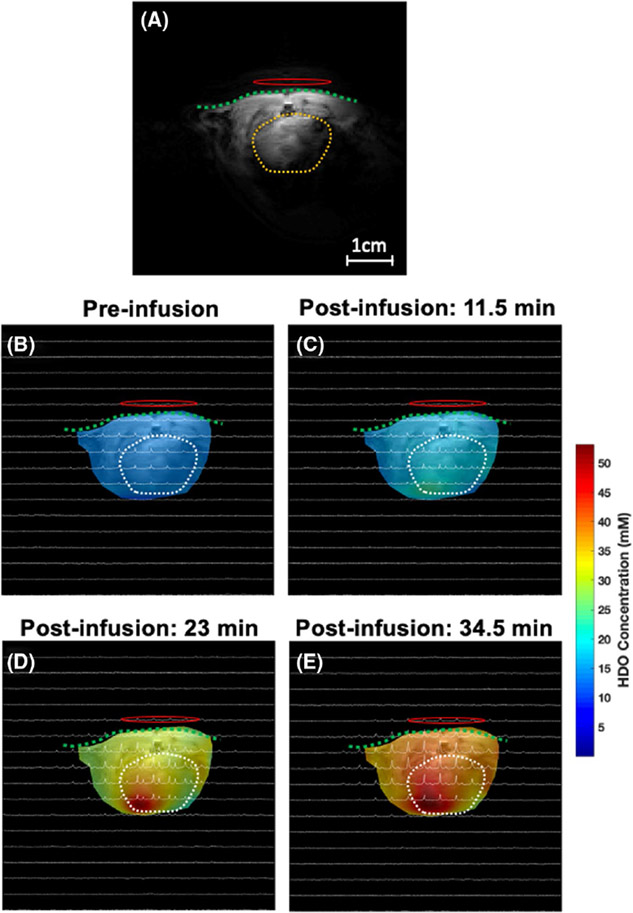
Finally, Figures 7 and 8 display the representative 2D 2H CSI (taken from the 3D CSI dataset) overlaid with the anatomical images of the rat heart under acetate infusion conditions. The colored maps in Figures 7 and 8 show the labeled acetate and deuterated HDO concentration maps at the acquisition time points (baseline, 11.5, 23, and 34.5 min after the start of acetate infusion). The acetate concentration in the rat heart increased immediately after infusion onset, reached its peak at the end of the infusion, and then started to decrease due to washout via the blood circulation and the acetate consumption in the cardiac muscle (Figure 7). In contrast, even after the end of the acetate infusion, the deuterated HDO concentration continued to increase (Figure 8).
FIGURE 7.
A 1H anatomic imaging slice covering the heart (A) and the corresponding 2D 2H CSI spectra acquired from a representative rat before (baseline) (B) and 11.5 min (C), 23 min (D), and 34.5 min (E) after the [2,2,2-d3]-acetate infusion (approximately 1 min per CSI acquisition time), where the color code represents the acetate concentration of different voxels. Most acetate signals appear largely around the center of the heart and peaked at 23 min after the start of infusion. The green dash line and yellow/white dash circle represent the chest wall and heart region, respectively. The 1H/2H dual frequency RF surface coil was placed near the rat heart as indicated by a red oval-shaped circle. CSI, chemical shift imaging
FIGURE 8.
Similar to Figure 7, the color code in each image shows the HDO concentration at different voxels acquired before (baseline) (B) and 11.5 min (C), 23 min (D), and 34.5 min (E) after the [2,2,2-d3]-acetate infusion (approximately 1 min per CSI acquisition time) and confirms that the HDO concentration increases with time. The green dash line and yellow/white dash circle represent the chest wall and heart region, respectively. The 1H/2H dual frequency RF surface coil was placed near the rat heart as indicated by a red oval-shaped circle
4 ∣. DISCUSSION
We report a pilot study to examine the feasibility of DMRSI in combination with an infusion of deuterated acetate or glucose substrate for noninvasive imaging and assessment of myocardial energy metabolism in vivo. Four deuterated compounds (glucose, acetate, Glx, and HDO) could be detected in vivo in healthy rat hearts, and most of them were robustly detectable with a relatively high temporal imaging resolution (approximately 1 min) in a completely noninvasive manner. In this study, the deuterated lactate signal was not consistently detected after glucose infusion; thus, it was excluded in the spectral fitting and quantification.
Interestingly, we found that the accumulation of myocardial HDO follows an approximately linear function up to 30-40 min after the onset of acetate or glucose infusion (Figures 5A,C and 6A); therefore, the linear regression slope was used in this study to determine the myocardial HDO accumulation rate. As shown in Figure 6A, acetate infusion led to a much faster myocardial HDO accumulation rate, approximately 6 times that of glucose infusion, which in part was due to a different number of deuterons in these 2 substrates (ie, 3 deuterons per acetate, 2 deuterons per glucose). When comparing the 2 substrates, some deuterated glucose can be stored as glycogen, although most of the 2 substrates are involved in the TCA cycle and produce HDO. In addition, deuterons labeled on glucose may also be lost during glycolysis. In contrast, acetate is a precursor of acetyl-CoA, which is produced by acetyl-CoA synthetase and enters the TCA cycle to produce citrate; one deuteron then leaves citrate C3 (Figure 2). Two additional deuterons bound to citrate C3 are lost during the conversion from succinate to fumarate and from malate to oxaloacetate (Figure 2). Based on these known chemical reaction pathways, all deuterons on labeled acetyl-CoA are lost in the first turn of the TCA cycle. Therefore, the metabolism of deuterated acetate or glucose only labels Glx on C4 rather than C3 carbon, thereby simplifying the DMRSI in vivo measurement and quantification.15
The deuterons lost from the infused acetate via the TCA cycle likely ended up in HDO, as detected in this study (Figures 4A-6A, and 8). The unique acetate metabolic pathway through the TCA cycle points to a chemical conversion from deuterated acetate to accumulated myocardial HDO, which represents a part of fatty acid metabolism in the myocardial cells. However, the HDO produced in myocardial cells becomes freely diffusible13,14; it can be effectively washed out via blood perfusion, whereas blood recirculation can bring HDO molecules generated in the body back to the heart.22 Therefore, the imaged HDO signal and change in the heart could be dominated by the entire body rather than regional heart metabolism owing to the confounding factors from blood recirculation and HDO washout, and quantification of metabolic rates using dynamic HDO changes is challenging and requires a sophisticated model to account for all contributions from these processes.22,27,28 This notion is consistent with the observation of a significant HDO signal and accumulation in the chest muscle surrounding the heart after acetate infusion (Figure 8).
The metabolism of fatty acids or glucose provides biochemical energy in the form of adenosine triphosphate molecules to support cardiac function. The adult heart prefers to consume fatty acids or acetate instead of glucose under normal conditions.29 Because the myocardium is almost completely aerobic, most of the biochemical energy used by a normal adult heart is produced by the oxidation of fatty acids in the mitochondria, and the rest is produced by the oxidation of glucose.18,19,29,30 The change in the deuterated Glx signal measured in the heart directly reflects TCA cycle activity. Our results show that acetate infusion has a faster Glx turnover rate than glucose infusion (Figures 4-6), indicating that the adult heart prefers acetate (rather than glucose) as a substrate to produce adenosine triphosphate molecules. This finding is supported by other studies reported in the literature.19,31,32
The arterial acetate concentration in the rat is low (<0.3 mM), and acetate in the blood can be self-transported into cardiomyocytes.33 For acetate infusion experiments, we applied different infusion protocols by varying the infusion duration and acetate concentration. Interestingly, the variation in infusion regime did not significantly influence the production rate of myocardial Glx and the accumulation rate of HDO in the heart. This observation suggests that the supply of acetate substrate was much greater than the metabolic demand in the heart. Thus, the TCA cycle activity demand rather than the acetate substrate supply determines the turnover rates of myocardial Glx.34 This factor could simplify the DMRSI measurement and quantification, which is critical for translational applications. It also indicates the possibility of significantly reducing the dose of infused acetate to maintain the normal physiological condition of the heart because a high acetate dose for infusion might impair cardiac function.35
The DMRSI method combined with deuterated acetate infusion has some limitations in cardiac imaging applications. For example, compared with tissue HDO, the SNR for detecting myocardial Glx is relatively low. In addition, the deuterated acetate signal has a large saturation effect owing to the long acetate T1 value (>2 s). The extending T1 relaxation time observed in deuterated [2,2,2-d3]-acetate can be explained by a new NMR relaxation phenomenon that links long-lived nuclear spin states, thus, long T1 to methyl groups including CD3 or CH3.36,37
Hyperpolarized 13C MRSI studies with infusion of hyperpolarized 13C-labeled pyruvates have shown that the metabolic dynamics of downstream metabolites would be altered in heart disease patients as compared with normal subjects.10,11 Although hyperpolarized 13C MRS/MRSI may offer better image sensitivity within a short scanning time to assess glycolysis metabolism, it is challenging to determine the TCA cycle activity, which dominates the myocardial energy metabolism and adenosine triphosphate production. In addition, considering the intrinsic limitation of the hyperpolarized 13C MRS signals of different metabolites, it has not yet been proven that hyperpolarized 13C MRSI has a spatial resolution exceeding that of the well-established 18FDG- PET imaging technique, and it is still at the stage of technology development aimed at clinical application.38 In contrast, DMRSI can image myocardial energy metabolism and metabolites before and after entering the TCA cycle to better understand the overall myocardial energy metabolism. In cardiac patients, the lactate signal can be a strong indicator of heart disease and may reflect inadequate tissue perfusion in diseased conditions such as acute heart failure.38 DMRSI might have a role in imaging the increased lactate turnover in the infarcted heart, although interestingly, deuterated lactate was not robustly detected in the healthy heart after the glucose infusion in the present study.
5 ∣. CONCLUSION
This study demonstrates the feasibility of a completely noninvasive 3D DMRSI technique for assessing myocardial energy metabolism by monitoring the dynamic changes of specifically labeled metabolites and tissue HDO in the heart after an infusion of deuterated acetate or glucose substrate. These findings suggest that the deuterated Glx signal and its changes are sensitive to the type of substrate introduced and could be tightly linked to myocardial TCA cycle activity. In conjunction with deuterated glucose or acetate administration, DMRSI could be valuable for investigating the metabolic shift from preferred fatty acid oxidation to glucose oxidation under stress and diseased conditions.18 To develop the DMRSI technique for clinical translation, further research is needed to understand the relationship between imaging measures and cardiac pathophysiology in human patients.
ACKNOWLEDGMENT
This work was partially supported by the National Institutes of Health (NIH) grants: R01 CA240953, R01 MH111413, and P41 EB027061.
REFERENCES
- 1.Centers for Disease Control and Prevention (CDC). Heart Failure. Available at: https://www.cdc.gov/heartdisease/heart_failure.htm. Accessed January 1, 2021.
- 2.Gupta A, Akki A, Wang Y, et al. Creatine kinase-mediated improvement of function in failing mouse hearts provides causal evidence the failing heart is energy starved. J Clin Invest. 2012;122:291–302. [DOI] [PMC free article] [PubMed] [Google Scholar]
- 3.World Health Organization (WHO). Cardiovascular Diseases (CVDs). www.who.int/news-room/fact-sheets/detail/cardiovascular-diseases-(cvds). Accessed January 1, 2021.
- 4.Jadvar H, Strauss HW, Segall GM. SPECT and PET in the evaluation of coronary artery disease. Radiographics. 1999;19:915–926. [DOI] [PubMed] [Google Scholar]
- 5.Faller KM, Lygate CA, Neubauer S, Schneider JE. 1H-MR spectroscopy for analysis of cardiac lipid and creatine metabolism. Heart Fail Rev. 2013;18:657–668. [DOI] [PMC free article] [PubMed] [Google Scholar]
- 6.ten Hove M, Neubauer S. Evaluating metabolic changes in heart disease by magnetic resonance spectroscopy. Heart Metab. 2006;32:18–21. [Google Scholar]
- 7.Kurhanewicz J, Bok R, Nelson SJ, Vigneron DB. Current and potential applications of clinical 13C MR spectroscopy. J Nucl Med. 2008;49:341–344. [DOI] [PMC free article] [PubMed] [Google Scholar]
- 8.Cavallari E, Carrera C, Sorge M, et al. The 13C hyperpolarized pyruvate generated by ParaHydrogen detects the response of the heart to altered metabolism in real time. Sci Rep. 2018;8:8366. [DOI] [PMC free article] [PubMed] [Google Scholar]
- 9.Rider OJ, Apps A, Miller JJ, et al. Noninvasive in vivo assessment of cardiac metabolism in the healthy and diabetic human heart using hyperpolarized 13C MRI. Circ Res. 2020;126:725–736. [DOI] [PMC free article] [PubMed] [Google Scholar]
- 10.Tougaard RS, Hansen ES, Laustsen C, et al. Acute hypertensive stress imaged by cardiac hyperpolarized [1-13C]pyruvate magnetic resonance. Magn Reson Med. 2018;80:2053–2061. [DOI] [PubMed] [Google Scholar]
- 11.Tougaard RS, Szocska Hansen ES, Laustsen C, et al. Hyperpolarized [1-13C]pyruvate MRI can image the metabolic shift in cardiac metabolism between the fasted and fed state in a porcine model. Magn Reson Med. 2019;81:2655–2665. [DOI] [PubMed] [Google Scholar]
- 12.Rider OJ, Tyler DJ. Clinical implications of cardiac hyperpolarized magnetic resonance imaging. J Cardiovasc Magn Reson. 2013;15:93. [DOI] [PMC free article] [PubMed] [Google Scholar]
- 13.Ackerman JJ, Ewy CS, Becker NN, Shalwitz RA. Deuterium nuclear magnetic resonance measurements of blood flow and tissue perfusion employing 2H2O as a freely diffusible tracer. Proc Natl Acad Sci USA. 1987;84:4099–4102. [DOI] [PMC free article] [PubMed] [Google Scholar]
- 14.Hwang YC, Kim SG, Evelhoch JL, Seyedsadr M, Ackerman JJ. Modulation of murine radiation-induced fibrosarcoma-1 tumor metabolism and blood flow in situ via glucose and mannitol administration monitored by 31P and 2H nuclear magnetic resonance spectroscopy. Cancer Res. 1991;51:3108–3118. [PubMed] [Google Scholar]
- 15.Lu M, Zhu XH, Zhang Y, Mateescu G, Chen W. Quantitative assessment of brain glucose metabolic rates using in vivo deuterium magnetic resonance spectroscopy. J Cereb Blood Flow Metab. 2017;37:3518–3530. [DOI] [PMC free article] [PubMed] [Google Scholar]
- 16.De Feyter HM, Behar KL, Corbin ZA, et al. Deuterium metabolic imaging (DMI) for MRI-based 3D mapping of metabolism in vivo. Sci Adv. 2018;4:eaat7314. [DOI] [PMC free article] [PubMed] [Google Scholar]
- 17.Kreis F, Wright AJ, Hesse F, et al. Measuring tumor glycolytic flux in vivo by using fast deuterium MRI. Radiology. 2020;294:289–296. [DOI] [PubMed] [Google Scholar]
- 18.Ritterhoff J, Tian R. Metabolism in cardiomyopathy: every substrate matters. Cardiovasc Res. 2017;113:411–421. [DOI] [PMC free article] [PubMed] [Google Scholar]
- 19.Berg JM, Tymoczko JL, Gatto GJ, Stryer L. Biochemistry. New York, NY: W.H. Freeman; 2015. [Google Scholar]
- 20.den Besten G, Van Eunen K, Groen AK, et al. The role of short-chain fatty acids in the interplay between diet, gut microbiota, and host energy metabolism. J Lipid Res. 2013;54:2325–2340. [DOI] [PMC free article] [PubMed] [Google Scholar]
- 21.Mateescu GD, Ye A, Flask CA, Erokwu B, Duerk JL. In vivo assessment of oxygen consumption via deuterium magnetic resonance. Adv Exp Med Biol. 2011;701:193–199. [DOI] [PubMed] [Google Scholar]
- 22.Zhu XH, Lu M, Chen W. Quantitative imaging of brain energy metabolisms and neuroenergetics using in vivo X-nuclear 2H, 17O and 31P MRS at ultra-high field. J Magn Reson. 2018;292:155–170. [DOI] [PMC free article] [PubMed] [Google Scholar]
- 23.Zhang GL, Zhu W, Zhu XH, et al. A dual-frequency surface coil design comprised of a single loop for both proton and deuterium magnetic resonance imaging at 16.4T. In Proceedings of the 28th Annual Meeting of ISMRM, Virtual Conference, 2020. p. 4105. [Google Scholar]
- 24.Garwood M, Schleich T, Robin Bendall M, Pegg DT. Improved fourier series windows for localization in in vivo NMR spectroscopy. J Magn Reson. 1985;65:510–515. [Google Scholar]
- 25.Hendrich K, Hu XP, Menon RS, et al. Spectroscopic imaging of circular voxels with a two-dimensional Fourier-series window technique. J Magn Reson B. 1994;105:225–232. [DOI] [PubMed] [Google Scholar]
- 26.Piao Y, Liu Y, Xie X. Change trends of organ weight background data in Sprague Dawley rats at different ages. J Toxicol Pathol. 2013;26:29–34. [DOI] [PMC free article] [PubMed] [Google Scholar]
- 27.Wiesner HM, Balla DZ, Scheffler K, et al. Quantitative and simultaneous measurement of oxygen consumption rates in rat brain and skeletal muscle using 17O MRS imaging at 16.4T. Magn Reson Med. 2021;85:2232–2246. [DOI] [PMC free article] [PubMed] [Google Scholar]
- 28.Zhu X-H, Zhang Y, Tian R-X, et al. Development of 17O NMR approach for fast imaging of cerebral metabolic rate of oxygen in rat brain at high field. Proc Natl Acad Sci USA. 2002;99:13194–13199. [DOI] [PMC free article] [PubMed] [Google Scholar]
- 29.Pascual F, Coleman RA. Fuel availability and fate in cardiac metabolism: a tale of two substrates. Biochim Biophys Acta. 2016;1861:1425–1433. [DOI] [PMC free article] [PubMed] [Google Scholar]
- 30.Stanley WC, Recchia FA, Lopaschuk GD. Myocardial substrate metabolism in the normal and failing heart. Physiol Rev. 2005;85:1093–1129. [DOI] [PubMed] [Google Scholar]
- 31.Lloyd S, Brocks C, Chatham JC. Differential modulation of glucose, lactate, and pyruvate oxidation by insulin and dichloroacetate in the rat heart. Am J Physiol Heart Circ Physiol. 2003;285:H163–H172. [DOI] [PubMed] [Google Scholar]
- 32.Murashige D, Jang C, Neinast M, et al. Comprehensive quantification of fuel use by the failing and nonfailing human heart. Science. 2020;370:364–368. [DOI] [PMC free article] [PubMed] [Google Scholar]
- 33.Buckley BM, Williamson DH. Origins of blood acetate in the rat. Biochem J. 1977;166:539–545. [DOI] [PMC free article] [PubMed] [Google Scholar]
- 34.Yaniv Y, Juhaszova M, Nuss HB, et al. Matching ATP supply and demand in mammalian heart: in vivo, in vitro, and in silico perspectives. Ann N Y Acad Sci. 2010;1188:133–142. [DOI] [PMC free article] [PubMed] [Google Scholar]
- 35.Jacob AD, Elkins N, Reiss OK, Chan L, Shapiro JI. Effects of acetate on energy metabolism and function in the isolated perfused rat heart. Kidney Int. 1997;52:755–760. [DOI] [PubMed] [Google Scholar]
- 36.Dumez J-N, Vuichoud B, Mammoli D, et al. Dynamic nuclear polarization of long-lived nuclear spin states in methyl groups. J Phys Chem Lett. 2017;8:3549–3555. [DOI] [PubMed] [Google Scholar]
- 37.Kress T, Walrant A, Bodenhausen G, Kurzbach D. Long-lived states in hyperpolarized deuterated methyl groups reveal weak binding of small molecules to proteins. J Phys Chem Lett. 2019;10:1523–1529. [DOI] [PubMed] [Google Scholar]
- 38.Zymliński R, Biegus J, Sokolski M, et al. Increased blood lactate is prevalent and identifies poor prognosis in patients with acute heart failure without overt peripheral hypoperfusion. Eur J Heart Fail. 2018;20:1011–1018. [DOI] [PubMed] [Google Scholar]


