Abstract
Intravital confocal microscopy and two-photon microscopy are powerful tools to explore the dynamic behavior of immune cells in mouse lymph nodes (LNs), with penetration depth of ~100 and ~300 μm, respectively. Here, we used intravital three-photon microscopy to visualize the popliteal LN through its entire depth (600–900 μm). We determined the laser average power and pulse energy that caused measurable perturbation in lymphocyte migration. Long-wavelength three-photon imaging within permissible parameters was able to image the entire LN vasculature in vivo and measure CD8+ T cells and CD4+ T cell motility in the T cell zone over the entire depth of the LN. We observed that the motility of naive CD4+ T cells in the T cell zone during lipopolysaccharide-induced inflammation was dependent on depth. As such, intravital three-photon microscopy had the potential to examine immune cell behavior in the deeper regions of the LN in vivo.
LNs are densely packed with highly motile lymphocytes, which enter via the high endothelial venules and then scan antigens presented by antigen-presenting cells in the T cell zone1. Intravital confocal microscopy2 and two-photon microscopy (2PM)3,4 allow dynamic, high-resolution, three-dimensional (3D) visualization of lymphocyte migration in LNs. 2PM has up to four times the imaging depth of confocal microscopy, which typically has less than 100 μm imaging depth; however, 2PM cannot penetrate the entire thickness of LNs in adult mice (for example, the popliteal LN is typically 600–900 μm thick). Although imaging from both above and below the inguinal LN on a skin flap enables visualization of both cortical and medullary sides of the LN, the mid-area between the cortex and medulla is still difficult to image5. In addition, skin flap preparation can disturb physiological lymph flow to the LN after imaging for more than 2 h, which could influence lymphocyte migration5,6.
Recently, three-photon microscopy (3PM)7-15 was used to image mouse brains at twice the depth of conventional 2PM. The longer excitation wavelengths used for 3PM (e.g., 1,300 nm and 1,700 nm) reduce tissue scattering compared to 2PM, which uses shorter excitation wavelengths (e.g., 900 nm) for the same fluorophores. In addition, three-photon excitation (3PE) provides substantial improvement in the excitation localization compared to two-photon excitation (2PE), which leads to a reduction of out-of-focus backgrounds7. Intravital 3PM has been mostly used in neuroscience to visualize vascular and neuronal structure7,14 and to record neuronal activities8,11 in the cortex and hippocampus in mice. Advanced 3PM techniques, such as high-speed 3PM with an adaptive excitation source16, rapid volumetric 3PM with Bessel beam17,18, simultaneous 2P and 3P imaging13, and head-mounted 3P microscope19, have been used in live animals.
Here, we applied 3PM technology to visualize LNs in vivo. We determined the effects of laser illumination on lymphocyte migration and the laser power and pulse energy limits for 3P imaging of LNs. Using permissible parameters, we successfully imaged blood vessels as well as migrating CD4+ and CD8+ T cells throughout the entire depth of popliteal LNs in adult mice. We observed that CD4+ and CD8+ T cells had a fairly uniform motility over the entire depth of the paracortical T cell zone in steady state, whereas the motility of naive CD4+ T cells was lower in the deep paracortical T cell zone than in the shallow regions in lipopolysaccharide (LPS)-induced inflammation.
Results
A <80 mW of 1,300 nm laser power is permissible for lymphocyte imaging.
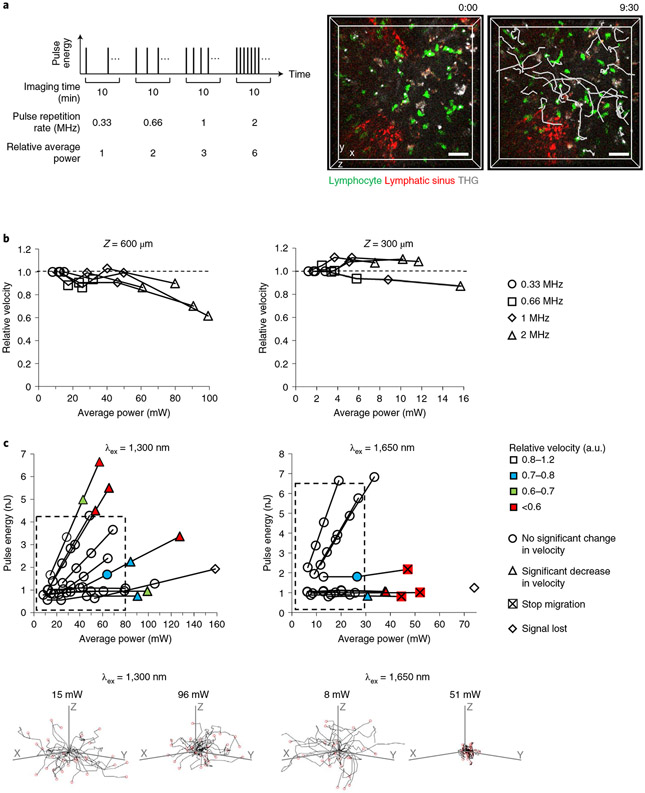
Deeper and faster imaging requires higher laser power and pulse energy, which may cause tissue damage. These parameters have been established for brain imaging11,20, but because they are not available for LN imaging, we tested the effect of laser power by monitoring changes in lymphocyte velocity with increasing laser power. The lymphocyte velocity in popliteal LNs was constant at 35.5–39.5 °C (normal LN temperature) and it decreased significantly at ~28 °C (Extended Data Fig. 1). Using an excitation wavelength of 1,300 nm, we acquired four 10-min movies to measure the velocity of enhanced green fluorescent protein (eGFP+) lymphocyte within the same 3D-volume (202 × 202 × 35 μm3) at 600 μm depth in the popliteal LN at 36.5 ± 0.5 °C. (Supplementary Movie 1). In the four movies, we gradually increased the laser power by increasing the pulse repetition rate from 0.33 to 2 MHz while maintaining the pulse energy at the focus (Fig. 1a). To compare lymphocyte velocity at these laser powers (different pulse repetition rates), we used the same time interval between z-stacks (30 s) by using the same pixel dwell time, as lymphocyte track displacement may not be proportional to the time interval3,4,21. To measure lymphocyte velocity only in the parenchyma and exclude lymphocyte migration in the lymphatic sinus, we labeled the sinus with an LYVE-1 antibody conjugated with phycoerythrin (PE) or eFluor615, red fluorophores that can be imaged simultaneously with eGFP by using a single excitation wavelength at 1,300 nm (Fig. 1a), as previously reported22. A laser power above ~90 mW at 1,300 nm induced a significant decrease in eGFP+ lymphocyte velocity in parenchyma at 600 μm depth, whereas 12–80 mW laser powers induced no change in eGFP+ lymphocyte velocity (Fig. 1b and Extended Data Fig. 2a). In terms of pulse repetition rate, a 2 MHz pulse repetition rate could only be used at 600 μm depth in some areas, depending on the transparency of the area (Fig. 1b). In the shallow regions (~300 μm), there was no significant change in the velocity at all repetition rates tested (Fig. 1b and Extended Data Fig. 2b).
Fig. 1 ∣. Permissible laser power and pulse energy were determined by monitoring lymphocyte velocity.
a, Schematic of adjusting average laser power for the four 10-min movies of lymphocyte migration taken sequentially (left) and representative images showing 3D tracks (white lines) of eGFP+ lymphocytes at 600 μm depth in LNs (right). Scale bars, 30 μm. Time scale, m:ss. b, Relative velocity of eGFP+ lymphocytes at 600 μm (left) and 300 μm (right) depth in LNs at various average powers (at surface) of 1,300 nm excitation. The four shapes of the markers correspond to the four pulse repetition rates used in each LN. Each data point represents the median of ~30 lymphocyte velocities (details in Extended Data Fig. 2). For each depth, four LNs from three mice were imaged. c, Relative velocity of eGFP+ (left) and DsRed+ (right) lymphocytes at 600 μm depth in LNs using 1,300 nm and 1,650 nm wavelength excitation (λex), respectively, at various average powers (at surface) and pulse energies (at focus). Data are displayed as color maps. Significant changes in the velocity are indicated by the shape of the markers. Dashed boxes indicate the permissible range of average power and pulse energy. Eleven LNs from nine mice were imaged at 1,300 nm and nine LNs from seven mice were imaged at 1,650 nm (details in Extended Data Figs. 2a and 3 and Extended Data Fig. 4). Thirty lymphocyte tracks at the indicated laser illumination power (bottom).
To investigate the permissible range of excitation pulse energy, we measured eGFP+ lymphocyte velocity after increasing the pulse energy and the average power at a fixed-pulse repetition rate (Extended Data Fig. 3). Laser excitation at 1,300 nm with <80 mW average power at the LN surface did not perturb eGFP+ lymphocyte velocity at 600 μm depth with a pulse energy of up to ~4.3 nJ at the focus (Fig. 1c). Because the saturation (ground-state depletion) pulse energy of common green fluorophores is ~4 nJ for 3PE in our imaging conditions (Methods), a pulse energy higher than 4 nJ at the focus is not necessary. Therefore, deep LN imaging was mostly limited by the permissible average power (tissue heating) instead of nonlinear damage induced by the high pulse energy.
When similar experiments were performed with an excitation of 1,650 nm, the <30 mW average power allowed the imaging of DsRed+ lymphocyte at a depth of 600 μm (Fig. 1c and Extended Data Fig. 4). At >40 mW average power, lymphocytes stopped migrating and cell death was observed by staining with propidium iodide, a marker for dead cells (Fig. 1c and Supplementary Movie 2). At ~150 mW for 1,300 nm and ~70 mW for 1,650 nm, the image darkened within a few minutes (Supplementary Movie 3), probably because the tissue became opaque due to tissue heating. Therefore, we defined the permissible range of laser average power at surface and pulse energy at focus as <80 mW and <4.3 nJ, respectively for 1,300 nm excitation and <30 mW and <6.8 nJ, respectively for 1,650 nm excitation.
3PM images blood vessels over the entire depth of the LN.
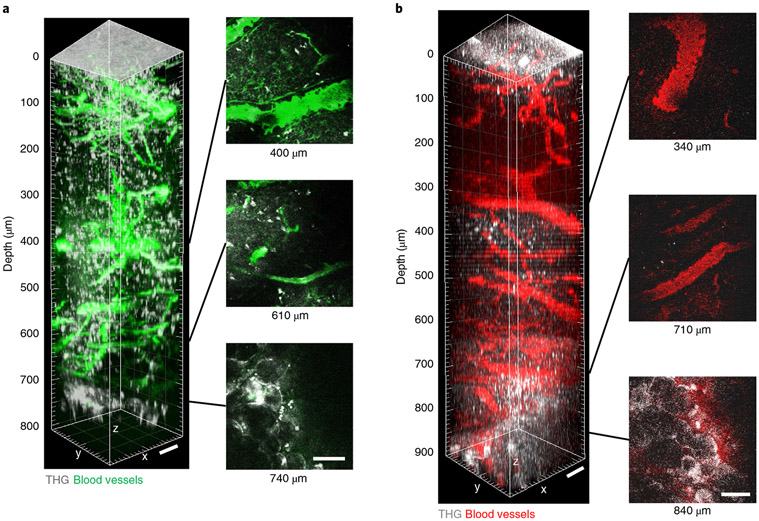
To investigate the depth limit of 3PM in LNs, we acquired an 800-μm thick z-stack using 1,280 nm 3PE in the popliteal LN of adult mice, in which the blood vessels were labeled by intravenous (i.v.) injection of fluorescein albumin. The blood vessels were detected throughout the entire depth of the LN in vivo and the bottom of the LN was determined by observing the third-harmonic generation (THG) signal from the adipocytes23 below the bottom of the LN at 740 μm depth (Fig. 2a). THG is a label-free signal that occurs at interfaces, such as the interface between water and lipids24. The interface between the cover glass and the LN and by stationary cells inside the LN, most likely nonmigratory macrophages or dendritic cells25, also provided strong THG signals (Fig. 2 and Supplementary Movies 1 and 2). Texas Red+ blood vessels could also be visualized in vivo through the whole depths of the popliteal LN (at approximately 840 μm) by 1,680 nm 3PE (Fig. 2b).
Fig. 2 ∣. In vivo 3PM of blood vessels through the entire depth of mouse popliteal LNs.
a, 3D reconstruction of 800 μm z-stack (left) and representative lateral images (right) acquired by 1,280 nm 3PE showing fluorescein+ blood vessels and THG in a popliteal LN in vivo. At 740 μm depth, adipocytes below the bottom of the LN were observed in the THG channel. b, 3D reconstruction of 900 μm z-stack (left) and representative lateral images (right) acquired by 1,680 nm 3PE showing Texas Red+ blood and THG in a popliteal LN in vivo. At 840 μm depth, adipocytes below the bottom of the LN were observed in the THG channel. Scale bars, 50 μm. The maximum average power under the objective lens was 72 mW and 21 mW for 1,280 nm and 1,680 nm, respectively.
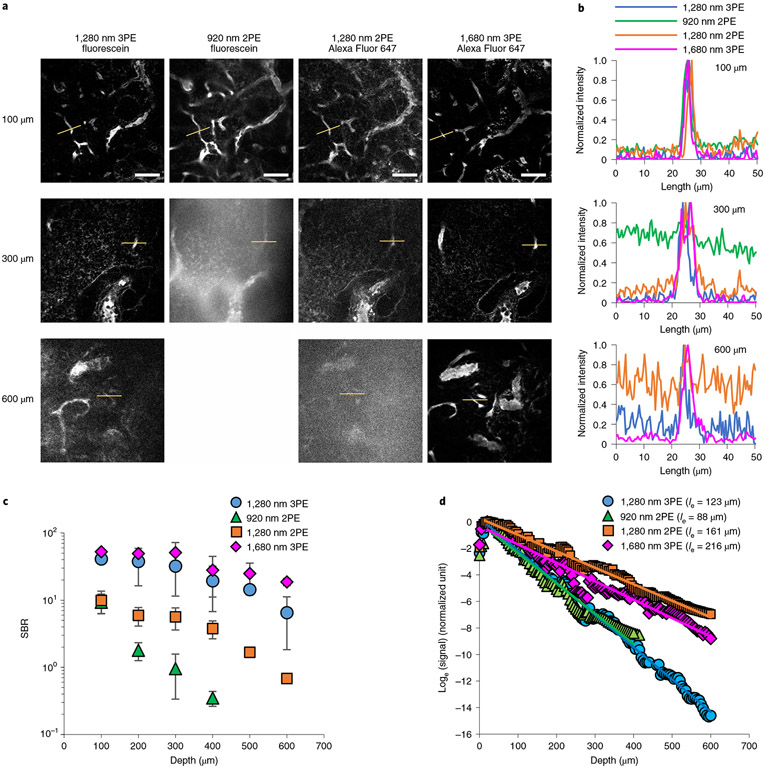
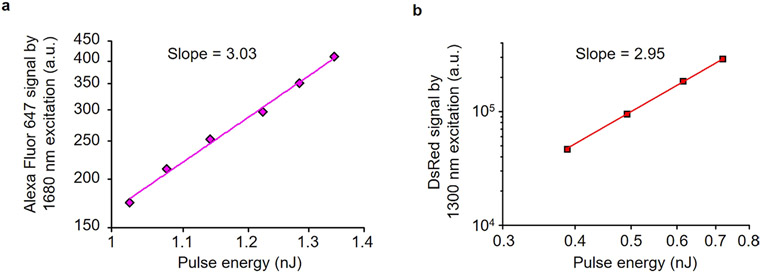
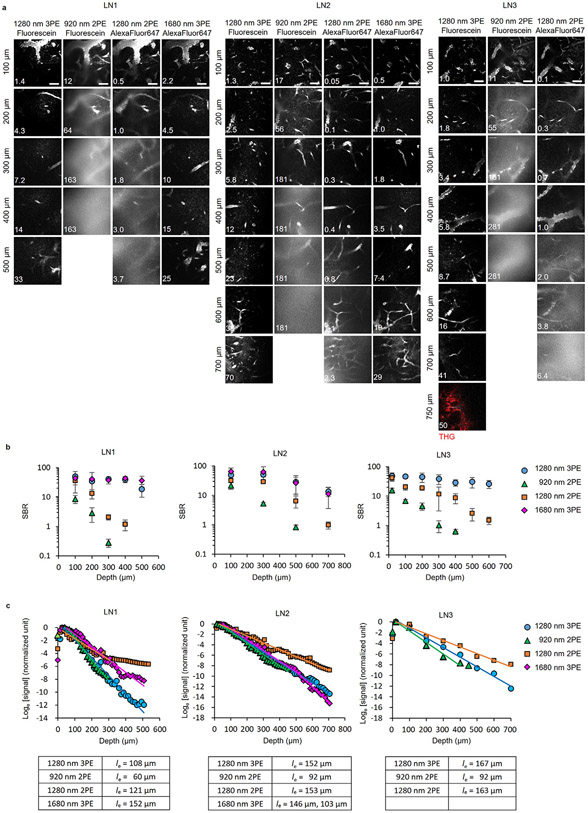
Next, we acquired in vivo images of fluorescein+ blood vessels using 1,280 nm 3PE and 920 nm 2PE and Alexa-Fluor-647+ blood vessels using 1,280 nm 2PE and 1,680 nm 3PE at the same site of the same LN. Alexa-Fluor-647 fluorescence exhibited power-cubic dependence with 1,680 nm excitation (Extended Data Fig. 5), indicating 3PE of the fluorescence at 1,680 nm. For fluorescein+ blood vessel images, 1,280 nm 3PE provided high contrast with a signal-to-background ratio (SBR) of 32 even at 300 μm depth, whereas the SBR of 920 nm 2PE was <1 at the same depth (Fig. 3a-c). The SBR for the 1,280 nm 3PE was ~6 at 600 μm depth (Fig. 3c), indicating the imaging depth limit for 1,280 nm 3PE was more than twice that of 920 nm 2PE. The effective attenuation length (le) defined by the depth at which the fluorescence signal attenuates by 1 / e2 and 1 / e3 for 2PE and 3PE, respectively, was 108–167 μm for 1,280 nm 3PE, 1.5–2 times longer than that for 920 nm 2PE (60–92 μm) (Fig. 3d and Extended Data Fig. 6). The measured le of the LNs for 1,280 nm 3PE is much shorter than that of the mouse brain (~300 μm for 1,300 nm 3PE)26. Therefore, LNs may require 3PM for high-resolution, high-contrast imaging even at 300 μm depth. Although the SBR of 1,280 nm 2PE of Alexa-Fluor-647+ blood vessels was 6–12 times higher than that of 920 nm 2PE of fluorescein+ blood vessel around the depth of 300 μm, it was 5–20 times lower than that of 1,280 nm 3PE fluorescein+ blood vessels around the depth of 600 μm (Fig. 3c and Extended Data Fig. 6), indicating a longer excitation wavelength alone may not be sufficient for deep LN imaging. In addition, 920 nm and 1,280 nm 2PE produced blurry images of blood vessels compared to 1,280 nm and 1,680 nm 3PE (Fig. 3a and Extended Data Fig. 6), indicating degraded axial confinement of 2PE. Collectively, these experiments suggest that 3PE with a long wavelength (1,280 nm or 1,680 nm) is necessary for high-contrast imaging throughout the entire depth of the LN.
Fig. 3 ∣. Comparison of LN blood vessel imaging by 3PM and 2PM.
a, In vivo images of fluorescein+ blood vessels using 1,280 nm 3PE and 920 nm 2PE and Alexa-Fluor-647+ blood vessels using 1,280 nm 2PE and 1,680 nm 3PE at the same site of the same LN. For 920 nm 2PE, no image is shown at 600 μm depth because the maximum imaging depth achieved was about 300 μm. Scale bars, 50 μm. b, Fluorescence intensity profiles across the blood vessels along the yellow lines in a. c, SBRs measured at different depths. Each data point is the average and s.d. of SBRs measured in three blood vessels in one image. d, Normalized fluorescence signal intensity as a function of imaging depth measured in the same mouse as in a. The fluorescence signal strength at a particular depth is represented by the average value of the brightest 0.5% pixels in the xy image at that depth divided by the square (for 2PE) or cube (for 3PE) of the average power. The effective attenuation length (le) was the inverse of the slope divided by the order of the nonlinear process (two for 2PE and three for 3PE).
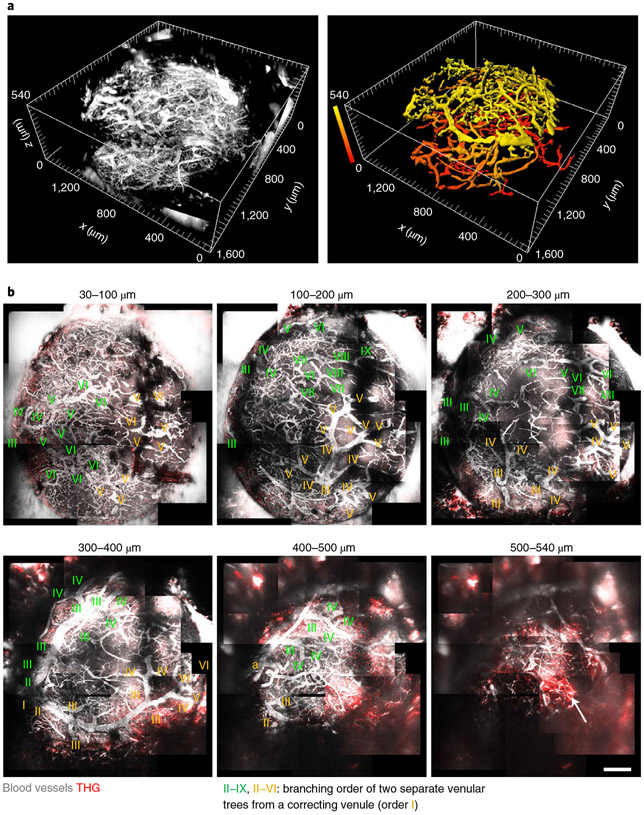
Because of regional variations of le in LN, we used different average powers for 1,280 nm 3PE at different regions to image fluorescein+ blood vessels in the entire popliteal LN with 1.5 mm diameter and 0.52 mm thickness (Fig. 4a and Supplementary Movie 4). We identified distinct venular branching from the large collecting venule (order I) to the small post-capillary venules (up to IX) in the popliteal LN (Fig. 4b) and imaged the hilus of popliteal LNs where the order I venule exits the LN (Fig. 4b), which is typically deep27. We imaged two large venules (order II) stretch around the boundary of the LN (Fig. 4b). Two separate venular trees descended from the two order II venules, with no direct connection between them (Fig. 4b). This result shows that 3PM can image the entire blood vessels in the popliteal LN in vivo.
Fig. 4 ∣. In vivo 3PM image of the entire popliteal LN vasculature.
a, 3D reconstruction of fluorescein+ blood vessel images acquired by 1,280 nm 3PE in an entire popliteal LN. Depth-color map of blood vessels (right). Depth 0 (z = 0) indicates the surface of the LN. b, Maximum intensity projection for the range of depth indicated. Roman numerals indicate venular branching order from the large collecting venule (I) to the small post-capillary venules (up to IX). The branching orders extending from the two large venules (order, II) are marked with two different colors, green and yellow. Arrow indicates the THG signal from the adipocytes below the bottom of the LN. a, arteriole. Scale bar, 200 μm.
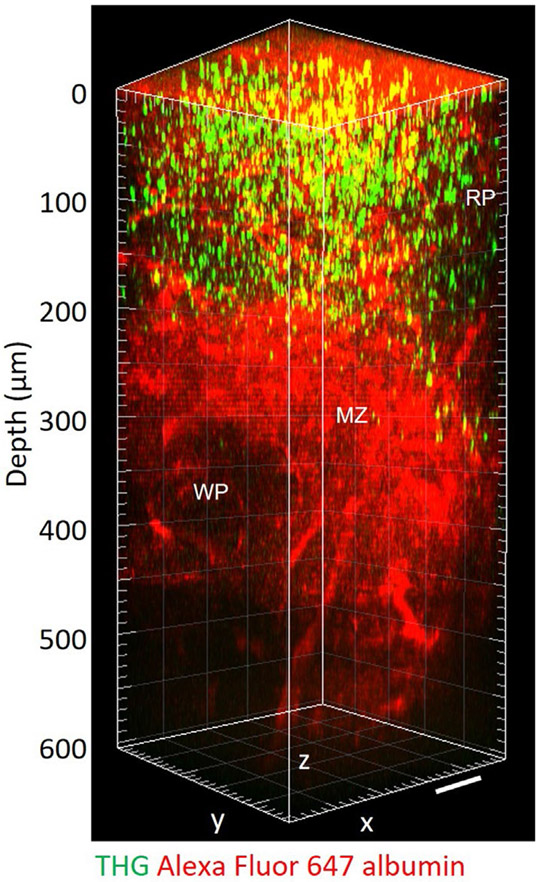
The spleen is a much larger lymphoid organ than popliteal LNs. The white pulps (WPs), in which most of the spleen lymphocytes are located, are challenging to visualize in vivo28 because the red blood cells in the red pulp above the WPs strongly scatter the laser light. Only the shallow region (50–150 μm depth) of one or two WPs in the spleen can be visualized by intravital 2PM29. Using intravital 3PM at 1,650 nm, we acquired a 600-μm z-stack in the spleen in which the blood vessels were labeled by i.v. injection of Alexa-Fluor-647 albumin. We could observe a marginal zone with high blood leakage due to many open-ended blood vessels28 and a WP below the marginal zone at ~300 μm depth (Extended Data Fig. 7). The Alexa-Fluor-647+ blood vessels in the WPs and marginal zone were visible to 450 μm and 570 μm depth, respectively (Extended Data Fig. 7). This result indicates that intravital 3PM can image deep WPs at 300–450 μm depth in the mouse spleen.
3PM images lymphocyte migration at 600 μm depth in LNs.
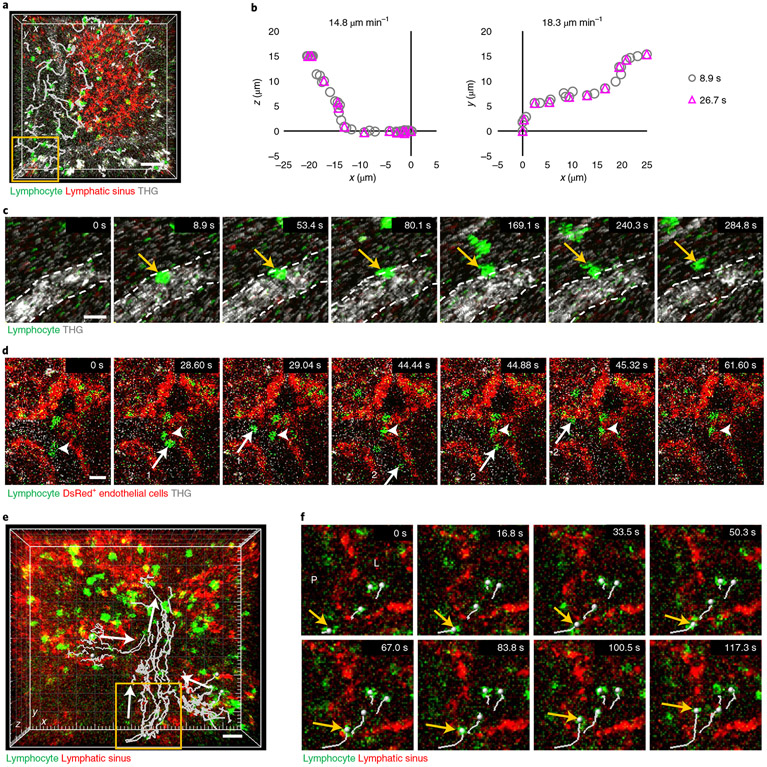
To record eGFP+ lymphocyte migration in LN parenchyma at 600 μm depth, we acquired a 202 × 202 × 35 μm3 3D volume every 8.9 s and 26.7 s using 1,300 nm 3PE (Fig. 5a and Supplementary Movie 5). These volume acquisition times are similar to those reported previously for 2P imaging in shallow regions of LNs (15–30 s per volume)30,31. Comparison of eGFP+ lymphocyte trajectories showed that, although 1,300 nm 3PM acquired data at 8.9 s per volume, the 26.7 s per volume was sufficient to track lymphocytes in the parenchyma (Fig. 5b). At 8.9 s per volume, we observed lymphocytes circulating in blood that suddenly attached to the blood vessel wall and transmigrated across the wall (Fig. 5c and Supplementary Movie 5). In addition, at 2D-frame acquisition every ~0.44 s, which is similar to frame rates for 2PM in shallow regions of LNs32, we observed lymphocytes flowing rapidly in the blood and adherent lymphocytes crawling on the blood vessel wall at 500 μm depth (Fig. 5d and Supplementary Movie 6). To visualize eGFP+ lymphocyte migration in LYVE-1-eFluor615+ lymphatic sinuses, which are the main outlet pathways for lymphocytes, we acquired a 300 × 300 × 70 μm3 volume every 16.8 s at 450–520 μm depth in popliteal LNs by 1,300 nm 3PE. While migrating randomly in the parenchyma, lymphocytes flowed in one direction in the lymphatic sinus at ~7 μm min−1 (Fig. 5e and Supplementary Movie 7), consistent with previous reports using 2PM in the shallow regions of LNs5. We could also observe lymphocytes entering the lymphatic sinus by crossing the lymphatic sinus wall within 1–2 min (Fig. 5f). These experiments show that 3PM provides sufficient imaging speed to track lymphocyte migration in the parenchyma, blood vessels and lymphatic sinus in vivo at 450–625 μm depth in LNs.
Fig. 5 ∣. In vivo 3PM of lymphocyte migration in deep LNs.
a, 3D-tracking of eGFP+ lymphocytes (white lines) in the parenchyma at 600 μm depth of popliteal LNs by acquiring a volume (202 × 202 × 35 μm3) every 8.9 s with 1,300 nm 3PE. Scale bar, 30 μm. b, Two representative lymphocyte trajectories acquired at time intervals of 8.9 s and 26.7 s. c, 3PM at 8.9 s per volume showing lymphocyte adhesion to the blood vessel wall at 8.9 s and its transmigration across the wall shown in the yellow box in a. THG shows the blood vessel. Dashed lines are the luminal boundary of the blood vessel wall. Scale bar, 10 μm. d, 3PM at 0.44 s per 2D-frame showing lymphocytes (one and two arrows) circulating in blood and lymphocytes (arrow heads) crawling on the blood vessel wall at 500 μm depth in popliteal LNs of actin-DsRed mice. Scale bar, 10 μm. e, 3D-tracking of eGFP+ lymphocytes (white lines) inside LYVE-1-eFluor615+ lymphatic sinus at 450–520 μm depth of LNs by acquiring a volume (300 × 300 × 70 μm3) every 16.8 s with 1,300 nm 3PE. Arrows indicate directions of lymphocyte flow. Scale bar, 20 μm. f, Lymphocyte (arrow) transmigrates across the wall of lymphatic sinus shown in the yellow box in e. P, parenchyma; L, inside lymphatic sinus. Scale bar, 20 μm.
T cells have uniform motility in the paracortical T cell zone.
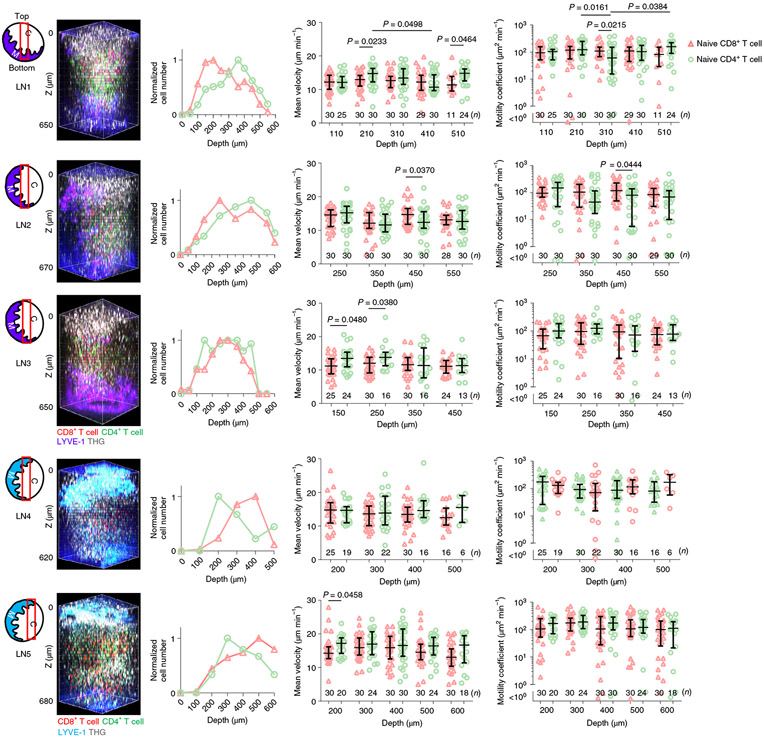
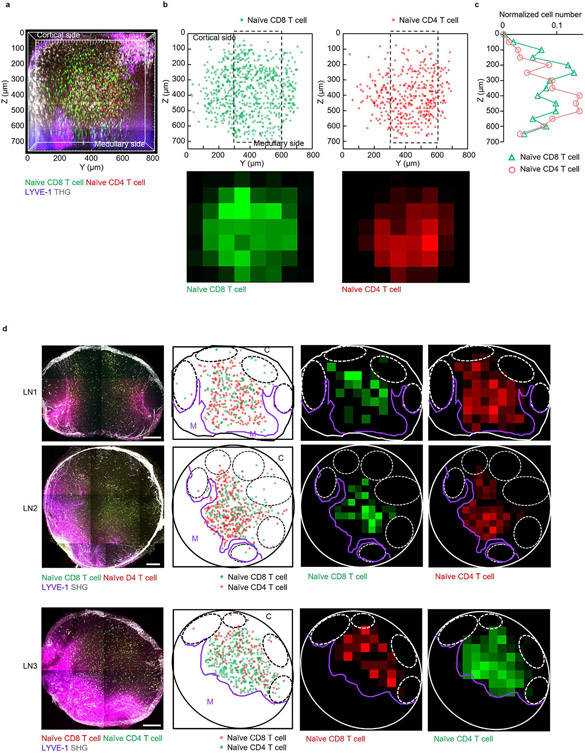
Regional differences in T cell motility in LNs have been reported. T cell velocity in subcapsular regions of the LN cortex and in medullary regions is slower than in shallow regions of paracortical T cell zones5,30. Because T cell motility in deeper regions of the paracortical T cell zone has not been studied due to limits in the imaging depth, we visualized T cell migration in the T cell zone over the entire depth of popliteal LNs in vivo. Naive eGFP+CD8+ T cells and naive DsRed+CD4+ T cells were obtained from both spleen and LNs by a Lin− gate (Methods) and adoptively transferred i.v. into wild-type mice. THG and LYVE-1-eFluor615 antibody were used to visualize blood vessels and lymphatic sinuses, respectively. These four colors were acquired simultaneously at 1,300 nm excitation (Fig. 6) and with the pulse energy at the focus of ~0.7 nJ, the DsRed signal exhibited approximately the power-cubic dependence (Extended Data Fig. 5), indicating 3PE of DsRed at 1,300 nm. In 3D volume (400 × 400 × 650 μm3) visualized in popliteal LNs, the depth where naive eGFP+CD4+ T cells were most abundant was closer to the medulla than the cortex, whereas naive DsRed+CD8+ T cell distribution seemed to be the opposite (Fig. 6). Because different imaging angles can affect T cell distribution readouts, we imaged larger volume (230 × 800 × 750 μm3), including the lateral boundary of the T cell zone by 3PM in vivo (Extended Data Fig. 8a-c), and we also imaged popliteal LN cryosections ex vivo (Extended Data Fig. 8d). These in vivo and ex vivo images showed that naive CD8+ T cells were more concentrated in paracortical regions, close to B cell follicles, whereas naive CD4+ T cells were more concentrated in regions close to the medulla (Extended Data Fig. 8). We also recorded sequential 10-min movies (202 × 202 × 35 μm3) at 100-μm depth intervals over the entire depth of the T cell zones (110–625 μm depth) to compare T cell velocities and motility coefficients at different depths (Supplementary Movie 8). While one of the five experiments showed that the mean velocity and motility coefficient of CD4+ T cells was lower in the regions with higher CD4+ T cell density, there was no significant difference in the other four experiments for both CD4+ and CD8+ T cells (Fig. 6). Our results imply that naive CD4+ and CD8+ T cells have fairly uniform motility in most paracortical T cell zones at steady state regardless of the depth and density of those cells.
Fig. 6 ∣. Measurement of T cell motility across the entire depth of popliteal LNs.
Schematics of imaging location (red box) in each LN; C, cortical side; M, medullary side in the LNs. 3D reconstruction of 620–680 μm z-stacks with the field of view of 404 × 404 μm2 acquired by 1,300 nm 3PE. Naive CD8+ T cells and naive CD4+ T cells were labeled with DsRed and eGFP, respectively, in LN1–3. To exclude the possible effect of the labeling on the results, the labeling scheme was switched for LNs 4 and 5, with DsRed and eGFP labeling CD4+ and CD8+ T cells, respectively. Five LNs from five mice were imaged. Normalized T cell distributions by depth were acquired by measuring the number of cells within a volume (202 × 202 × 50 μm3) from the indicated depth to 50 μm below at the center of the 3D z-stacks. T cell mean velocity and motility coefficients were measured within a volume (202 × 202 × 35 μm3) from the indicated depth to 35 μm below at the center of the 3D z-stacks. Each data point indicates a tracked cell; the number of analyzed cells (n = 11–30) is indicated on the graphs; the median with the interquartile range; Kruskal–Wallis test followed by Dunn’s multiple comparisons test for differences between depths; two-tailed Mann–Whitney test for difference between CD8+ and CD4+ T cells.
CD4+ T cell motility depends on the depth of inflamed LNs.
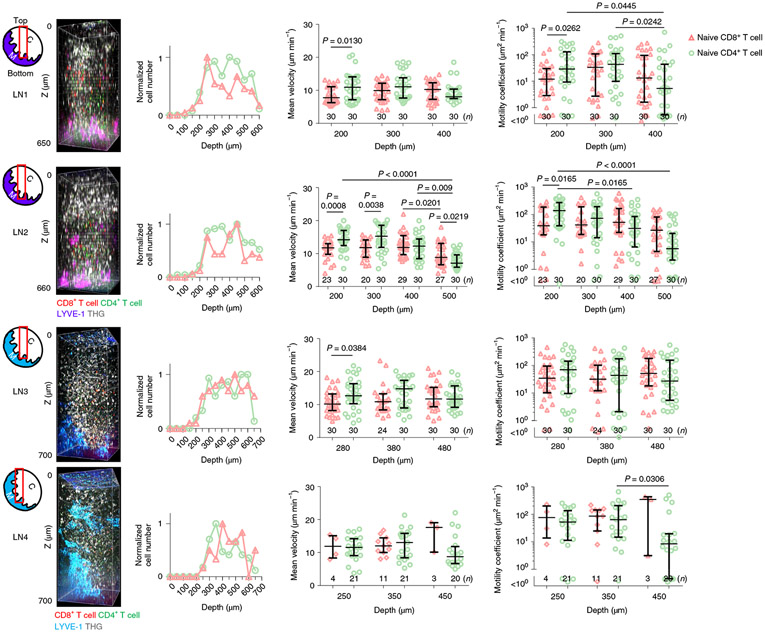
Intravital 2PM of deep T cell zone in the inflamed LN is challenging due to LN expansion. To perform intravital 3PM of T cell migration in inflamed LNs, naive CD4+ and CD8+ T cells labeled with CFSE and CMRA, respectively, were injected via the tail vein 1 d or 2 d before imaging the popliteal LN on day 4 after LPS injection in the footpad, a time point at which the number of cells in the LN can be increased by fivefold33. Both naive CFSE+CD4+ and CMRA+CD8+ T cells were observed on the cortical side of the inflamed LNs, below 200 μm depth (Fig. 7), deeper than the paracortical T cell zone in LNs in steady state (~100 μm depth; Fig. 6), probably due to enlarged B cell follicles above the paracortical T cell zone. We did not observe a naive CFSE+CD4+ and CMRA+CD8+ T cell bias toward medulla and B cell follicle, respectively of the inflamed LNs (Fig. 7). We recorded 30–45-min sequential movies (300 × 300 × 100 μm3) at 100-μm intervals at different depths to compare T cell velocities and motility coefficients (Supplementary Movie 9). The mean velocity and motility coefficient of CMRA+CD8+ T cells were lower than those of CFSE+CD4+ T cells in the shallow region of the T cell zone in the cortical side (Fig. 7). However, while the motility of CFSE+CD4+ T cells decreased toward the deeper T cell zone close to the medulla, the motility of CMRA+CD8+ T cells remained approximately constant as a function of depth (Fig. 7), which resulted in similar motilities of CD4+ and CD8+ T cell in the deep T cell zone. These experiments show that naive CD4+ T cell motility depends on the depth of paracortical T cell zone in inflamed LNs and that 3PM can be used to image the deep T cell zone in normal and inflamed LNs.
Fig. 7 ∣. In vivo 3PM of T cell migration in LPS-induced inflamed LNs.
Schematics of imaging location (red box) in each LN; C, cortical side; M, medullary side in the LNs. 3D reconstruction of 650–700 μm z-stacks with the field of view of 300 × 300 μm2 acquired by 1,300 nm 3PE. Naive CD8+ T cells and naive CD4+ T cells were labeled with CMRA and CFSE, respectively in LN1–2. To exclude the possible effect of labeling on results, the labeling scheme was switched for LNs 3 and 4, with CMRA and CFSE labeling CD4+ and CD8+ T cells, respectively. Four LNs from four mice were imaged. Normalized T cell distributions by depth were acquired by measuring the number of cells within a volume (300 × 300 × 50 μm3) from the indicated depth to 50 μm below. T cell mean velocity and motility coefficient were measured within a volume (300 × 300 × 100 μm3) from the indicated depth to 100 μm below. Each data point indicates a tracked cell; the number of analyzed cells (n = 3–30) is indicated on the graphs; the median with the interquartile range; Kruskal–Wallis test followed by Dunn’s multiple comparisons test for differences between depths; two-tailed Mann-Whitney U-test for difference between CD8+ and CD4+ T cells.
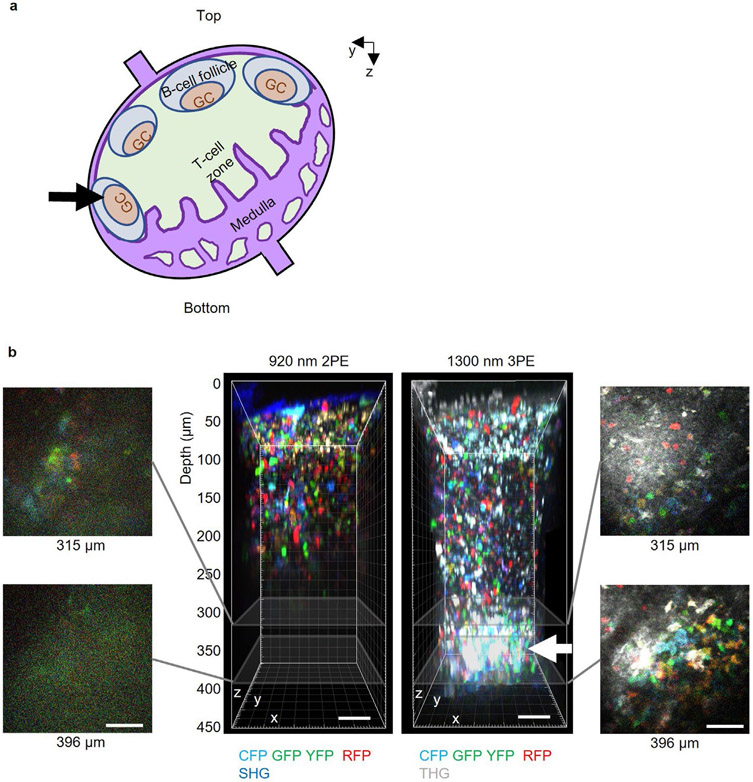
3PM images multicolor B cell migration in germinal centers.
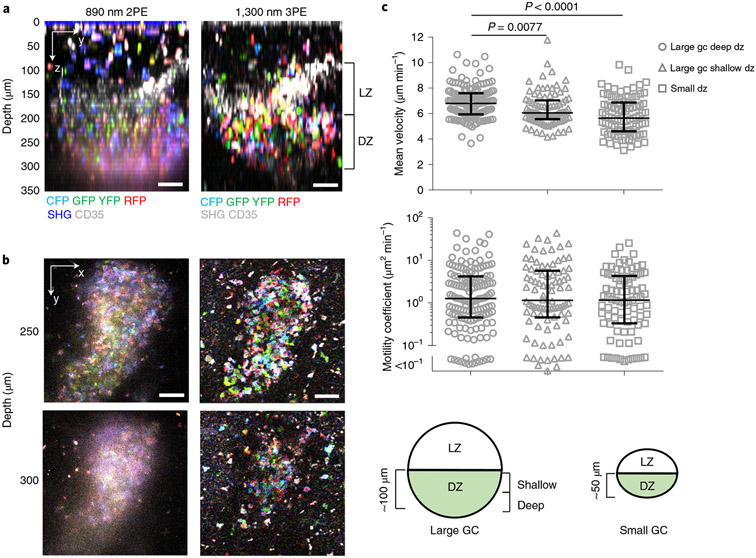
To further explore the suitability of 3PE for multicolor imaging, which is important in the imaging of immune cells, we used Cγ1Cre-Confetti mice34,35, in which B cells in the germinal center (GC) stochastically express one or two of four different fluorescent proteins (CFP in membrane, GFP in nucleus, YFP and RFP in cytoplasm), providing ten color combinations. Using 1,300 nm excitation and three detection channels, we visualized multicolor GC B cells 8–10 d after mice immunization with NP-OVA in alum (Fig. 8a,b). The GFP and YFP signals were detected by the same detection channel, as their spectral separation is small. We could distinguish seven color combinations because GFP/RFP was distinguishable from YFP/RFP. To distinguish the light zone (LZ) and dark zone (DZ) in the GCs, we labeled follicular dendritic cells in the LZ with an Alexa-Fluor-594-counjugated CD35 antibody (Fig. 8a). Intravital 2PM has been used before to image the GCs in the popliteal LN36,37, as most GCs are in the shallow region of the popliteal LN in the cortical side. However, it is challenging to reach the bottom of large GCs (DZ thickness ~100 μm) by 2PM. The lower part of GC DZs at 250–300 μm depth in popliteal LNs imaged by 890 nm 2PM was blurry, whereas the entire GC was clearly visible by 1,300 nm 3PM (Fig. 8a,b). We also compared GC B cell migration in the shallow and deep DZs of large GCs and the DZs of small GCs by acquiring 30-min movies (Fig. 8c and Supplementary Movie 10). The mean velocity of GFP+ or RFP+ B cells in the deep DZ of large GCs was higher than that in the shallow DZs of the large GCs and in the DZs of small GCs (Fig. 8c). In addition, 3PM could image GCs at deeper depth (~400 μm) on the imaging axis, depending on the orientation of the LN, whereas 2PM failed to visualize the GC at the same depth (Extended Data Fig. 9). These results indicated the ability of multicolor 3PM to study B cell dynamics in the deep part of GCs, where 2PM is difficult to visualize.
Fig. 8 ∣. In vivo 3PM of multicolor GC B cells.
a,b, Comparison of GC B cell imaging by 2PM and 3PM. yz (a) and xy (b) images show multicolor B cells in a GC of the popliteal LN of Cγ1Cre-confetti mouse at 8 d after immunization. LZ is labeled with Alexa-Fluor-594-conjugated CD35 antibody. Scale bars, 50 μm. c, Comparison of the mean velocity and motility coefficient of GC B cells among deep and shallow DZs of large GCs and DZs of small GCs; five LNs from four mice were imaged; each data point indicates a tracked cell (n = 150 tracks from five large GC deep DZs, n = 90 tracks from three large GC shallow DZs, n = 86 tracks from three small GCs); the median with the interquartile range; Kruskal–Wallis test followed by Dunn’s multiple comparisons test for differences between the groups. Schematic showing the three regions where B cell motility is compared.
Discussion
Here, we showed that 3PM can image the entire popliteal LN vasculature in vivo and capture the dynamic T cell migration in the T cell zone over the entire depth of the LN. We documented that the imaging speed for 3PM was sufficient to track lymphocyte migration in parenchyma in 3D at ~600 μm depth. Further increase in 3PM speed is possible by random access imaging or illuminating the regions of interest only with an adaptive excitation source16. Long-wavelength 2PM at 1,280 nm improved the penetration depth of popliteal LNs compared to 2PM at 920 nm. Although 1,280 nm 2PM has lower contrast in deep LNs and fewer available fluorophores than 1,280 nm 3PM, 1,280 nm 2PM has the advantage of imaging speed. Because 2PM requires less pulse energy to obtain the same fluorescence signal than 3PM, the pulse repetition rate for 2PM can be higher than that for 3PM at the same average laser power, leading to higher imaging speed for 2PM. Therefore, 1,280 nm 2PM and 3PM can be complementary to each other depending on the purpose of the experiment, the transparency of the region of interest and the choice of fluorophores.
Our observations showed differential distribution of CD8+ and CD4+ T cells in T cell zone, which is supported by previous observations that the average distance of CD8+ T cells to the T cell zone center is shorter than that of CD4+ T cells38. The biased distribution of CD4+ T cells is directed by the chemoattractant receptor Ebi2 and is important for a rapid immune response38, whereas the importance of the biased distribution of naive CD8+ T cells is unknown. Of note, the observed distribution of CFSE+CD4+ and CMRA+CD8+ T cells 1 d after adoptive transfer of cells may not fully reflect the steady state distribution at equilibrium, because entry and exit rates of CD4+ T cells in LNs are markedly faster than those of CD8+ T cells39. We also observed a decrease in CD4+ T cell motility in the deeper T cell zone close to the medulla in inflamed LNs. T cell motility is decreased in antigen-treated and parasite- or virus-infected LNs40-42, presumably because of longer interaction with antigen-presenting cells or changes in chemokine expression, such as CCL21 in the T cell zone41,43. Further studies are needed to potentially relate our findings to the distribution of antigen-presenting cells and chemokine changes in inflamed LNs.
Popliteal LNs have GCs of various sizes44. We observed a difference in GC B cell motility between large and small GC DZs, suggesting that they may provide different microenvironments for regulating B cell motility. In addition, we saw higher mean velocity of B cells in deep DZs when compared to shallow DZs (close to LZs), which was probably due to the gradient of CXCL12 in DZs. CXCR4+ GC B cells can be localized in the DZ by CXCL12-expressing stromal cells in the DZ (but not in the LZ)45. The bottom of the DZ abuts the T cell zone and stromal cells in the T cell zone also express CXCL12 (ref. 45). Therefore, expression of CXCL12 in the deep DZ may be higher than that in the shallow DZ.
Intravital 3PM imaged the entire venular tree in popliteal LNs. The venules are the main point of entrance into the LNs for blood-circulating lymphocytes. Each branch of the venular tree in a LN may have different gene expression46 and microenvironments47. Investigating the effects of the venule microenvironment on lymphocytes entering LNs will be an interesting topic for further research. In addition, intravital 3PM is a highly promising approach to explore immune cell behaviors in deep regions of other tissues and organs beyond the popliteal LNs that are currently inaccessible by 2PM, such as WPs of the spleen28, deep bone marrow of long bones48 and vascular connections between the brain and intact skull bone marrow49.
Methods
Multiphoton microscopy system.
The excitation source at 1,280–1,300 nm and 1,650–1,680 nm was a noncollinear optical parametric amplifier (Sprit-NOPA, Spectra Physics) pumped by an amplifier (Spirit 1030–70, Spectra Physics). A two-prism (SF11 glass) compressor was used to compensate for the normal dispersion of the 1,280–1,300 nm light source and the microscope, including the objective lens. A 3-mm silicon plate and the internal compressor of the NOPA (5 mm zinc selenide) were used to compensate the dispersion of the 1,650–1,680 nm light source and microscope optics50. Pulse durations (measured by second-order interferometric autocorrelation) under the objective were 47–49 fs and 63–71 fs at 1,280–1,300 nm and 1,650–1,680 nm, respectively (full-width at half maximum, assuming hyperbolic-secant-squared pulse intensity profile). The excitation source at 890 nm or 920 nm was a mode-locked Ti:sapphire laser (Chameleon Vision-S, Coherent). The pulse duration under the objective was ~90 fs after optimization of the internal prism compressor of the laser.
Images were acquired with a custom-built multiphoton microscope9 (with Scan Image 3.8) or a commercial microscope (Bergamo II with ThorImage 4.1, Thorlabs), both with a NA 1.05 objective (XLPLN25XWMP2, Olympus). While sharing the same objective lens, 3PM and 2PM use galvo scanner and resonant galvo scanner, respectively. The diameter of the excitation beam at the back aperture of the objective (~15 mm diameter clearance aperture) was measured by scanning a knife-edge across the beam. The diameters of the beams (1 / e2) are approximately 13 mm, 13 mm and 16 mm for 1,280–1,300 nm, 1,650–1,680 nm and 920 nm, respectively. The signal was epi-collected through the objective and then reflected by a 705 nm long-pass dichroic beam splitter (DBS). To detect the THG and the fluorescein fluorescence excited at 1,280 nm, 447 ± 30 nm and 525 ± 25 nm band pass filters (BPFs; FF02–447/60, FF03-525/50, Semrock) and a 488 nm DBS (Di02-R488, Semrock) were used. To detect THG and Texas Red fluorescence excited by 1,680 nm, a 562 ± 20 nm BPF and a 594 nm long-pass filter (FF01-562/40, BLP01-594R, Semrock) and a 561 nm DBS (Di02-R561, Semrock) were used. To detect THG, DsRed and eFluor660 (or Alexa-Fluor 647) excited by 1,650 nm, 535 ± 25 nm and 593 ± 23 nm BPFs (FF01-535/50, FF01-593/46, Semrock), a 647 nm long-pass filter (BLP01-647R, Semrock) and 562 nm and 635 nm DBSs (FF562-Di03, Di02-R635, Semrock) were used. For four-color imaging of T cells in T cell zone, we used 447 ± 30 nm, 525 ± 25 nm, 585 ± 15 nm and 623 ± 16 nm BPFs (FF01-447/60, FF03-525/50, FF01-585/29, FF01-623/32, Semrock) for THG, eGFP, DsRed and eFluor615, respectively and the 488 nm, 562 nm DBSs and a 594 nm DBS (Di02-R594, Semrock). For the confetti mouse imaging, we used 432 ± 18 nm, 475 ± 21 nm, 525 ± 25 nm and 593 ± 23 nm BPFs (FF01-432/36, FF01-475/42, FF03-525/50, FF01-593/46, Semrock) for THG (or SHG), CFP, GFP/YFP and RFP, respectively, and a 458 nm DBS (FF458-Di02, Semrock) and the 488 nm and 562 nm DBSs. To distinguish Alexa-Fluor-594 from the RFP in the confetti mouse, the 585 ± 15 nm and 623 ± 16 nm BPFs and the 594 nm DBS were used.
Vascular images were taken with 512 × 512 pixels per frame at a frame rate of ~1 Hz for 3PM and 1,280 nm 2PM with the 0.33 MHz pulse repetition rate NOPA and at the frame rate of ~30 Hz for 920 nm 2PM with an 80 MHz pulse repetition rate Ti:S laser. Images were averaged by 5 or 10 frames for 3PM and 1,280 nm 2PM and 30 or 90 frames for 920 nm 2PM. For comparison between 2PM and 3PM, the excitation power was adjusted to get comparable pixel values for 2PM and 3PM. To visualize lymphocyte migration in parenchyma (Supplementary Movies 1-3 and 8) by 3PM, images were taken with 256 × 256 pixels per frame at ~3 Hz frame rate. The pulse repetition rate was 0.33 to 2 MHz and the pixel dwell time was ~3.1 μs. A z-stack of eight planes with 5-μm step size was taken every 30 s. The image at each plane was averaged by ten frames. To further increase imaging speed (Supplementary Movie 5), the image at each plane was taken at ~0.9 Hz without averaging using a pulse repetition rate of 0.66 MHz and a pixel dwell time of 15.3 μs, and the waiting time for depth change was removed by using ‘Fast-z mode’ of the commercial microscope (Bergamo II, Thorlabs). A volume acquisition speed of 8.9 s per volume was achieved. To visualize circulating lymphocytes in blood (Supplementary Movie 6), a 2D frame (256 × 256 pixels) was taken at ~2.3 Hz without averaging with a pulse repetition rate of 2 MHz and a pixel dwell time of 5.1 μs. For Supplementary Movies 7, 9 and 10, z-stacks with 15, 21 and 14 planes (256 × 256 pixels) were taken every 16.8, 29.0 and 15.6 s, respectively
Calculation of saturation pulse energy for 3PE of fluorophores.
The 3PE probability (Pr) per fluorophore per pulse at the center of the focus was described in previous works20,51: , where is the temporal coherence factor (~0.51 assuming a Gaussian temporal pulse shape), τ is the pulse duration (FWHM), σ3 is the 3P cross-section, E is the pulse energy, NA is the effective numerical aperture (~0.91 in our experiments), h is the Planck’s constant, c is the speed of light and λ is the excitation wavelength. The saturation pulse energy is defined as Pr ~0.63 (when the exponent (the saturation parameter51) is 1.0). The excitation probability deviates markedly from the cubic dependence on the pulse energy when the saturation parameter is close to or >1, indicating strong ground-state depletion or saturation of 3PE. For a typical 3P absorption cross-section of σ3=1 × 10−82 cm6s2 at 1,300 nm and with 50 fs pulse duration, the saturation pulse energy for 3PE is ~4 nJ.
Mouse preparations.
All animal experimentation and housing procedures were conducted in accordance with Cornell University Institutional Animal Care and Use Committee guidance. Mice were housed in a conventional room in the animal core facility of Cornell University; 22.3–22.7 °C and 38–40% humidity; ad libitum access to food and water; 12 h dark and light cycle. Mice (C57BL/6J, 8–20 weeks old, The Jackson Laboratory) were anesthetized with 1–1.5% isoflurane in oxygen during surgery and imaging. The left or right leg skin of the mouse was shaved using a shaver and hair removal cream. The popliteal LN located behind the knee was surgically exposed by an incision of the skin and carefully removing fatty tissue covering the LN with microdissection forceps. A cover glass attached to a U-shape holder was placed on the exposed LN. During imaging, the core body temperature of the mouse was maintained at 36–37 °C with a temperature controller (FHC) consisting of a rectal probe and a heating pad. The LN temperature was maintained at 36.5 ± 0.5 °C by placing an implantable microprobe (IT-23, Braintree Scientific) close to the LN and placing a heating wire (nichrome) above the cover glass. For in vivo spleen imaging, skin hairs on the left flank area of an anesthetized mouse were removed using hair clippers and hair removal cream. A small incision of the left flank skin below the costal margin was made and a small cut was made in the peritoneal cavity. The spleen was gently placed on a cover glass attached to a U-shape holder. The edge of the spleen was wrapped with wet gauze and covered with another cover glass that was also attached to the U-shape holder. Hence, the spleen was placed between two cover glasses, which minimizes movement of the spleen to obtain clear images.
To label blood vessels, we i.v. injected fluorescein dextran (10 mg in 100 μl saline, 500 KDa, Millipore Sigma), Texas Red dextran (20 mg in 200 μl saline, 70 KDa), fluorescein albumin or Alexa-Fluor-647 albumin (5 mg in 100 μl saline, Thermo Fisher) into the tail vein or the retro-orbital venous sinus immediately before imaging. Blood vessels were also visualized by detecting THG from blood vessels8,23. In addition, DsRed-expressing vascular endothelial cells of actin–DsRed mice could be visualized because DsRed expression in vascular endothelial cells was much stronger than in other stromal cells and endogenous lymphocytes in a LN52. To label the lymphatic sinus in the popliteal LN, we injected LYVE-1 antibody conjugated with PE or eFluor615 or eFluor660 (10 μg in 50 μl, Thermo Fisher) into the footpad of the mouse about 12 h before the imaging. To visualize lymphocytes, we adoptively transferred eGFP+ or DsRed+ lymphocytes (5–10 M cells for imaging the lymphocyte in lymphatic sinus and in parenchyma) by i.v. injection into a recipient mouse the day before imaging. The eGFP+ or DsRed+ lymphocytes were obtained from the spleen of an actin–eGFP or actin–DsRed transgenic mouse, respectively (C57BL/6-Tg(CAG–eGFP)131Osb/LeySopJ, B6.Cg-Tg(CAG–DsRed*MST) 1Nagy/J, 8–20 weeks old, The Jackson Laboratory). Splenocytes were isolated by mechanical disruption of the spleen and filtering with 70-μm nylon cell strainer (Falcon) in RPMI medium and then washed. Red blood cells were removed by ACK lysing buffer (Thermo Fisher). Splenocytes were used as lymphocytes53 because ~80% of splenocytes were lymphocytes. Naive CD8+ T cells and naive CD4+ T cells were isolated from LN cells (popliteal and inguinal LNs) and splenocytes of actin–eGFP or actin–DsRed mice with MagniSort Mouse CD8 and CD4 Naive T cell Enrichment kit (8804-6825-74 and 8804-6824-74, Thermo Fisher). One million cells for each T cell were injected into the tail vein of recipient mice the day before imaging. To label splenocytes or naive T cells with the fluorescent dyes, we incubated cells at 37 °C for 20–30 min in 2 μM CFSE or 2 μM CMRA (C34554 and C34551, Thermo Fisher). These dye concentrations are typical for cell labeling for 2PM. To obtain enlarged popliteal LNs, 10 μg LPS (L2630, Millipore Sigma) was injected into the footpads of mice 4 d before imaging. For GC B cell imaging, Cγ1Cre-Confetti mice were generated by mating Cγ1Cre mice ((B6.129P2(Cg)-Ighg1tm1(cre)Cgn/J, The Jackson Laboratory) with R26R-Confetti mice (Gt(ROSA)26Sortm1(CAG-Brainbow2.1)Cle/J, The Jackson Laboratory). For immunization of Cγ1Cre-Confetti mice, we injected 50 μl of the mixture of NP-OVA (2 mg ml−1 in PBS, N-5051, Biosearch Technologies) and alum at a 1:1 volume ratio into the footpad of the mouse. To label follicular dendritic cells in the popliteal LN, we injected 2 μg CD35 antibody (558768, BD Bioscience) conjugated with Alexa-Fluor-594 (A20185, Thermo Fisher) into the footpad of the mouse about 12 h before the imaging.
Cryosection.
Popliteal LNs were carefully excised 12 h after adoptive transfer of eGFP+ or DsRed+ naive CD8+ and CD4+ T cells via the tail vein and injection of LYVE-1 antibody labeled with eFluor615 into the footpads. LNs were fixed with 1% paraformaldehyde in PBS for 6 h, dehydrated with 30% sucrose solution for 30 min and embedded in tissue-freezing medium. LNs were sectioned into 50-μm slices on a Cryostat and imaged with a commercial two-photon microscope (Bergamo II, Thorlabs) with a NA 0.6 objective (XLUMPlanFL 10XW, Olympus).
Image processing and data analysis.
To quantify the SBR, the signal was calculated from the peak intensity in the intensity profile across a blood vessel subtracted by the background. The background was the average pixel value outside the blood vessel in the intensity profile. The plots for the normalized fluorescence signal versus depth were obtained by measuring average values of the brightest 0.5% pixels within the 512 × 512 pixel image at each depth. To account for the different excitation power used at various depths, the average values were divided by the square and cube of the excitation power for 2PE and 3PE, respectively 3D reconstruction of the z-stack was rendered with ImageJ (1.8.0) or IMARIS (8.2.1). Multiple z-stacks were stitched with MATLAB (2019b) based on coordinates of the microscope stage. The overlapping area of tiles was processed by the maximum intensity projection. Discontinuities of blood vessels between tiles were corrected by manually offsetting the xy coordinates of the tiles up to 10 μm. The depth-color map of blood vessels was obtained using the IMARIS surface function. The venular branching order was assigned in the same way as in the previous report54.
To measure lymphocyte velocity, we used the automatic tracking function in IMARIS and manually corrected wrong connections between cells at different time points. To compensate for imaging site drift, we corrected lymphocyte positions with MATLAB based on the reference spot that we assumed would not actually move (for example, blood vessel and THG-expressing nonmotile cell). For motility coefficient measurement, first, we measured all available displacements in a track by setting all positions along the track as the starting position as described in a previous paper21. Mean displacement (x) for each time interval in the track was plotted against the square root of the time interval (t). Motility coefficient (MC) was calculated by squared the slope of linear fit on the plot and divided by 6 (MC = x2 / 6t). The linear fit was performed over a range of time intervals from 1 min to the mean residence time of the cells in the imaging volume. All analysis for the MC was performed with MATLAB.
Statistical analysis.
Data were tested for normality by D’Agostino and Pearson omnibus normality test. For comparison of two and multiple groups, we used a two-tailed Mann–Whitney U-test and Kruskal–Wallis test followed by Dunn’s multiple comparisons test, respectively.
Extended Data
Extended Data Fig. 1 ∣. Effect of LN temperature on lymphocyte velocity.
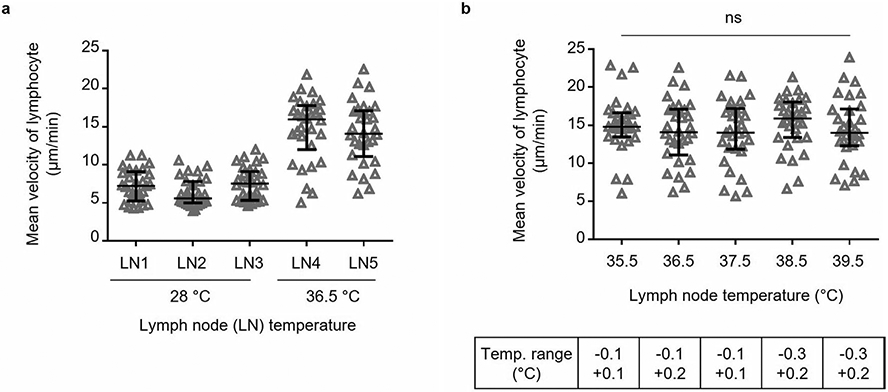
a, Comparison of lymphocyte velocities at a low LN temperature of ~28 °C and at a normal LN temperature of ~36.5 °C. b, Changes in lymphocyte velocity when the LN temperature is increased by 1 °C from 35.5 °C to 39.5 °C. ns, not significant; Kruskal-Wallis test followed by Dunn’s multiple comparisons test. Representative of two independent experiments. a-b, eGFP+ lymphocyte velocities at ~300 μm depth in popliteal LN were measured by acquiring a volume (202x202x35 μm3) every 30 seconds for 10 minutes with 1300 nm 3PE at each temperature. The maximum power on the LNs was below 2.7 mW. Each data point indicates an individual lymphocyte track; n = 30 tracks for each condition; the median with the interquartile range.
Extended Data Fig. 2 ∣. Lymphocyte velocity at 600 μm (a) and 300 μm depth (b) with increasing average power of 1300 nm excitation.
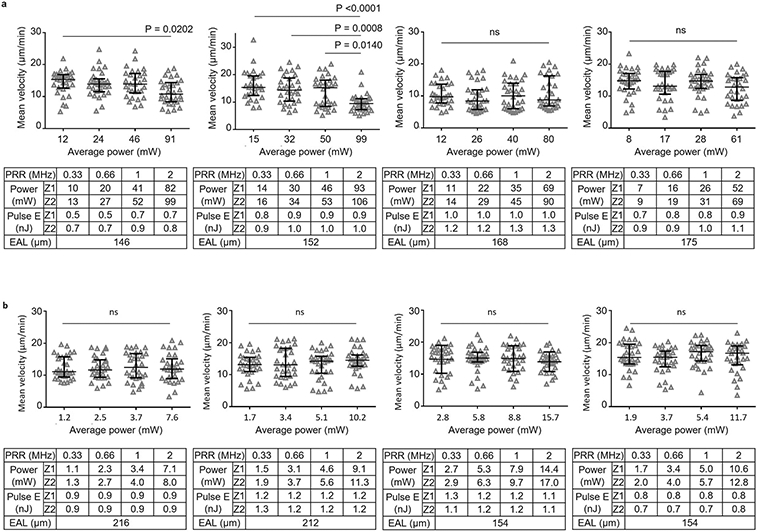
a-b, eGFP+ lymphocytes were imaged at the same site with 4 different average powers by 3PE at 1300 nm. The average power (Power) at surface is proportional to the pulse repetition rate (PRR) while the pulse energy (Pulse E) at focus remains approximately constant. For each depth, four LNs from 3 mice were imaged. The exact range of imaging depths around the nominal imaging depths of 600 μm (a) and 300 μm (b) were 590 μm to 625 μm and 290 μm to 325 μm, respectively. The average power increases with the depth from top (Z1) to bottom (Z2) of the imaging volume. Effective attenuation length (EAL) was calculated by taking 4 images at different depths (150, 300, 450, 600 μm depths for a, 50, 100, 200, 300 μm depths for b). Each data point indicates an individual lymphocyte track; n = 30 tracks for each condition; the median with the interquartile range; ns, not significant; Kruskal-Wallis test followed by Dunn’s multiple comparisons test.
Extended Data Fig. 3 ∣. Lymphocyte velocity at 600 μm with increasing pulse energy and average power at 1300 nm excitation.
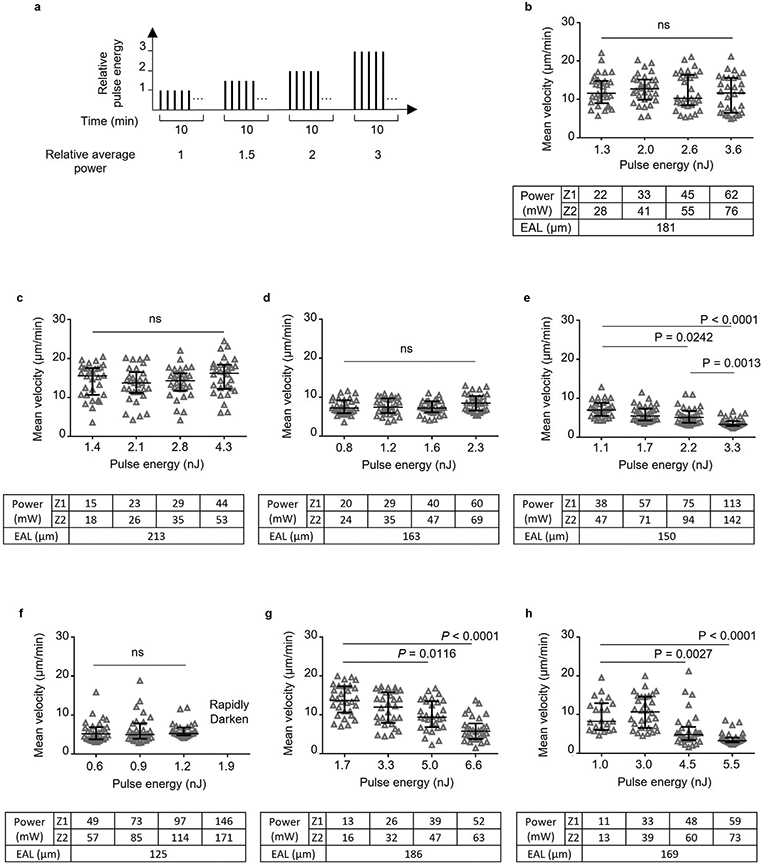
a, Schematic of adjusting pulse energy and average power for taking the four 10-min movies sequentially. The average power is proportional to the pulse energy since the repetition rate was kept constant. b-h, eGFP+ lymphocyte velocity was measured at the same site with 4 different pulse energies (at focus) by 3PE at 1300 nm. Pulse repetition rates of 0.66 and 0.33 MHz were used for b-f and g-h, respectively. Power, average power at surface. Seven LNs from 6 mice were imaged.The exact imaging depth was from 590 μm to 625 μm. The average power increases with depth from top (Z1) to bottom (Z2) of the imaging volume. Effective attenuation length (EAL) was calculated by taking 4 images at different depths. Each data point indicates an individual lymphocyte track; n = 30 tracks (except for n = 22 tracks at 1 nJ in h); the median with the interquartile range; ns, not significant; Kruskal-Wallis test followed by Dunn’s multiple comparisons test. The image rapidly darkened within a few minutes when we applied more than 146 mW in f (Supplementary Movie 3). The velocity even at relatively low power and low pulse energy in d-f is lower than 10 μm/min because the imaging site was close to LN boundary (sub-cortical region). This observation is consistent with previous reports that the velocity of both T and B cells in subcortical region is 6–8 μm/min (ref. 30).
Extended Data Fig. 4 ∣. Lymphocyte velocity at 600 μm depth with increasing average power and pulse energy at 1650 nm excitation.
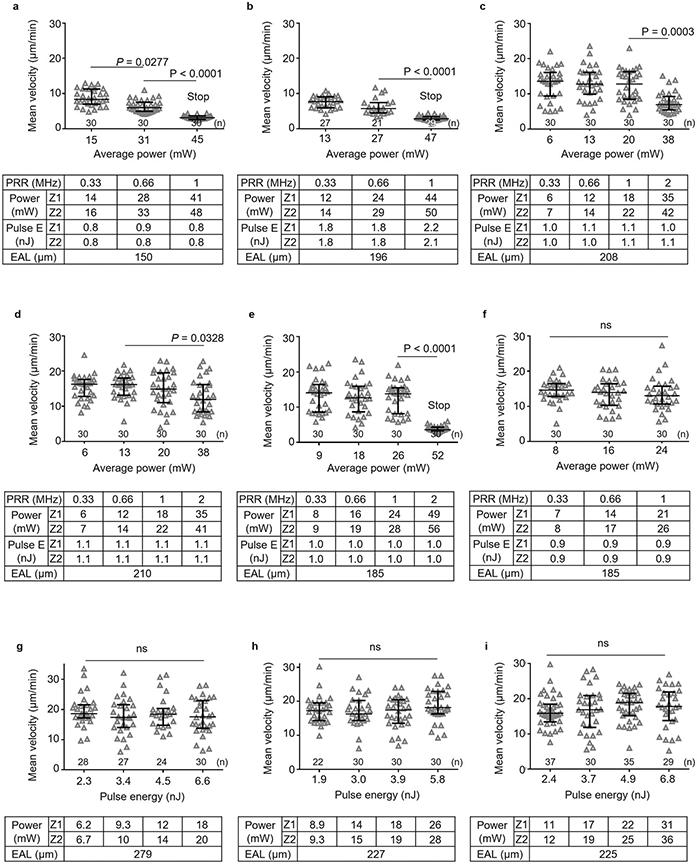
a-f, DsRed+ lymphocytes were imaged at the same site with 3 to 4 different pulse repetition rates by 3PE at 1650 nm. The average power at surface (Power) is proportional to the pulse repetition rate (PRR) while the pulse energy at focus (Pulse E) remains constant. Six LNs from 4 mice were imaged. g-i, DsRed+ lymphocytes velocity was measured at the same site with 4 different pulse energies (at focus). The average power is proportional to the pulse energy while the repetition rate was kept constant (0.33 MHz). Three LNs from 3 mice were imaged. a-i, The exact imaging depth was from 590 μm to 625 μm. The average power increases with depth from top (Z1) to bottom (Z2) of the imaging volume. Effective attenuation length (EAL) was calculated by taking 4 images at different depths. Each data point indicates an individual lymphocyte track; the number of analyzed tracks (n = 21–37) is indicated on the graphs; the median with the interquartile range; ns, not significant; Kruskal-Wallis test followed by Dunn’s multiple comparisons test. Even though most lymphocytes stopped migration at >40mW in a,b and e (Supplementary Movie 3), the measured mean velocity is non-zero due to the uncertainties that occur when determining the cell positions at different times.
Extended Data Fig. 5 ∣. Dependence of fluorescence signal on excitation pulse energy in logarithmic scales.
a, Dependence of fluorescence signal on excitation pulse energy at 1,680 nm in logarithmic scales for Alexa Fluor 647. The slope is 3.03. The signal was measured in Alexa Fluor 647 dye solution with a pulse repetition rate of 0.33 MHz. b, Dependence of fluorescence signal on excitation pulse energy at 1300 nm in logarithmic scales for DsRed. The slope is 2.95, which is in close agreement with the calculated slope value (2.93) at ~0.7 nJ using the 2 P and 3 P cross sections of DsRed (ref. 22). These observations indicate that 3 P excitation was dominant in our imaging condition. The signal was measured at the surface of a LN in an actin-DsRed mouse with a pulse repetition rate of 2 MHz. The average power is proportional to the pulse energy.
Extended Data Fig. 6 ∣. Additional experiments for comparison of LN blood vessel imaging by 3PM and 2PM.
a, In vivo images of fluorescein+ blood vessels using 1,280 nm 3PE and 920 nm 2PE, and Alexa-Fluor-647+ blood vessels using 1280 nm 2PE and 1680 nm 3PE at the same site of the same LN. Three LNs from 3 mice were imaged. The number shown in each image is the average laser power (mW) under the objective lens. Scale bars, 50 μm. b, Signal-to-background ratios (SBRs) were measured at different depths. Each data point is the average and s.d. of SBRs measured in 3 blood vessels in one image. c, Normalized fluorescence signal intensity as a function of imaging depth measured in the same mouse as in a. The fluorescence signal strength at a particular depth is represented by the average value of the brightest 0.5% pixels in the XY image at that depth divided by the square (for 2PE) or cube (for 3PE) of the average power. The effective attenuation length (le) was the inverse of the slope divided by the order of the nonlinear process (that is, 2 for 2PE and 3 for 3PE).
Extended Data Fig. 7 ∣. In vivo 3PM of mouse spleen.
Alexa-Fluor-647+ blood vessels and THG were imaged in spleen of adult mouse by 1650 nm 3PM.A shallow region (red pulp, RP) below the spleen surface contains many THG-generating cells, possibly red blood cells or leukocytes such as monocytes and macrophages. The area of high blood leakage is likely the marginal zone (MZ) where many open-ended blood vessels exist. The area below the MZ is likely white pulp (WP). Scale bars, 50 μm. The maximum average power under the objective lens was 28 mW.
Extended Data Fig. 8 ∣. Naïve CD8+ and CD4+ T cell distribution in LNs.
a, 3D reconstruction of z-stack images (230x800x750 μm3) acquired in a popliteal LN in vivo by 3PM at 1300 nm excitation. b, Naïve eGFP+ CD8+ and DsRed+ CD4 T cell positions of a in yz coordinates. (bottom) Color-maps showing relative T cell density in each 100 × 100 μm2 square area. c, Relative T cell distribution along the z-axis in the dashed boxes in b. Each data point represents the number of cells within the volume from the indicated depth to 50 μm below. a-c, Representative of two independent experiments. d, (1st column) 2D-images were acquired in 50 μm cryosections of popliteal LNs by ex vivo 2PM. Naïve CD8+ T cell and naïve CD+4 T cell were labeled with eGFP and DsRed, respectively for LN1-2. The labeling scheme was switched for LN3, with DsRed and eGFP labeling CD8+ and CD4+ T cells, respectively. C, cortical side. M, medullary side. Scale bars, 200 μm. (2nd column) Naïve CD8+ and CD4+ T cell positions in xy coordinates. Dotted circles are the area presumed to be B cell follicles. (3rd-4th columns) Color-maps showing relative T cell density in each 100 × 100 μm2 square area.
Extended Data Fig. 9 ∣. Deep GC of popliteal LN on the imaging axis.
a, A schematic diagram of the deep GC (arrow) on the imaging axis. b, Comparison of the deep GC (~400 μm depth) imaging by 920 nm 2PM and 1300 nm 3PM. The maximum average power under the objective lens was 204 mW (80 MHz repetition rate) and 21 mW (0.33 MHz repetition rate) for 2PM and 3PM, respectively. Scale bars, 50 μm.
Supplementary Material
Acknowledgements
We thank members of the Xu research group (B. Li, X. Yang, F. Xia, C. Wu, N. Akbari, A. T. Mok, A. K. LaViolette and S. Zhao) and H. M. Isles (Weill Cornell Medicine) for their help with valuable discussions. We thank N. Nishimura (Cornell University) and C.-Y. Eom (Cornell University) for providing the facility for performing lymphocyte isolation and cryosection. We thank K. A. Strednak and the Cornell Center for Animal Resources and Education for their animal care service. This research was supported from Basic Science Research Program through the National Research Foundation of Korea funded by the Ministry of Education (NRF-2019R1A6A3A03033817 to K.C.), NSF DBI-1707312 Cornell NeuroNex Hub (to C.X.), National Institutes of Health (NIH)/National Institute of Allergy and Infectious Diseases 5R01AI132738–05 (to A.S. and A.M.M.), NIH/National Cancer Institute 1R01CA238745-01A1 (to C.X. and A.S.), the University of Rochester Program for Advanced Immune Bioimaging Pilot (NIH/National Institute of Allergy and Infectious Diseases P01AI102851 to C.X.) and the University of Rochester School of Medicine and Dentistry.
Footnotes
Code availability
The MATLAB codes for tiling of multiple stacks and calculating motility coefficients can be found at https://github.com/idglbak87/Tiling-and-Calculating-velocity-and-MC.git.
Reporting Summary. Further information on research design is available in the Nature Research Reporting Summary linked to this article.
Competing interests
The authors declare no competing interests.
Extended data is available for this paper at https://doi.org/10.1038/s41590-021-01101-1.
Supplementary information The online version contains supplementary material available at https://doi.org/10.1038/s41590-021-01101-1.
Online content
Any methods, additional references, Nature Research reporting summaries, source data, extended data, supplementary information, acknowledgements, peer review information; details of author contributions and competing interests; and statements of data and code availability are available at https://doi.org/10.1038/s41590-021-01101-1.
Data availability
Source data of the graphs are provided with this paper. The raw images of this study are available from the corresponding author upon request. Source data are provided with this paper.
References
- 1.Girard J-P, Moussion C & Förster R HEVs, lymphatics and homeostatic immune cell trafficking in lymph nodes. Nat. Rev. Immunol 12, 762–773 (2012). [DOI] [PubMed] [Google Scholar]
- 2.Stoll S, Delon J, Brotz TM & Germain RN Dynamic imaging of T cell-dendritic cell interactions in lymph nodes. Science 296, 1873–1876 (2002). [DOI] [PubMed] [Google Scholar]
- 3.Miller MJ, Wei SH, Parker I & Cahalan MD Two-photon imaging of lymphocyte motility and antigen response in intact lymph node. Science 296, 1869–1873 (2002). [DOI] [PubMed] [Google Scholar]
- 4.Miller MJ, Wei SH, Cahalan MD & Parker I Autonomous T cell trafficking examined in vivo with intravital two-photon microscopy. Proc. Natl Acad. Sci. USA 100, 2604–2609 (2003). [DOI] [PMC free article] [PubMed] [Google Scholar]
- 5.Grigorova IL et al. Cortical sinus probing, S1P1-dependent entry and flow-based capture of egressing T cells. Nat. Immunol 10, 58–65 (2009). [DOI] [PMC free article] [PubMed] [Google Scholar]
- 6.Mempel TR, Scimone ML, Mora JR & von Andrian UH In vivo imaging of leukocyte trafficking in blood vessels and tissues. Curr. Opin. Immunol 16, 406–417 (2004). [DOI] [PubMed] [Google Scholar]
- 7.Horton NG et al. In vivo three-photon microscopy of subcortical structures within an intact mouse brain. Nat. Photonics 7, 205–209 (2013). [DOI] [PMC free article] [PubMed] [Google Scholar]
- 8.Ouzounov DG et al. In vivo three-photon imaging of activity of GCaMP6-labeled neurons deep in intact mouse brain. Nat. Methods 14, 388–390 (2017). [DOI] [PMC free article] [PubMed] [Google Scholar]
- 9.Wang T et al. Three-photon imaging of mouse brain structure and function through the intact skull. Nat. Methods 15, 789–792 (2018). [DOI] [PMC free article] [PubMed] [Google Scholar]
- 10.Guesmi K et al. Dual-color deep-tissue three-photon microscopy with a multiband infrared laser. Light. Sci. Appl 7, 12 (2018). [DOI] [PMC free article] [PubMed] [Google Scholar]
- 11.Yildirim M, Sugihara H, So PTC & Sur M Functional imaging of visual cortical layers and subplate in awake mice with optimized three-photon microscopy. Nat. Commun 10, 177 (2019). [DOI] [PMC free article] [PubMed] [Google Scholar]
- 12.Takasaki K, Abbasi-Asl R & Waters J Superficial bound of the depth limit of two-photon imaging in mouse brain. eNeuro 7, 1–10 (2020). [DOI] [PMC free article] [PubMed] [Google Scholar]
- 13.Weisenburger S et al. Volumetric Ca2+ imaging in the mouse brain using hybrid multiplexed sculpted light microscopy. Cell 177, 1050–1066 (2019). [DOI] [PMC free article] [PubMed] [Google Scholar]
- 14.Liu H et al. In vivo deep-brain structural and hemodynamic multiphoton microscopy enabled by quantum dots. Nano Lett. 19, 5260–5265 (2019). [DOI] [PubMed] [Google Scholar]
- 15.Wang T & Xu C Three-photon neuronal imaging in deep mouse brain. Optica 7, 947 (2020). [Google Scholar]
- 16.Li B, Wu C, Wang M, Charan K & Xu C An adaptive excitation source for high-speed multiphoton microscopy. Nat. Methods 17, 163–166 (2020). [DOI] [PMC free article] [PubMed] [Google Scholar]
- 17.Chen B et al. Rapid volumetric imaging with Bessel-beam three-photon microscopy. Biomed. Opt. Express 9, 1992 (2018). [DOI] [PMC free article] [PubMed] [Google Scholar]
- 18.Rodríguez C, Liang Y, Lu R & Ji N Three-photon fluorescence microscopy with an axially elongated Bessel focus. Opt. Lett 43, 1914 (2018). [DOI] [PMC free article] [PubMed] [Google Scholar]
- 19.Klioutchnikov A et al. Three-photon head-mounted microscope for imaging deep cortical layers in freely moving rats. Nat. Methods 17, 509–513 (2020). [DOI] [PubMed] [Google Scholar]
- 20.Wang T et al. Quantitative analysis of 1300-nm three-photon calcium imaging in the mouse brain. eLife 9, 1–22 (2020). [DOI] [PMC free article] [PubMed] [Google Scholar]
- 21.Sumen C, Mempel TR, Mazo IB & von Andrian UH Intravital microscopy. Immunity 21, 315–329 (2004). [DOI] [PubMed] [Google Scholar]
- 22.Hontani Y, Xia F & Xu C Multicolor three-photon fluorescence imaging with single-wavelength excitation deep in mouse brain. Sci. Adv 7, eabf3531 (2021). [DOI] [PMC free article] [PubMed] [Google Scholar]
- 23.Weigelin B, Bakker G-J & Friedl P Third harmonic generation microscopy of cells and tissue organization. J. Cell Sci 129, 245–255 (2016). [DOI] [PubMed] [Google Scholar]
- 24.Barad Y, Eisenberg H, Horowitz M & Silberberg Y Nonlinear scanning laser microscopy by third harmonic generation. Appl. Phys. Lett 70, 922–924 (1997). [Google Scholar]
- 25.Tsai C-K et al. Imaging granularity of leukocytes with third harmonic generation microscopy. Biomed. Opt. Express 3, 2234 (2012). [DOI] [PMC free article] [PubMed] [Google Scholar]
- 26.Wang M et al. Comparing the effective attenuation lengths for long wavelength in vivo imaging of the mouse brain. Biomed. Opt. Express 9, 3534 (2018). [DOI] [PMC free article] [PubMed] [Google Scholar]
- 27.Halin C, Mora JR, Sumen C & von Andrian UH In vivo imaging of lymphocyte trafficking. Annu. Rev. Cell Dev. Biol 21, 581–603 (2005). [DOI] [PubMed] [Google Scholar]
- 28.Lewis SM, Williams A & Eisenbarth SC Structure and function of the immune system in the spleen. Sci. Immunol 4, eaau6085 (2019). [DOI] [PMC free article] [PubMed] [Google Scholar]
- 29.Arnon TI, Horton RM, Grigorova IL & Cyster JG Visualization of splenic marginal zone B-cell shuttling and follicular B-cell egress. Nature 493, 684–688 (2013). [DOI] [PMC free article] [PubMed] [Google Scholar]
- 30.Worbs T, Mempel TR, Bölter J, Von Andrian UH & Förster R CCR7 ligands stimulate the intranodal motility of T lymphocytes in vivo. J. Exp. Med 204, 489–495 (2007). [DOI] [PMC free article] [PubMed] [Google Scholar]
- 31.Park EJ et al. Distinct roles for LFA-1 affinity regulation during T-cell adhesion, diapedesis, and interstitial migration in lymph nodes. Blood 115, 1572–1581 (2010). [DOI] [PMC free article] [PubMed] [Google Scholar]
- 32.Park C et al. Lymph node B lymphocyte trafficking is constrained by anatomy and highly dependent upon chemoattractant desensitization. Blood 119, 978–989 (2012). [DOI] [PMC free article] [PubMed] [Google Scholar]
- 33.Soderberg KA et al. Innate control of adaptive immunity via remodeling of lymnh node feed arteriole. Proc. Natl Acad. Sci. USA 102, 16315–16320 (2005). [DOI] [PMC free article] [PubMed] [Google Scholar]
- 34.Casola S et al. Tracking germinal center B cells expressing germ-line immunoglobulin 1 transcripts by conditional gene targeting. Proc. Natl Acad. Sci. USA 103, 7396–7401 (2006). [DOI] [PMC free article] [PubMed] [Google Scholar]
- 35.Livet J et al. Transgenic strategies for combinatorial expression of fluorescent proteins in the nervous system. Nature 450, 56–62 (2007). [DOI] [PubMed] [Google Scholar]
- 36.Shulman Z et al. T follicular helper cell dynamics in germinal centers. Science 341, 673–677 (2013). [DOI] [PMC free article] [PubMed] [Google Scholar]
- 37.Victora GD et al. Germinal center dynamics revealed by multiphoton microscopy with a photoactivatable fluorescent reporter. Cell 143, 592–605 (2010). [DOI] [PMC free article] [PubMed] [Google Scholar]
- 38.Baptista AP et al. The chemoattractant receptor Ebi2 drives intranodal naive CD4+ T cell peripheralization to promote effective adaptive immunity. Immunity 50, 1188–1201 (2019). [DOI] [PubMed] [Google Scholar]
- 39.Mandl JN et al. Quantification of lymph node transit times reveals differences in antigen surveillance strategies of naive CD4+ and CD8+ T cells. Proc. Natl Acad. Sci. USA 109, 18036–18041 (2012). [DOI] [PMC free article] [PubMed] [Google Scholar]
- 40.Gerner MY, Torabi-Parizi P & Germain RN Strategically localized dendritic cells promote rapid T cell responses to lymph-borne particulate antigens. Immunity 42, 172–185 (2015). [DOI] [PubMed] [Google Scholar]
- 41.John B et al. Dynamic imaging of CD8+ T cells and dendritic cells during infection with Toxoplasma gondii. PLoS Pathog. 10.1371/journal.ppat.1000505 (2009). [DOI] [PMC free article] [PubMed] [Google Scholar]
- 42.Hor JL et al. Spatiotemporally distinct interactions with dendritic cell subsets facilitates CD4+ and CD8+ T cell activation to localized viral infection. Immunity 43, 554–565 (2015). [DOI] [PubMed] [Google Scholar]
- 43.Mueller SN et al. Regulation of homeostatic chemokine expression and cell trafficking during immune responses. Science 317, 670–674 (2007). [DOI] [PubMed] [Google Scholar]
- 44.Stoler-Barak L et al. B cell dissemination patterns during the germinal center reaction revealed by whole-organ imaging. J. Exp. Med 216, 2515–2530 (2019). [DOI] [PMC free article] [PubMed] [Google Scholar]
- 45.Bannard O et al. Germinal center centroblasts transition to a centrocyte phenotype according to a timed program and depend on the dark zone for effective selection. Immunity 39, 912–924 (2013). [DOI] [PMC free article] [PubMed] [Google Scholar]
- 46.Veerman K, Tardiveau C, Martins F, Coudert J & Girard JP Single-cell analysis reveals heterogeneity of high endothelial venules and different regulation of genes controlling lymphocyte entry to lymph nodes. Cell Rep. 26, 3116–3131(2019). [DOI] [PubMed] [Google Scholar]
- 47.Rodda LB et al. Single-cell RNA sequencing of lymph node stromal cells reveals niche-associated heterogeneity. Immunity 48, 1014–1028(2018). [DOI] [PMC free article] [PubMed] [Google Scholar]
- 48.Kim JM & Bixel MG Intravital multiphoton imaging of the bone and bone marrow environment. Cytom. A 10.1002/cyto.a.23937 (2019). [DOI] [PubMed] [Google Scholar]
- 49.Herisson F et al. Direct vascular channels connect skull bone marrow and the brain surface enabling myeloid cell migration. Nat. Neurosci 21, 1209–1217 (2018). [DOI] [PMC free article] [PubMed] [Google Scholar]
- 50.Horton NG & Xu C Dispersion compensation in three-photon fluorescence microscopy at 1,700 nm. Biomed. Opt. Express 6, 1392 (2015). [DOI] [PMC free article] [PubMed] [Google Scholar]
- 51.Xu C & Webb WW in Topics in Fluorescence Spectroscopy (ed. Lakowicz JR) 6, 471–540 (Springer US, 2002). [Google Scholar]
- 52.Choe K et al. Stepwise transmigration of T- and B cells through a perivascular channel in high endothelial venules. Life Sci. Alliance 4, e202101086 (2021). [DOI] [PMC free article] [PubMed] [Google Scholar]
- 53.Chen Q et al. Fever-range thermal stress promotes lymphocyte trafficking across high endothelial venules via an interleukin 6 trans-signaling mechanism. Nat. Immunol 7, 1299–1308 (2006). [DOI] [PubMed] [Google Scholar]
- 54.Von Andrian UH Intravital microscopy of the peripheral lymph node microcirculation in mice. Microcirculation 3, 287–300 (1996). [DOI] [PubMed] [Google Scholar]
Associated Data
This section collects any data citations, data availability statements, or supplementary materials included in this article.
Supplementary Materials
Data Availability Statement
Source data of the graphs are provided with this paper. The raw images of this study are available from the corresponding author upon request. Source data are provided with this paper.


