

Abstract
INTRODUCTION:
Cardiovascular risk factors in midlife have been linked to late life risk for Alzheimer’s disease and related dementias (ADRD). The relation of vascular risk factors on cognitive decline within midlife has been less studied.
METHODS:
Using data from the Study of Women’s Health Across the Nation, we examined associations of midlife hypertension, elevated lipid levels, diabetes, fasting glucose, central adiposity and Framingham Heart Age with rates of cognitive decline in women who completed multiple cognitive assessments of processing speed, working and verbal memory during midlife.
RESULTS:
Diabetes, elevated fasting glucose, central obesity, and heart age greater than chronological age were associated with rate of decline in processing speed during midlife. Vascular risk factors were not related to rate of decline in working or verbal memory.
DISCUSSION:
Midlife may be a critical period for intervening on cardiovascular risk factors to prevent or delay of later life cognitive impairment and ADRD.
Keywords: Cardiovascular risk, cognitive decline, midlife, women
BACKGROUND
With the aging of the population and increasing life expectancy, the burden of Alzheimer’s disease and related dementias (ADRD) is rising exponentially [1], and emphasis on identifying modifiable factors to delay or prevent onset is increasing [2,3]. Although currently there are no treatments, a third of ADRD cases may be preventable, and cardiovascular risk factors are promising prevention targets [2–4]. Better understanding the impact of modifiable risk factors prior to the onset of cognitive impairment is particularly critical, as prevention efforts may be most impactful if applied early [5]. Midlife cardiovascular risk factors have been linked to later life cognitive impairment and dementia [6–8] and may be stronger predictors than risk factors measured in old age [6,7]. However, fewer studies have examined associations of cardiovascular risk factors with midlife cognitive change [9–14]. Prior studies have used a limited number of midlife cognitive assessments, and most have not addressed cognitive change prior to the 8th decade, when dementia rates begin to accelerate [15].
We examined associations of cardiovascular risk factors with change in cognitive performance using data from the Study of Women’s Health Across the Nation (SWAN), a multi-ethnic cohort of women which includes multiple longitudinal midlife cognitive assessments. We hypothesized that presence of adverse risk factors would predict greater rates of midlife cognitive decline.
METHODS
Sample
SWAN is a longitudinal study of the menopause transition, with sites in Boston, MA, Chicago, IL, Detroit, MI, Los Angeles, CA, Newark, NJ, Oakland, CA and Pittsburgh, PA. Each recruited non-Hispanic White women and women from one minority group (non-Hispanic Black, Chinese, Hispanic, Japanese). Informed consent procedures were approved by local Human Subjects Review Boards [16]. Eligible women were ages 42–52 years at screening, had an intact uterus and at least one intact ovary, were not pregnant or breast feeding, and reported menstrual bleeding and that they had not used exogenous hormones affecting ovarian or pituitary function within the past three months. Clinic visits were conducted at baseline (1996–1997) and approximately annually through 2017. Cognitive testing was initiated at the fourth visit (2000–2002), attended by 2,658 (80.5%) of 3,302 women in the inception cohort, and was repeated at visits 6, 7–10, 12–13 and 15.
Prior SWAN analyses demonstrate improved cognitive performance across the initial three assessments and show that this reflects mainly learning effects adjusted for age [17]. To minimize the impact of these effects on our measures of cognitive change, the cognitive baseline for the present analysis was chosen as the third cognitive assessment (SWAN Visit 7, 2003–2005), the point at which learning effects were no longer evident. Analyses include women who completed their third cognitive assessment at this study visit. Women from the NJ site (which recruited Hispanic women) are not included, as SWAN Visit 7 was not the third cognitive assessment at this site. Follow-up through Visit 15 (2015–2017) is included.
Women with history of stroke (N=13), myocardial infarction (N=21), or angina (N=29) prior to the cognitive baseline were excluded. Women using hormone therapy at baseline were excluded (N=313), as hormone therapy has been associated with cardiovascular risk and with cognitive function in some studies [18]. Women with missing data for cardiovascular risk factors (N=208), or covariates (N=68), or those who did not complete cognitive assessments in the same language at each visit (N=13) also were excluded, leaving an analytic sample of 1,139 women, who contributed 5,958 study visits. Participants’ visits were censored due to incident stroke (N=31) or reported hormone use (N=496), leaving 5,431 visits in the analysis (Figure 1).
Figure 1.
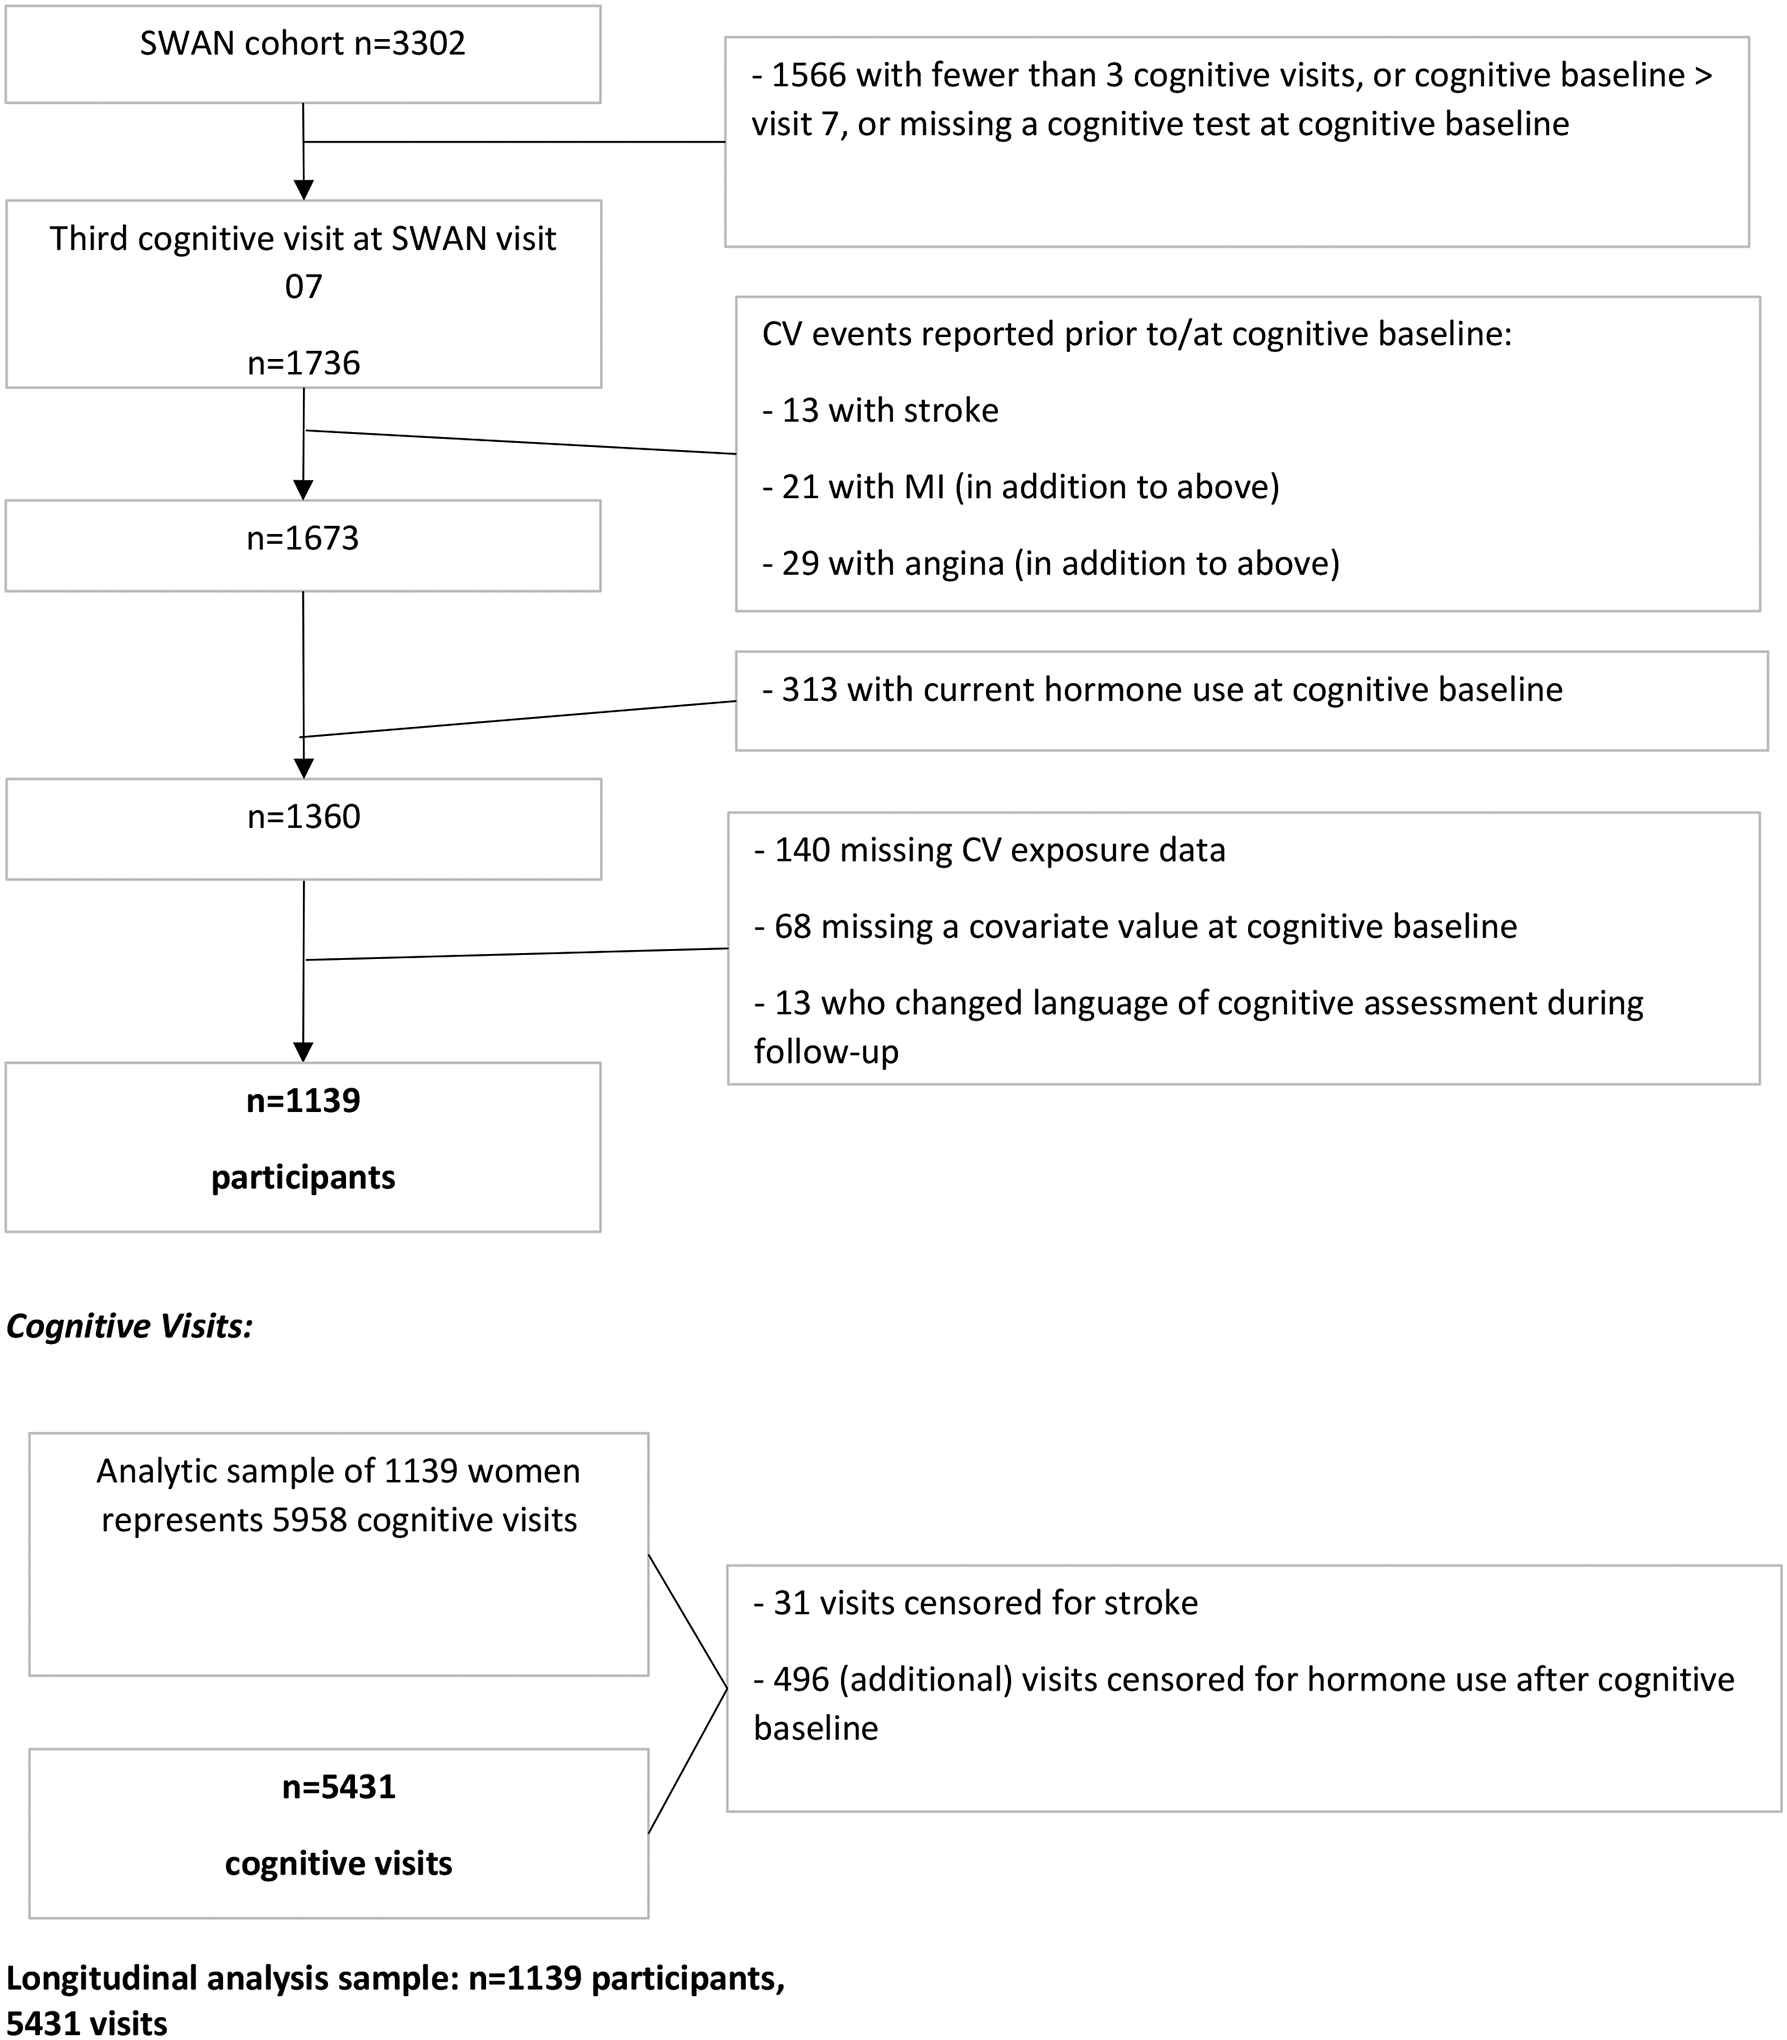
Flow-Chart for Analysis Sample
Cognitive Assessments
Selection of the cognitive battery took into consideration the cohort’s relatively young age when cognitive assessments began and SWAN’s focus on the menopause transition. Processing speed was assessed with the written Symbol Digit Modalities Test (SDMT) score, which represents the number of test items correct (range 0–110 [19]. Processing speed has been shown to decline prior to old age, and lower processing speed may influence degradation of multiple cognitive domains [20]. Verbal episodic memory was assessed with the East Boston Memory Test (EBMT) immediate and delayed recall, (range 0–12) [21]. Menopausal hormonal changes are hypothesized to preferentially impact this domain [22]. Working memory was evaluated by Digit Span Backward (DSB; range 0–12) [23], which has been shown to be sensitive to changes before old age [24]. For each test, higher score reflects better cognitive performance. Tests were professionally forward and back translated into Spanish, Japanese, and Chinese. An adjudication panel resolved discrepancies, and tests were administered by native or highly fluent speakers.
Cardiovascular Risk Factors at Cognitive Baseline
Standardized protocols were used to measure waist circumference, and blood pressure. Central obesity was defined as waist circumference ≥ 80 cm for Japanese and Chinese women, and > 88 cm for all others [25]. Blood pressure was measured twice, and values were averaged. Hypertension was defined as mean systolic ≥ 130 mmHg or mean diastolic ≥ 85 mmHg, or use of antihypertensive treatment [26]. Diabetes was defined as fasting glucose ≥ 126 mg/dl on two or more study visits between enrollment and cognitive baseline or ever use of diabetes medications.
Lipids and lipoproteins were analyzed on EDTA-treated plasma [27,28]. Total cholesterol (TC) and triglycerides (TG) were analyzed by enzymatic methods on a Hitachi 747 analyzer (Boehringer Mannheim Diagnostics, Indianapolis, IN) [27]. High density lipoprotein cholesterol (HDL-C) was isolated using heparin-2M manganese chloride [28]. Low density lipoprotein cholesterol (LDL-C) was estimated by the Friedewald equation [29], and was set to missing where TG exceeded 400 mg/dl. Lipid values were dichotomized according to NIH consensus criteria: LDL ≥ 130 mg/dl or use of lipid lowering medication, HDL < 50 mg/dl, triglycerides ≥ 150 mg/dl [30].
Glucose was measured using a hexokinase coupled reaction on a Hitachi 747-200 (Roche Molecular Biochemicals Diagnostics, Indianapolis, IN), and was dichotomized as ≥ 100 mg/dl per the 2019 American Diabetes Association definition for pre-diabetes [31].
Heart age was computed based on the Framingham General Cardiovascular Risk Score, which estimates 10-year risk for a clinical cardiovascular event using a weighted score based on age, TC, HDL, systolic blood pressure, smoking and diabetes [32]. Heart age translates an individual’s risk score to the age of a person with the same risk but for whom all other risk factors are within the normal range [32]. We categorized heart age according to whether it was greater than chronological age.
Analyses included the following time-invariant covariates: study site, race/ethnicity, education (> versus ≤ high school), and physical activity at cognitive baseline. Physical activity was assessed using an adaptation of the Kaiser Physical Activity Survey based on the Baecke questionnaire. An overall score was computed as the sum of domain specific indices for: sports/exercise, household/care giving, and daily activities [33]. Physical activity was considered time invariant, using the assessment closest to the cognitive baseline, (Visit 6), as it was not available at all visits.
Time-varying covariates were self-reported alcohol use (none/infrequent versus twice a week or more), current smoking, difficulty paying for basics (not very hard versus somewhat/ very hard), menopause status, and central obesity. Menopause status was defined retrospectively by menstrual bleeding patterns reported at each visit and was classified as: 1) pre-menopause (bleeding within past 3 months and no change in regularity) 2) early peri-menopause (at least one menstrual period within the past 3 months and changing regularity), 3) late peri-menopause (3 consecutive months of amenorrhea), 4) natural postmenopause (≥ 12 months of amenorrhea), 5) surgical menopause (bilateral oophorectomy) or 6) indeterminate status (hysterectomy with unknown ovarian status).
Statistical Analysis
Characteristics at the cognitive baseline visit were compared for participants included and excluded from this analysis. Categorical variables are presented as number and percent and compared by chi-square test. Continuous variables are presented by mean and standard deviation and compared by t-test if distributed approximately normal, or by median and interquartile range with Wilcoxon rank-sum test p-value if skewed. Cross-sectional analyses compared the mean of baseline SDMT and DSB scores by cardiovascular risk status, using parametric t-tests. Since EBMT showed a skewed distribution, median scores were compared by Wilcoxon rank-sum test.
Baseline level and the change over time (slope) were estimated for each cognitive test using longitudinal mixed-effects regression models, with separate models for each cardiovascular risk factor. Cognitive scores were modeled as a function of baseline risk status, baseline age, time (years) between baseline and follow-up cognitive tests, and an interaction term for risk factor status by time. Models included random effects for the intercept and slope. Fully adjusted models included time-invariant covariates: study site, race/ethnicity, education, physical activity score, and time-varying covariates: menopausal status, difficulty paying for basics, alcohol use, central obesity, and current smoking.
SDMT and DSB scores were modeled with linear mixed-effects regression. EBMT values were transposed by reverse-scoring so that the outcome variable represents the number of items missed. Reverse-scored EBMT was then modeled using Poisson mixed-effects regression. All analyses were performed using SAS 9.4 (SAS Institute, Cary, NC, USA).
RESULTS
Characteristics of the study population at the cognitive baseline are shown in Table 1. At the cognitive baseline, the mean age was 53.4 ± 2.6 years, and 55% were postmenopausal. Financial strain was reported by 25.5% and 16.2% had less than or equal to high school education. Women excluded from the analysis were slightly older, more likely to be Black, less likely to have education beyond high school and tended to have higher prevalence of risk factors versus included women. The mean number of cognitive assessments included was 4.7, and mean age at last follow-up was 62.5 ± 4.1 years. Nearly half met criteria for central adiposity or hyperlipidemia, one third had hypertension and one third had heart age > chronological age. The baseline summary cognitive scores were within the normal range for individuals of this age [34].
Table 1.
Participant Characteristics at Cognitive Baseline
| Demographic characteristics, n (%) | Included | Excluded | p |
|---|---|---|---|
| Number of participants | 1139 | 21631 | 0.007 |
| Age, mean ± sd | 53.4 ± 2.6 | 53.7 ± 2.7 | |
| Race/Ethnicity | <.001 | ||
| Black | 294 (25.8) | 640 (29.6) | |
| White | 565 (49.6) | 986 (45.6) | |
| Chinese | 116 (10.2) | 134 (6.2) | |
| Hispanic | 0 (0) | 286 (13.2) | |
| Japanese | 164 (14.4) | 117 (5.4) | |
| Menopausal Status | <.001 | ||
| Post by BSO or hysterectomy | 54 (4.7) | 121 (10.7) | |
| Natural Post | 573 (50.3) | 669 (58.9) | |
| Late Peri | 139 (12.2) | 96 (8.5) | |
| Early Peri or Pre | 373 (32.7) | 250 (22.0) | |
| Education ≤ high school | 185 (16.2) | 634 (29.7) | <.001 |
| Somewhat/very hard to pay for basics | 291 (25.5) | 368 (32.9) | <.001 |
| Alcohol use ≥ 2/week | 261 (22.9) | 260 (23.1) | 0.921 |
| Current Smoker | 114 (10.0) | 180 (14.6) | 0.001 |
| Exposure characteristics, n (%) | |||
| n=7142 | |||
| Central obesity | 537 (47.1) | 367 (51.4) | 0.075 |
| Glucose ≥ 100 mg/dl | 188 (16.5) | 145 (20.3) | 0.038 |
| Diabetes | 82 (7.2) | 83 (11.6) | 0.001 |
| Triglycerides ≥ 150 mg/d | 239 (21.0) | 209 (29.3) | <.001 |
| HDL < 50 mg/dl (%) | 299 (26.3) | 203 (28.4) | 0.304 |
| Hyperlipidemia | 528 (46.4) | 332 (46.5) | 0.952 |
| Hypertension | 399 (35.0) | 330 (46.2) | <.001 |
| Heart age > Chronological age | 385 (33.8) | 342 (47.9) | <.001 |
| Cognitive outcomes at baseline | n=8593 | ||
| Symbol Digit Modalities, mean ± sd | 58.8 ± 10.3 | 55.2 ± 12.1 | <.001 |
| Digit Span Backward, mean ± sd | 7.0 ± 2.3 | 6.7 ± 2.3 | 0.012 |
| East Boston Memory Test: Delayed, median (IQR) | 10 (10, 12) | 10 (9, 12) | <.001 |
Some characteristics contain missing data in the excluded group.
Among excluded participants with CV risk factor data (n=714).
Participant n for cognitive outcomes at baseline among those excluded ranges from n= 859 (Digit Span Backward) to n=912 (East Boston Memory Test).
Table 2 displays the results for unadjusted cross-sectional comparisons of baseline cognitive test scores by cardiovascular risk status. Mean SDMT scores were at least 2 points higher among those with central obesity (60.0 versus 57.5), high glucose (59.1 versus 57.1), diabetes (59.2 versus 53.9), hypertension (60.1 versus 56.4), and heart age greater than chronological age (60.0 versus 56.5) compared to those without (all p<0.05). There was no statistically significant difference in SDMT for any of the lipid measures. Baseline DSB results showed a similar pattern, with lower scores among those with central obesity, high glucose, diabetes, hypertension, and heart age greater than chronological age compared to those without (all p<0.01), but no differences by lipid status. We also observed statistically greater number of EBMT items missed when comparing mean Wilcoxon scores for each CV risk factor except high triglycerides and high LDL.
Table 2.
Cognitive Test Score by CV Status at Cognitive Baseline (n=1139)
| Exposure Status | |||||||||
|---|---|---|---|---|---|---|---|---|---|
| Symbol Digit Modalities, mean (SD) | Digit Span Backward, mean (SD) | Reverse-Scored East Boston Memory Test Delayed,1 median (Mean Wilcoxon Score)2 | |||||||
| Exposure characteristic3 | No | Yes | p | No | Yes | p | No | Yes | p |
| Central obesity | 60.0 (10.0) | 57.5 (10.5) | <.001 | 7.2 (2.3) | 6.8 (2.3) | 0.003 | 1 (539) | 2 (605) | 0.001 |
| High glucose | 59.1 (10.1) | 57.1 (11.3) | 0.024 | 7.1 (2.3) | 6.5 (2.2) | 0.004 | 1 (562) | 2 (612) | 0.051 |
| Diabetes | 59.2 (10.1) | 53.9 (11.6) | <.001 | 7.0 (2.3) | 6.1 (2.0) | <.001 | 1 (565) | 2 (634) | 0.061 |
| High Triglycerides | 58.9 (10.5) | 58.6 (9.8) | 0.777 | 7.0 (2.4) | 6.9 (2.2) | 0.472 | 1 (566) | 2 (583) | 0.464 |
| Low HDL | 58.9 (10.4) | 58.5 (10.1) | 0.568 | 7.0 (2.4) | 6.9 (2.2) | 0.343 | 1 (553) | 2 (617) | 0.003 |
| Hyperlipidemia | 59.3 (10.1) | 58.2 (10.6) | 0.068 | 7.0 (2.3) | 6.9 (2.4) | 0.559 | 1 (572) | 2 (568) | 0.856 |
| Hypertension | 60.1 (9.7) | 56.4 (11.0) | <.001 | 7.1 (2.3) | 6.7 (2.3) | 0.002 | 1 (545) | 2 (616) | <.001 |
| Heart Age > Chronologic Age | 60.0 (10.0) | 56.5 (10.5) | <.001 | 7.2 (2.3) | 6.6 (2.3) | <.001 | 1 (538) | 2 (634) | <.001 |
Abbreviations: SD, standard deviation
Scores from East Boston Memory Test are reversed and represent number of items missed.
All medians (IQRs) for Reversed-EBMT Delayed tests were 1 (0, 2) for unexposed groups and 2 (0, 3) for exposed groups with the exception of hyperlipidemia, with median (IQR) of 1 (0,3) among unexposed and 2 (0,2) among exposed. To illustrate differences in distributions, median and mean Wilcoxon score for each group are displayed.
Cut-points are as follows: Central obesity, waist circumference ≥ 80 cm for Japanese and Chinese women, and > 88 cm for all others; Glucose, ≥ 100 mg/dl; Diabetes, medication use or fasting glucose ≥ 126 mg/dl; High triglycerides, ≥ 150 mg/dl; Low HDL < 50 mg/dl, Hyperlipidemia, medication use or LDL ≥ 130 mg/dl; Hypertension, medication use or systolic ≥ 130 mmHg or diastolic ≥ 85 mmHg.
Table 3 shows results from linear (SDMT and DSB) or Poisson regression (EBMT) models relating cardiovascular risk status at baseline to cognitive performance over follow-up, adjusted for covariates. For each risk factor, the main effect indicates the baseline comparison between those with and without the risk factor. Estimates for the time parameter indicate change per year in cognitive performance, and the interaction term (risk factor × time) indicates whether the rate of change in cognitive performance over time differed by presence of the risk factor.
Table 3.
Estimates of Association between CV Risk Factors and Longitudinal Cognitive Scores (n=1139)
| Linear Regression Estimates | Poisson Regression Estimates | |||||||||||
|---|---|---|---|---|---|---|---|---|---|---|---|---|
| Symbol Digit Modalities | Digit Span Backward | Reverse-Scored East Boston Test, Delayed | ||||||||||
| Model 11 | Model 22 | Model 11 | Model 22 | Model 11 | Model 22 | |||||||
| Exposure characteristic | Beta | p-value | Beta | p-value | Beta | p-value | Beta | p-value | IRR3 | p-value | IRR | p-value |
| Central obesity4 | −2.09 | <.001 | 0.32 | 0.570 | −0.41 | 0.001 | −0.24 | 0.060 | 1.14 | 0.007 | 1.05 | 0.359 |
| Time5 | −0.21 | <.001 | −0.21 | <.001 | −0.01 | 0.121 | −0.01 | 0.114 | 1.01 | 0.029 | 1.01 | 0.005 |
| Central obesity*Time | −0.09 | 0.012 | −0.10 | 0.010 | −0.01 | 0.159 | −0.01 | 0.144 | 0.99 | 0.142 | 0.99 | 0.147 |
| High glucose | −2.06 | 0.010 | −1.03 | 0.156 | −0.48 | 0.005 | −0.28 | 0.081 | 1.23 | 0.001 | 1.17 | 0.012 |
| Time | −0.23 | <.001 | −0.24 | <.001 | −0.02 | 0.001 | −0.02 | 0.004 | 1.01 | 0.072 | 1.01 | 0.029 |
| High glucose*Time | −0.15 | 0.003 | −0.15 | 0.004 | 0.00 | 0.997 | 0.00 | 0.893 | 0.99 | 0.444 | 1.00 | 0.573 |
| Diabetes | −5.22 | <.001 | −1.85 | 0.079 | −0.90 | 0.000 | −0.45 | 0.057 | 1.26 | 0.011 | 1.10 | 0.273 |
| Time | −0.24 | <.001 | −0.24 | <.001 | −0.02 | 0.000 | −0.02 | 0.001 | 1.01 | 0.106 | 1.01 | 0.024 |
| Diabetes*Time | −0.26 | 0.001 | −0.25 | 0.002 | 0.02 | 0.337 | 0.02 | 0.322 | 1.00 | 0.971 | 1.00 | 0.943 |
| High Triglycerides | −0.34 | 0.647 | −1.11 | 0.094 | −0.15 | 0.329 | −0.28 | 0.064 | 1.03 | 0.663 | 1.03 | 0.565 |
| Time | −0.24 | <.001 | −0.25 | <.001 | −0.02 | 0.001 | −0.02 | 0.003 | 1.01 | 0.089 | 1.01 | 0.032 |
| High Triglycerides*Time | −0.04 | 0.388 | −0.05 | 0.314 | 0.00 | 0.697 | 0.00 | 0.708 | 1.00 | 0.631 | 1.00 | 0.962 |
| Low HDL | −0.23 | 0.731 | 1.13 | 0.069 | −0.12 | 0.401 | −0.04 | 0.766 | 1.11 | 0.057 | 1.04 | 0.488 |
| Time | −0.24 | <.001 | −0.25 | <.001 | −0.02 | 0.008 | −0.02 | 0.017 | 1.01 | 0.029 | 1.01 | 0.010 |
| Low HDL*Time | −0.03 | 0.485 | −0.04 | 0.413 | −0.01 | 0.457 | −0.01 | 0.366 | 0.99 | 0.132 | 0.99 | 0.257 |
| Hyperlipidemia | −0.65 | 0.277 | −0.61 | 0.257 | −0.04 | 0.750 | −0.05 | 0.668 | 1.03 | 0.614 | 1.03 | 0.502 |
| Time | −0.24 | <.001 | −0.25 | <.001 | −0.02 | 0.003 | −0.02 | 0.005 | 1.00 | 0.307 | 1.01 | 0.099 |
| Hyperlipidemia*Time | −0.03 | 0.409 | −0.01 | 0.703 | 0.01 | 0.546 | 0.01 | 0.473 | 1.00 | 0.714 | 1.00 | 0.796 |
| Hypertension | −3.32 | <.001 | −0.83 | 0.157 | −0.42 | 0.002 | −0.09 | 0.490 | 1.22 | <.001 | 1.10 | 0.061 |
| Time | −0.23 | <.001 | −0.23 | <.001 | −0.02 | 0.002 | −0.02 | 0.007 | 1.01 | 0.084 | 1.01 | 0.029 |
| Hypertension*Time | −0.07 | 0.062 | −0.08 | 0.050 | 0.00 | 0.780 | 0.00 | 0.884 | 1.00 | 0.507 | 1.00 | 0.638 |
| Heart Age6 | −3.41 | <.001 | −1.10 | 0.062 | −0.52 | <.001 | −0.21 | 0.118 | 1.31 | <.001 | 1.18 | 0.001 |
| Time | −0.23 | <.001 | −0.23 | <.001 | −0.02 | 0.004 | −0.02 | 0.009 | 1.01 | 0.068 | 1.01 | 0.064 |
| Heart Age*Time | −0.08 | 0.033 | −0.09 | 0.025 | 0.00 | 0.954 | 0.00 | 0.796 | 1.00 | 0.444 | 1.00 | 0.620 |
Model 1 adjusts for variables shown and age at cognitive baseline (years).
Model 2 adjusts for variables in model 1 as well as covariates considered time-invariant: study site, race/ethnicity, education ≤ high school, physical activity score at cognitive baseline, and time-varying: menopause status, difficulty paying for basics, alcohol use ≥ twice/week, central obesity, and current smoking.
Estimates for East Boston Memory Test represent difference in number of items missed between those without the exposure characteristic compared to those with it. IRR>1.0 represents worse performance on test.
Model 2 for central obesity does not include central obesity as a covariate.
Time is defined as years since cognitive baseline visit.
Model 2 for heart age does not include current smoking as a covariate as smoking is a component of the heart age score.
For SDMT, models indicated a declining trend in processing speed over follow-up, with a mean change of −0.21 to −0.25 points per year in age adjusted models (Model 1; p<0.001). This trend persisted after adjustment for additional covariates (Model 2). In model 1, we observed statistically significant estimates of baseline effects on cognitive performance for central obesity, elevated fasting glucose, diabetes, hypertension, and heart age > chronological age. The largest effect sizes were for diabetes (beta=−5.22), heart age (beta= −3.41), and hypertension (beta=−3.32). Cross-sectional associations were attenuated in model 2, where estimates for diabetes, heart age, and hypertension were each reduced to < −2 points (all p>0.05). In contrast, risk factor by time estimates showed several significant associations of risk factors with rate of decline in processing speed. Women with diabetes or elevated glucose experienced an estimated −0.26 (p<0.010) and −0.15 (p<0.01) faster annual rate of change in SDMT per year, respectively. Greater rates of change were also observed for women with central obesity (−0.09; p=0.01), hypertension (−0.07; p=0.05) and heart age > chronological age (−0.08; p=0.03), and associations persisted after full adjustment (Model 2). Figure 2 illustrates confounder adjusted mean SDMT score over follow-up stratified by risk factor status. Lipid risk factors were not significantly associated with either baseline level or change in SDMT.
Figure 2.
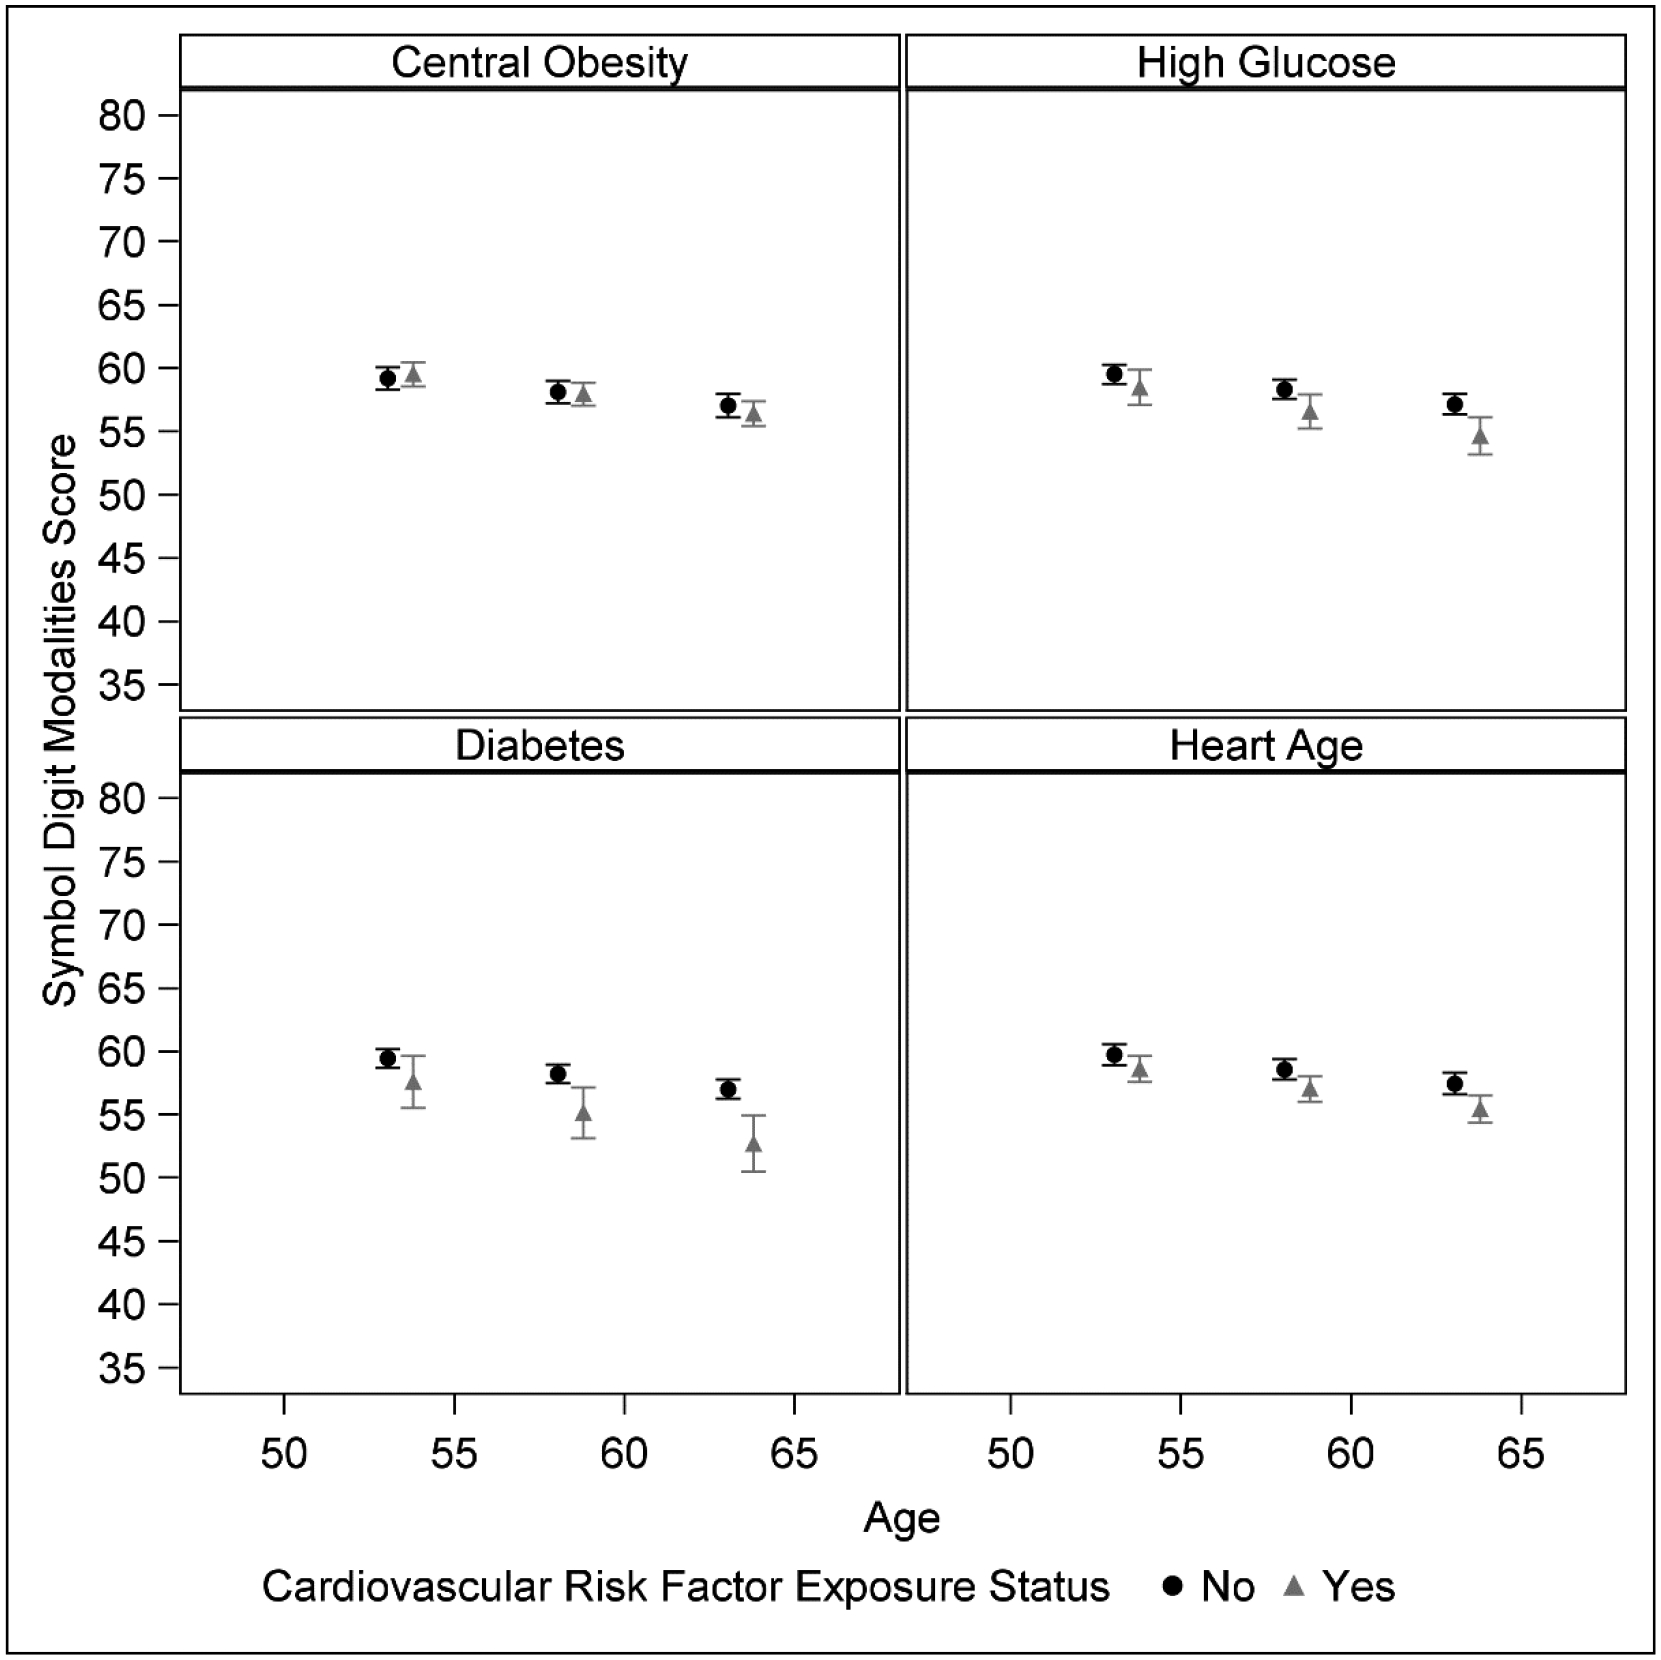
Estimated Mean SDMT Score by CV Exposure Status, Confounder-Adjusted.
n=1139 participants, 5431 total visits
Estimated least squares mean and 95% confidence limits of Symbol Digit Modalities Test (SDMT) score from linear mixed models adjusted for confounders (single measures of: study site, race/ethnicity, education, physical activity score at cognitive baseline, and time-varying measures of: menopausal status, difficulty paying for basics, alcohol use, central obesity, current smoking, length of follow-up, and an interaction term between exposure status and follow-up length). Models estimate mean SDMT value at 0, 5, and 10 years of follow-up from the mean baseline age of 53.4 years. Each panel is stratified by a separate exposure. Black circles indicate participant without that exposure, grey triangles indicate participants with the exposure. Range of the y-axis represents ± 2 standard deviations around baseline mean SDMT score.
Women showed a mean annual decline in working memory, with estimated declines in DSB score ranging from −0.01 to −0.02 points across models (Table 3, column B). The estimates for overall decline remained significant in fully adjusted models (−0.02 ≤beta≤ −0.01, p<0.01), with the exception of central obesity (p=0.114). Baseline associations between DSB and central obesity, high glucose, diabetes, hypertension and heart age > chronological age were attenuated with full adjustment (Table 3, Model 2; p > 0.05). We did not observe risk factor by time interactions, indicating that rate of change in DSB was unrelated to risk factor status (all p > 0.14).
EBMT delayed recall also showed a general pattern of decline over follow-up. Women missed an average of 1.01 times more items (mean ratio (MR) =1.01) per year of follow-up. For a woman who missed two of the twelve EBMT items at cognitive baseline, an MR of 1.01 per year would represent an expected value of 2.19 missed items over 10 years. Baseline effects on delayed recall were observed for central obesity, diabetes and hypertension, but were attenuated in fully adjusted models (Table 3; 0.05≤MR≤1.10, all p >0.06). Women with high glucose missed 1.23 times more items at baseline (p=0.001), and the association persisted after full covariate adjustment (MR=1.17, p=0.012). Heart age> chronological age was associated with 1.31 times more missed items at baseline, adjusted for age (MR=1.31, p<0.001) and 1.18 times (MR=1.18, p=0.001) in the fully adjusted model. None of the risk factors were associated with annual rate of change in delayed recall (0.99≤ MR ≤1.00, all p >0.15). There was no evidence for decline in EBMT immediate recall over follow-up, and no associations with cardiovascular risk factors were observed (results not shown).
DISCUSSION
We observed subtle, but statistically significant declines in processing speed, working memory and delayed recall in the SWAN cohort based on an average of 4.7 cognitive assessments obtained over nearly 10 years during the 6th to 7th decades of life (mean ages: baseline 53.6 ± 2.6 years; follow-up 62.5 ± 5.1 years). Diabetes, elevated fasting glucose, central obesity, and the heart age composite index of cardiovascular risk were associated with annual rate of change in processing speed during midlife. These results align with prior evidence suggesting that diabetes and hypertension are the risk factors with the most consistent associations with cognitive outcomes [35, 36]. We did not observe associations between cardiovascular risk factors and change in working or verbal memory. This agrees with prior work indicating that vascular disease may be more strongly related to processing speed and executive function than with memory [12].
Subtle cognitive changes are detectable years prior to the emergence of clinically recognized cognitive impairment, and brain pathology related to ADRD are detectable 10–20 years prior to emergence of clinical cognitive symptoms [5]. Although the age at which cognitive decline begins has not been established, it may be as early as the 5th decade [37]. Prior work in SWAN has provided evidence for midlife as a critical period when adverse cognitive changes in processing speed and verbal memory are detectable [38]. This analysis confirms these observations over an extended follow-up and also shows a significant midlife decline in working memory.
A number of studies have linked midlife cardiovascular risk factors to cognitive decline or dementia risk. The present analyses extend prior work in two important ways. First, while prior studies have examined the impact of cardiovascular risk factors on cognitive decline during the transition from midlife to late life, fewer have focused on cognitive effects within midlife. Prior studies have begun later, or extended follow-up into the 8th decade when rates of cognitive impairment begin to accelerate. Second, in the majority of studies which are based on only 2–3 cognitive assessments, it is difficult to disentangle learning effects from estimates of cognitive decline. The present analysis examined cognitive change based on a relatively large number of cognitive assessments (4.7) that all occurred after the point in follow-up where learning effects are diminished in the SWAN cohort. [17]
Studies in older adults have demonstrated increased dementia risk among persons with diabetes [39], hyperinsulinemia [40] or hyperglycemia [41]. Fewer studies have examined these relationships in individuals younger than age 65, and longitudinal studies are particularly lacking [42]. Among postmenopausal women, greater cognitive decline and dementia risk have been associated with elevated glucose levels in the pre-diabetes range [41]. Midlife diabetes has been associated with rates of cognitive decline over 10–12 years in the Whitehall II [14], and Maastricht Aging [43] studies, and over 20 years in the ARIC cohort [44]. We extend these findings to a cohort with follow-up over a younger range with multiple midlife cognitive assessments. With respect to age, our results are most similar to observations from the ARIC cohort where diabetes predicted cognitive decline beginning at ages 47–57 years [12]. Our results agree with prior work showing stronger associations between diabetes or glucose level with processing speed rather than with memory [12,41,44]. A recent meta-analysis focused on the relation of type II diabetes to cognition before age 65 and found that processing speed was particularly affected, with greater effect sizes at younger ages [42].
Midlife hypertension has been associated with late life cognitive function and dementia [6,8], and with lower brain weight and increased Alzheimer’s pathology at autopsy [45]. However, the age at which blood pressure begins to impact cognition is unknown. In the ARIC cohort, hypertension and SBP level were associated with decline in processing speed only among those over age 58 [12]. The Maine-Syracuse Longitudinal Study of Aging has reported that hypertension in adults as young 18–47 years predicts 20-year cognitive decline, although only for verbal fluency [46].
Prior findings regarding the association of midlife obesity with cognition and dementia risk have been inconsistent [47]. Inconsistencies may be due to differences in defining obesity, with some suggesting that central obesity may be better a predictor of cognitive outcomes than is BMI [48,49]. We observed an association between central adiposity, defined by waist circumference, and midlife decline in processing speed. This agrees with findings from Framingham showing an inverse association between midlife waist to hip ratio and cognitive performance 12 years later, specifically for executive function [49].
Whether adverse lipid levels in midlife predict later life cognitive decline has not been consistently shown [50]. Adverse levels of LDL, triglycerides or HDL in midlife were not associated with midlife cognitive decline in the SWAN cohort.
Composite cardiovascular risk scores have been developed to quantify the joint effects of multiple risk factors. The Framingham general cardiovascular risk score and heart age predict transitions from mild cognitive impairment to dementia [51] and are associated with elevated cerebrospinal fluid biomarkers of amyloid and tau [52]. Cross-sectional analyses show an association between higher Framingham risk score and worse cognitive function in individuals as young as 35–44 years [10], and report. that that favorable cardiovascular health behaviors during young adulthood and midlife are associated with better midlife cognitive performance [11]. Notably few studies have examined Framingham risk score in relation to midlife cognitive change. An exception is the Whitehall II study, in which midlife Framingham score (mean age 55.6 years) predicted 10-year rate of cognitive decline [53]. Similarly, the present results suggest that elevated heart age may identify women at risk for cognitive decline even during midlife.
The current analysis has several limitations. Multiple associations were tested, increasing the possibility of chance findings. Results showed a consistent pattern of associations between indices of impaired glucose metabolism and hypertension with processing speed. However, sensitivity to early cognitive change may not be equivalent for the cognitive tests examined. SDMT showed the largest annual decline and thus, our ability to identify factors associated with change may be greater for processing speed. Our ability to identify factors associated with change in verbal memory may have been limited, as the EBMT demonstrates ceiling effects in SWAN. Further, the present analyses may underestimate the impact of cardiovascular risk, as excluded women had higher risk factor prevalence.
Our results suggest multiple areas for further research. First, a strength of the analysis is that SWAN is a multiethnic cohort from seven regions of the US designed to be nationally generalizable. Sensitivity analyses which tested interactions by race/ethnicity did not suggest that the observed effects varied by race/ethnic group. However, future work is required to examine associations within groups. Second, ApoE genotype modifies associations between cardiovascular risk indicators and cognitive outcomes but is not available in SWAN. Future work is needed to explore whether ApoE moderates the observed associations. Similarly, work is needed to clarify whether white matter hyperintensities mediate associations between cardiovascular risk factors and cognition. Finally, our analysis considered only baseline risk status. Further work is necessary to explore the cumulative impact of cardiovascular risk on cognitive decline from midlife into early old age.
Dementia is a multifactorial condition, with vascular disease is present in the majority of cases. Whether vascular disease impacts ADRD risk via direct effects on neurodegeneration is not established. Regardless, vascular disease exacerbates the clinical manifestations of AD pathology [54]. The FINGERS trial, and others suggest that behavioral health interventions, and management of chronic conditions may slow cognitive decline even in older adults [55]. On a population level, small effects on cognitive trajectories in midlife may have a significant impact on the future public health burden of ADRD [1].
The burden of cognitive disability disproportionately affects older women, due to longer life expectancy and higher dementia prevalence versus men [1,9]. Our findings suggest that adverse cognitive effects of hypertension, diabetes and obesity in women may begin in midlife and add to evidence suggesting the need for midlife preventive interventions. This is particularly important given the current epidemic of diabetes and obesity, and the current lack of therapeutic treatments for ADRD.
Research in Context.
Systematic Review: The authors reviewed the literature using traditional sources. While numerous studies have linked midlife cardiovascular risk factors to later life cognitive outcomes, few have examined the relation of these factors to cognitive changes during midlife and these have been limited by lack of multiple repeated cognitive assessments within the midlife period.
Interpretation: Processing speed, working and verbal memory declined significantly in this ethnically diverse sample of women followed from the 6th through 7th decades of life. Diabetes, elevated fasting glucose, central obesity, and heart age greater than chronological age were associated with rate of decline in processing speed, while risk factors were not related to change in working or verbal memory. Control of vascular risk factors in midlife may be critical for preventing or delaying later cognitive impairment.
Future Directions: Future studies are needed to explore the cumulative effects of cardiovascular risk factors and role of risk factor control on midlife cognitive decline.
ACKNOWLEDGEMENTS
The Study of Women’s Health Across the Nation (SWAN) has grant support from the National Institutes of Health (NIH), DHHS, through the National Institute on Aging (NIA), the National Institute of Nursing Research (NINR) and the NIH Office of Research on Women’s Health (ORWH) (Grants U01NR004061; U01AG012505, U01AG012535, U01AG012531, U01AG012539, U01AG012546, U01AG012553, U01AG012554, U01AG012495, U19AG063720), The SWAN Repository (U01AG017719).
This publication was supported in part by the National Center for Research Resources and the National Center for Advancing Translational Sciences, National Institutes of Health, through UCSF-CTSI Grant Number UL1 RR024131.
The content of this manuscript is solely the responsibility of the authors and does not necessarily represent the official views of the NIA, NINR, ORWH or the NIH.
Clinical Centers: University of Michigan, Ann Arbor – Siobán Harlow, PI 2011 – present, MaryFran Sowers, PI 1994–2011; Massachusetts General Hospital, Boston, MA – Joel Finkelstein, PI 1999 – present; Robert Neer, PI 1994 – 1999; Rush University, Rush University Medical Center, Chicago, IL – Howard Kravitz, PI 2009 – present; Lynda Powell, PI 1994 – 2009; University of California, Davis/Kaiser – Ellen Gold, PI; University of California, Los Angeles – Gail Greendale, PI; Albert Einstein College of Medicine, Bronx, NY – Carol Derby, PI 2011 – present, Rachel Wildman, PI 2010 – 2011; Nanette Santoro, PI 2004 – 2010; University of Medicine and Dentistry – New Jersey Medical School, Newark – Gerson Weiss, PI 1994 – 2004; and the University of Pittsburgh, Pittsburgh, PA – Karen Matthews, PI.
NIH Program Office: National Institute on Aging, Bethesda, MD – Chhanda Dutta 2016- present; Winifred Rossi 2012–2016; Sherry Sherman 1994 – 2012; Marcia Ory 1994 – 2001; National Institute of Nursing Research, Bethesda, MD – Program Officers.
Central Laboratory: University of Michigan, Ann Arbor – Daniel McConnell (Central Ligand Assay Satellite Services).
SWAN Repository: University of Michigan, Ann Arbor – Siobán Harlow 2013 - Present; Dan McConnell 2011 – 2013; MaryFran Sowers 2000 – 2011.
Coordinating Center: University of Pittsburgh, Pittsburgh, PA – Maria Mori Brooks, PI 2012 - present; Kim Sutton-Tyrrell, PI 2001 – 2012; New England Research Institutes, Watertown, MA - Sonja McKinlay, PI 1995 – 2001.
Steering Committee: Susan Johnson, Current Chair
Chris Gallagher, Former Chair
We thank the study staff at each site and all the women who participated in SWAN.
Footnotes
Declaration of Interests: none
REFERENCES
- [1].Brookmeyer R, Johnson E, Ziegler-Graham K, Arrighi HM (2007) Forecasting the global burden of Alzheimer’s disease. Alzheimers Dement 3, 186–191. [DOI] [PubMed] [Google Scholar]
- [2].Livingston G, Sommerlad A, Orgeta V, Costafreda SG, Huntley J, Ames D, Ballard C, Banerjee S, Burns A, Cohen-Mansfield J, Cooper C, Fox N, Gitlin LN, Howard R, Kales HC, Larson EB, Ritchie K, Rockwood K, Sampson EL, Samus Q, Schneider LS, Selbæk G, Teri L, Mukadam N (2017) Dementia prevention, intervention, and care. Lancet 390, 2673–2734. [DOI] [PubMed] [Google Scholar]
- [3].Norton S, Matthews FE, Barnes DE, Yaffe K, Brayne C (2014) Potential for primary prevention of Alzheimer’s disease: an analysis of population-based data. Lancet Neurol 13, 788–794. [DOI] [PubMed] [Google Scholar]
- [4].Barnes DE, Yaffe K (2011) The projected effect of risk factor reduction on Alzheimer’s disease prevalence. Lancet Neurol 10, 819–828. [DOI] [PMC free article] [PubMed] [Google Scholar]
- [5].Sperling RA, Aisen PS, Beckett LA, Bennett DA, Craft S, Fagan AM, Iwatsubo T, Jack CR Jr, Kaye J, Montine TJ, Park DC, Reiman EM, Rowe CC, Siemers E, Stern Y, Yaffe K, Carrillo MC, Thies B, Morrison-Bogorad M, Wagster MV, Phelps CH (2011) Toward defining the preclinical stages of Alzheimer’s disease: recommendations from the National Institute on Aging-Alzheimer’s Association workgroups on diagnostic guidelines for Alzheimer’s disease. Alzheimers Dement 7, 280–292. [DOI] [PMC free article] [PubMed] [Google Scholar]
- [6].Skoog I, Lernfelt B, Landahl S, Palmertz B, Andreasson LA, Nilsson L, Persson G, Oden A, Svanborg A (1996) 15-Year Longitudinal Study of Blood Pressure and Dementia. Lancet 347, 1141–1145. [DOI] [PubMed] [Google Scholar]
- [7].Armstrong NM, Bangen KJ, Au R, Gross AL (2019) Associations Between Midlife (but Not Late-Life) Elevated Coronary Heart Disease Risk and Lower Cognitive Performance: Results From the Framingham Offspring Study. Am J Epidemiol 188, 2175–2187. [DOI] [PMC free article] [PubMed] [Google Scholar]
- [8].Gottesman RF, Albert MS, Alonso A, Coker LH, Coresh J, Davis SM, Deal JA, McKhann GM, Mosley TH, Sharrett AR, Schneider ALC, Windham BG, Wruck LM, Knopman DS (2017) Associations Between Midlife Vascular Risk Factors and 25-Year Incident Dementia in the Atherosclerosis Risk in Communities (ARIC) Cohort. JAMA Neurol 74, 1246–1254. [DOI] [PMC free article] [PubMed] [Google Scholar]
- [9].Goodman RA, Lochner KA, Thambisetty M, Wingo TS, Posner SF, Ling SM (2017) Prevalence of dementia subtypes in United States Medicare fee-for-service beneficiaries, 2011–2013. Alzheimers Dement 13, 28–37. [DOI] [PMC free article] [PubMed] [Google Scholar]
- [10].Joosten H, van Eersel ME, Gansevoort RT, Bilo HJ, Slaets JP, Izaks GJ (2013) Cardiovascular risk profile and cognitive function in young, middle-aged, and elderly subjects. Stroke 44, 1543–1549. [DOI] [PubMed] [Google Scholar]
- [11].Reis JP, Loria CM, Launer LJ, Sidney S, Liu K, Jacobs DR Jr, Zhu N, Lloyd-Jones DM, He K, Yaffe K (2013) Cardiovascular health through young adulthood and cognitive functioning in midlife. Ann Neurol 73, 170–179. [DOI] [PMC free article] [PubMed] [Google Scholar]
- [12].Knopman D, Boland LL, Mosley T, Howard G, Liao D, Szklo M, McGovern P, Folsom AR, Atherosclerosis Risk in Communities (ARIC) Study Investigators (2001) Cardiovascular risk factors and cognitive decline in middle-aged adults. Neurology 56, 42–48. [DOI] [PubMed] [Google Scholar]
- [13].Gottesman RF, Schneider AL, Albert M, Alonso A, Bandeen-Roche K, Coker L, Coresh J, Knopman D, Power MC, Rawlings A, Sharrett AR, Wruck LM, Mosley TH (2014) Midlife hypertension and 20-year cognitive change: the atherosclerosis risk in communities neurocognitive study. JAMA Neurol 71, 1218–1227. [DOI] [PMC free article] [PubMed] [Google Scholar]
- [14].Tuligenga RH, Dugravot A, Tabák AG, Elbaz A, Brunner EJ, Kivimäki M, Singh-Manoux A (2014) Midlife type 2 diabetes and poor glycaemic control as risk factors for cognitive decline in early old age: a post-hoc analysis of the Whitehall II cohort study. Lancet Diabetes Endocrinol 2, 228–235. [DOI] [PMC free article] [PubMed] [Google Scholar]
- [15].Qiu C, von Strauss E, Backman L, Winblad B, Fratiglioni L (2013) Twenty-year changes in dementia occurrence suggest decreasing incidence in central Stockholm, Sweden. Neurology 80, 1888–1894. [DOI] [PubMed] [Google Scholar]
- [16].Sowers MF, Crawford S, Sternfeld B, Morganstein D, Gold EB, Greendale GA, Evans D, Neer R, Matthews K, Sherman S, Lo A, Weiss G, Kelsey J (2000) Design, survey sampling and recruitment methods of SWAN: A multi-center, multi-ethnic, community based cohort study of women and the menopause transition. In Menopause Biology and Pathobiology, Wren J, Lobo RA, Kelsey J, Marcus R, eds. Academic Press, pp. 175–188. [Google Scholar]
- [17].Greendale GA, Huang MH, Wight RG, Seeman T, Luetters C, Avis NE, Johnston J, Karlamangla AS (2009) Effects of the menopause transition and hormone use on cognitive performance in midlife women. Neurology 72, 1850–1857. [DOI] [PMC free article] [PubMed] [Google Scholar]
- [18].McCarrey AC, Resnick SM (2015) Postmenopausal hormone therapy and cognition. Horm Behav 74, 167–172. [DOI] [PMC free article] [PubMed] [Google Scholar]
- [19].Smith A (1982) Symbol DIgit Modalities Test., Los Angeles, CA. [Google Scholar]
- [20].Salthouse TA. The processing-speed theory of adult age differences in cognition. Psychol Rev 1996;103(3):403–28. [DOI] [PubMed] [Google Scholar]
- [21].Albert M, Smith LA, Scherr PA, Taylor JO, Evans DA, Funkenstein HH (1991) Use of brief cognitive tests to identify individuals in the community with clinically diagnosed Alzheimer’s disease. Int J Neurosci 57, 167–178. [DOI] [PubMed] [Google Scholar]
- [22].Matyi JM, Rattinger GB, Schwartz S, Buhusi M, Tschanz JT. Lifetime estrogen exposure and cognition in late life: The Cache County Study. Menopause. 2019:1366–1374. [DOI] [PMC free article] [PubMed] [Google Scholar]
- [23].Psychological C (1997) WAIS_III and WMS-III: Technical Manual., Psychological Corporation/ Harcourt Brace, San Antonio, TX. [Google Scholar]
- [24].Hughes ML, Agrigoroaei S, Jeon M, Bruzzese M, Lachman ME. Change in Cognitive Performance From Midlife Into Old Age: Findings from the Midlife in the United States (MIDUS) Study. J Int Neuropsychol Soc. 2018. Sep:805–820. [DOI] [PMC free article] [PubMed] [Google Scholar]
- [25].WHO (2008) Waist Circumference and Waistihip Ratio: Report of a WHO Expert Consultation, World Health Organization, Geneva, Switzerland. [Google Scholar]
- [26].Chobanian AV, Bakris GL, Black HR, Cushman WC, Green LA, Izzo JL Jr, Jones DW, Materson BJ, Oparil S, Wright JT Jr, Roccella EJ, Joint National Committee on Prevention, Detection, Evaluation, and Treatment of High Blood Pressure. National Heart, Lung, and Blood Institute, National High Blood Pressure Education Program Coordinating Committee (2003) Seventh report of the Joint National Committee on Prevention, Detection, Evaluation, and Treatment of High Blood Pressure. Hypertension 42, 1206–1252. [DOI] [PubMed] [Google Scholar]
- [27].Steiner P, Freidel J, Bremner W, Stein E (1981) Standardization and micromethods for plasma cholesterol, triglyceride and HDL-cholesterol with the lipid clinics’ methodology. J Clin Chem 19, 850. [Google Scholar]
- [28].Warnick GR, Albers JJ (1978) A comprehensive evaluation of the heparin-manganese precipitation procedure for estimating high density lipoprotein cholesterol. J Lipid Res 19, 65–76. [PubMed] [Google Scholar]
- [29].Friedewald WT, Levy RI, Fredrickson DS (1972) Estimation of the concentration of low-density lipoprotein cholesterol in plasma, without use of the preparative ultracentrifuge. Clin Chem 18, 499–502. [PubMed] [Google Scholar]
- [30].Expert Panel on Detection, Evaluation, and Treatment of High Blood Cholesterol in Adults (2001) Executive Summary of The Third Report of The National Cholesterol Education Program (NCEP) Expert Panel on Detection, Evaluation, And Treatment of High Blood Cholesterol In Adults (Adult Treatment Panel III). JAMA 285, 2486–2497. [DOI] [PubMed] [Google Scholar]
- [31].American Diabetes Association (2019) 2. Classification and Diagnosis of Diabetes: Standards of Medical Care in Diabetes-2019. Diabetes Care 42, S13–S28. [DOI] [PubMed] [Google Scholar]
- [32].D’Agostino RB S, Vasan RS, Pencina MJ, Wolf PA, Cobain M, Massaro JM, Kannel WB (2008) General cardiovascular risk profile for use in primary care: the Framingham Heart Study. Circulation 117, 743–753. [DOI] [PubMed] [Google Scholar]
- [33].Sternfeld B, Ainsworth BE, Quesenberry CP (1999) Physical activity patterns in a diverse population of women. Prev Med 28, 313–323. [DOI] [PubMed] [Google Scholar]
- [34].Lezak MD, Howieson DB, Tranel D. Neuropsychological assessment. 5th ed. Oxford University Press; 2012. [Google Scholar]
- [35].Bondi MW, Edmonds EC, Salmon DP (2017) Alzheimer’s Disease: Past, Present, and Future. J Int Neuropsychol Soc 23, 818–831. [DOI] [PMC free article] [PubMed] [Google Scholar]
- [36].James BD, Bennett DA (2019) Causes and Patterns of Dementia: An Update in the Era of Redefining Alzheimer’s Disease. Annu Rev Public Health 40, 65–84. [DOI] [PubMed] [Google Scholar]
- [37].Singh-Manoux A, Kivimaki M, Glymour MM, Elbaz A, Berr C, Ebmeier KP, Ferrie JE, Dugravot A (2012) Timing of onset of cognitive decline: results from Whitehall II prospective cohort study. BMJ 344, d7622. [DOI] [PMC free article] [PubMed] [Google Scholar]
- [38].Karlamangla AS, Lachman ME, Han W, Huang M, Greendale GA (2017) Evidence for Cognitive Aging in Midlife Women: Study of Women’s Health Across the Nation. PLoS One 12, e0169008. [DOI] [PMC free article] [PubMed] [Google Scholar]
- [39].Biessels GJ, Staekenborg S, Brunner E, Brayne C, Scheltens P (2006) Risk of dementia in diabetes mellitus: a systematic review. Lancet Neurol 5, 64–74. [DOI] [PubMed] [Google Scholar]
- [40].Luchsinger JA, Tang MX, Shea S, Mayeux R (2004) Hyperinsulinemia and risk of Alzheimer disease. Neurology 63, 1187–1192. [DOI] [PubMed] [Google Scholar]
- [41].Yaffe K, Blackwell T, Kanaya AM, Davidowitz N, Barrett-Connor E, Krueger K (2004) Diabetes, impaired fasting glucose, and development of cognitive impairment in older women. Neurology 63, 658–663. [DOI] [PubMed] [Google Scholar]
- [42].Pelimanni E, Jehkonen M (2018) Type 2 Diabetes and Cognitive Functions in Middle Age: A Meta-Analysis. J Int Neuropsychol Soc, 1–16. [DOI] [PubMed] [Google Scholar]
- [43].Spauwen PJ, Köhler S, Verhey FR, Stehouwer CD, van Boxtel MP (2013) Effects of type 2 diabetes on 12-year cognitive change: results from the Maastricht Aging Study. Diabetes Care 36, 1554–1561. [DOI] [PMC free article] [PubMed] [Google Scholar]
- [44].Rawlings AM, Sharrett AR, Schneider AL, Coresh J, Albert M, Couper D, Griswold M, Gottesman RF, Wagenknecht LE, Windham BG, Selvin E (2014) Diabetes in midlife and cognitive change over 20 years: a cohort study. Ann Intern Med 161, 785–793. [DOI] [PMC free article] [PubMed] [Google Scholar]
- [45].Petrovitch H, White LR, Izmirilian G, Ross GW, Havlik RJ, Markesbery W, Nelson J, Davis DG, Hardman J, Foley DJ, Launer LJ (2000) Midlife blood pressure and neuritic plaques, neurofibrillary tangles, and brain weight at death: the HAAS. Honolulu-Asia aging Study. Neurobiol Aging 21, 57–62. [DOI] [PubMed] [Google Scholar]
- [46].Elias PK, Elias MF, Robbins MA, Budge MM (2004) Blood pressure-related cognitive decline: does age make a difference? Hypertension 44, 631–636. [DOI] [PubMed] [Google Scholar]
- [47].Hartanto A, Yong JC, Toh WX (2019) Bidirectional Associations between Obesity and Cognitive Function in Midlife Adults: A Longitudinal Study. Nutrients 11, 2343. doi: 10.3390/nu11102343. [DOI] [PMC free article] [PubMed] [Google Scholar]
- [48].Hartanto A, Yong JC (2018) Measurement matters: higher waist-to-hip ratio but not body mass index is associated with deficits in executive functions and episodic memory. PeerJ 6, e5624. [DOI] [PMC free article] [PubMed] [Google Scholar]
- [49].Wolf PA, Beiser A, Elias MF, Au R, Vasan RS, Seshadri S (2007) Relation of obesity to cognitive function: importance of central obesity and synergistic influence of concomitant hypertension. The Framingham Heart Study. Curr Alzheimer Res 4, 111–116. [DOI] [PubMed] [Google Scholar]
- [50].Anstey KJ, Ashby-Mitchell K, Peters R (2017) Updating the Evidence on the Association between Serum Cholesterol and Risk of Late-Life Dementia: Review and Meta-Analysis. J Alzheimers Dis 56, 215–228. [DOI] [PMC free article] [PubMed] [Google Scholar]
- [51].Viticchi G, Falsetti L, Buratti L, Sajeva G, Luzzi S, Bartolini M, Provinciali L, Silvestrini M (2017) Framingham Risk Score and the Risk of Progression from Mild Cognitive Impairment to Dementia. J Alzheimers Dis 59, 67–75. [DOI] [PubMed] [Google Scholar]
- [52].Bos I, Vos SJB, Schindler SE, Hassenstab J, Xiong C, Grant E, Verhey F, Morris JC, Visser PJ, Fagan AM (2019) Vascular risk factors are associated with longitudinal changes in cerebrospinal fluid tau markers and cognition in preclinical Alzheimer’s disease. Alzheimers Dement 15, 1149–1159. [DOI] [PMC free article] [PubMed] [Google Scholar]
- [53].Kaffashian S, Dugravot A, Elbaz A, Shipley MJ, Sabia S, Kivimäki M, Singh-Manoux A (2013) Predicting cognitive decline: a dementia risk score vs. the Framingham vascular risk scores. Neurology 80, 1300–1306. [DOI] [PMC free article] [PubMed] [Google Scholar]
- [54].Chui HC, Zarow C, Mack WJ, Ellis WG, Zheng L, Jagust WJ, Mungas D, Reed BR, Kramer JH, Decarli CC, Weiner MW, Vinters HV (2006) Cognitive impact of subcortical vascular and Alzheimer’s disease pathology. Ann Neurol 60, 677–687. [DOI] [PMC free article] [PubMed] [Google Scholar]
- [55].Kivipelto M, Mangialasche F, Ngandu T (2018) Lifestyle interventions to prevent cognitive impairment, dementia and Alzheimer disease. Nat Rev Neurol 14, 653–666. [DOI] [PubMed] [Google Scholar]