

Abstract
Neurotransmitters play essential roles in regulating neural circuit dynamics both in the central nervous system as well as at the peripheral, including the gastrointestinal tract1–3. Their real-time monitoring will offer critical information for understanding neural function and diagnosing disease1–3. However, bioelectronic tools to monitor the dynamics of neurotransmitters in vivo, especially in the enteric nervous systems, are underdeveloped. This is mainly due to the limited availability of biosensing tools that are capable of probing soft, complex, and actively moving organs. Here, we introduce a tissue-mimicking, stretchable neurochemical biointerface termed NeuroString, which is prepared by laser-patterning of a metal-complexed polyimide into an interconnected graphene/nanoparticle network embedded in an elastomer. NeuroString sensors allow chronic in vivo real-time, multichannel and multiplexed monoamine sensing in the brain of behaving mouse, as well as measuring serotonin dynamics in the gut without undesired stimulations and perturbing peristaltic movements. The described elastic and conformable biosensing interface has broad potential for studying the impact of neurotransmitters on gut microbes, brain-gut communication, and may ultimately be extended to biomolecular sensing in other soft organs across the body.
Soft tissues and organs in the human body are highly active biochemical systems that include biomolecules, such as neurotransmitters and hormones, precisely controlling various biological processes. Monitoring the dynamics of neurotransmitters is essential to understanding the communication between neurons and their targets, and to develop therapeutic neuromodulatory strategies1–3. In the central nervous system (CNS), monoamines, including dopamine (DA) and serotonin (5-HT), are involved in the regulation of cognitive processes such as emotion, arousal, and memory4,5. Dysregulated monoamine signaling is a common feature of many psychiatric and neurological disorders, including addiction, major depressive disorder, and Parkinson’s disease6–8. Outside the CNS, 5-HT in the gastrointestinal (GI) system accounts for 95% of the body’s 5-HT and closely regulates gut function and microbiota, serving as an important component of the gut-brain communication system8–10. Therefore, there is significant interest to monitor the dynamics of monoamines in both the CNS and the GI system.
Nevertheless, the tools for studying biochemical signaling in vivo remain limited. The recent development of genetically encoded fluorescence sensors offered many advantages in terms of sensitivity, selectivity, and fast dynamics1,11,12. Alternatively, analytical voltammetry method offers great potential for clinical bioelectronics use as it’s universally applicable for wildtype animals without transgenic modification13,14,15,16,17, and has been adopted to study the monoamine dynamics in human participants18,19. The recent advances of neural probes and bioelectronics have primarily focused on developing soft or miniaturized electrophysiological devices20–25. However, current probes for voltammetry neurotransmitter sensing mostly relies on silica encapsulated carbon fiber electrodes, which are rigid and brittle, and possess limited tunability of sensing functions17. These rigid probes might lead to early device failure or severe inflammatory response as the brain is undergoing constant motion and deformation due to the cardiorespiratory cycles and body movements26–28. Similarly, the GI tract is made of a series of soft, long, and twisting organs with a variety of motility patterns (peristaltic or non-peristaltic) and abundant mechanoreceptors29,30. Performing high-fidelity electrical or optical measurements of 5-HT dynamics in an actively moving GI tract has been a long-standing challenge31,32.
Here, we introduce a soft and stretchable graphene-based biosensing neural interface, termed “NeuroString” to seamlessly interface with CNS and GI tissue and enable real-time simultaneous monitoring of monoamine dynamics in both tissues (Figs. 1a–d). Graphene was selected as the electrode material due to its good biocompatibility, high super-capacitive response during fast-scan cyclic voltammetry (FSCV), known catalytic activity towards amine oxidation32,33, as well as high mechanical compliance in bending, stretching and twisting because of its atomic-level thickness. However, graphene monolayer cracks at less than 5% strain34. We address this issue by embedding laser-induced graphene nanofiber networks, with transition metal nanoparticles decorated on the surface, into a polystyrene-block-poly(ethylene-ran-butylene)-block-polystyrene (SEBS) elastomer matrix to achieve high levels of softness and stretchability while preserving the unique electrochemical properties of the nanomaterials (Fig. 1a).
Fig. 1: NeuroString for sensing neurotransmitters in the brain and gut.
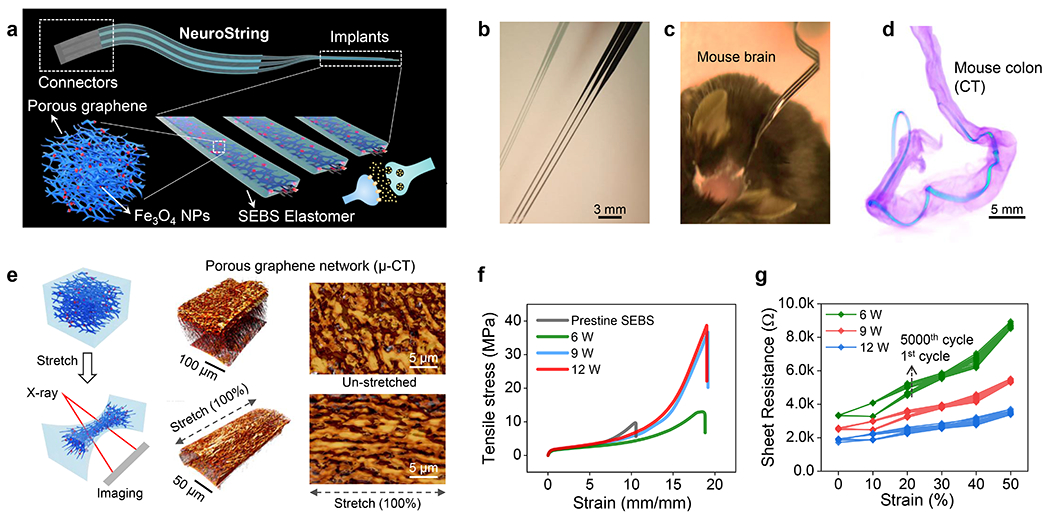
(a) Schematic of the soft implant for sensing neurotransmitter in the brain and a 3D schematic showing the composite materials made by confining nanoscale graphene/iron oxide nanoparticle networks in an elastomer (SEBS) to construct a soft, sensitive, and selective neurochemical sensor. (b) A stretched 3-channel NeuroString with each channel for sensing brain neurotransmitter separately. (c) NeuroString chronically implanted in a mouse. (d) ex vivo X-ray computed tomography showing a NeuroString placed in the mouse colon. (e) Left: schematic setup for in situ characterization of the graphene mesostructure under strain. Middle: X-ray tomography 3D reconstruction of the graphene-elastomer composite showing the mesostructure of the graphene nanofiber networks at 0% (upper) and 100% (bottom) strain, respectively. Right: corresponding top-view of the graphene tomography. The μ-CT scan results were repeated and reproduced for 3 times. (f) Tensile stress-strain behavior of the graphene/elastomer composites prepared by different laser power. (g) Sheet resistance of the graphene/elastomer composites prepared by different laser power under different strains and stretching cycles (strain from 0% to 50% for 5000 cycles, data showing the sheet resistance of the 1st, 1000th, 2000th, 3000th, 4000th and 5000th stretching cycles).
Two separate fabrication processes were developed for devices used in CNS and GI, respectively (Extended Data Fig. 1). Transition metal nanoparticles (such as Fe3O4 or NiO nanoparticles) are known to promote molecular absorption and electron transfer to catalytically enhance the selectivity and sensitivity for monoamine sensing35–37. We therefore incorporated metalloporphyrin, 5,10,15,20-tetrakis-(4’-aminophenyl) iron (III) porphyrin chloride or 5,10,15,20-tetrakis-(4’-aminophenyl) nickel (II) porphyrin, into polyamic acid polymer as a precursor to produce nanoparticle-modified graphene networks through the laser carbonization process. Scanning electron microscope (SEM) images show that the laser carbonization process produced dense and interconnected graphene nanofibers with a resolution of 50-100 μm (Supplementary Figs. S2a–d). High-resolution transmission electron microscope (HRTEM) images of the laser-induced graphene show the characteristic 0.34 nm d- spacing (Extended Data Fig. 2e), while the Raman spectroscopy indicates that higher laser power produced more defects on the graphene (Extended Data Fig. 2f). The presence of nanoparticles (Fe3O4 and NiO) in the graphene network produced by the laser engraving process is confirmed by electron energy loss spectroscopy (EELS) and HRTEM (Extended Data Fig. 3). The desired electrochemical properties, combined with the rapid laser patterning and the ease of transfer process enabled by SEBS, result in a versatile materials platform with high stretchability and rapid fabrication of arbitrary patterns (Supplementary Fig. S1).
As shown in Fig. 1b, the NeuroString developed for brain implantation is soft, elastic, thin and long strings to minimize tissue damage, while that for the gut is on a single thin and elastic film to facilitate device operation and measurements over a much longer distance and a larger degree of movement (Supplementary Fig. S1). The patterned graphene-elastomer composite and the fabricated NeuroStrings can be easily stretched, twisted, even knotted (Supplementary Fig. S1). The NeuroString implanted in a mouse brain was rigidified using pullulan coating to assist the implantation (Fig. 1c, the coating dissolves after implantation). The compatibility of NeuroStrings with soft organs is demonstrated by the highly flexible NeuroString non-invasively accesses to the twisting colon of a mouse as shown in a micro-computed tomography (μ-CT) image (Fig. 1d).
We first studied the deformation mechanism of the graphene-elastomer composite. μ-CT revealed that the graphene nanofibers still maintained an interconnected 3D network after being transferred and embedded into the SEBS elastomer (Fig. 1e). When stretched to 100% strain, the graphene nanofiber network became aligned along the stretching direction which may help to maintain the conductive pathways. We then characterized the stretchability of the freestanding composite made by different laser power levels. Generally, a higher laser power led to an increase of graphene loading in the elastomer as a thicker layer of polymer became carbonized (Supplementary Fig. S1). The tensile stress measurement in Fig. 1f shows that the graphene-elastomer composites exhibit a much higher strain to failure (>1700%) compared to the neat SEBS elastomer. Graphene was reported to increase Young’s modulus when added in epoxy34, but the graphene-in-elastomer composite showed a slightly decreased Young’s modulus compared with that of the neat elastomer. In addition, the sheet resistance of the composite under 50% strain is stable with a <200% change for products from all the laser powers (Fig. 1g, composite thickness: 50, 90, and 150 μm for the laser power 6, 9, and 12 W, respectively). NeuroStrings, which were produced with a laser power of 6W to give a layer of graphene nanofiber with a thickness of ~50-80 μm, were used in our following studies.
Next, we examined the electrochemical properties of the NeuroString electrodes. In vitro cyclic voltammetry measurements in the presence of both DA and 5-HT indicates that the graphene electrode decorated with Fe3O4 nanoparticles has the best selectivity and sensitivity to distinguish DA and 5-HT compared to the electrodes made by only graphene, graphene with NiO nanoparticles, and commercial carbon fibers (Fig. 2a and Extended Data Fig. 4). As only the cross-section of the graphene is used as sensing electrode (inset in Fig. 2b), we observed that stretching the device along different directions has minimum effect on the electrode impedance (<1000 Hz), revealed by a stable baseline under strain (Fig. S6). Similarly, the impedance of the NeuroString electrode was stable after being fabricated into arrays or under various pH (Supplementary Fig. S2). The NeuroString electrode also showed a stable oxidation current with a <10% decrease in amplitude when stretched to 50% strain (Fig. 2c), which afford stable and accurate monitoring of neurochemical dynamics in actively moving tissues and organs. NeuroString can sense multiple monoamine neurotransmitters, including DA, norepinephrine (NP), 5-HT, and epinephrine (EP), with a FSCV detection limit of 5.6 nM, 7.2 nM, 3.5 nM, and 6.6 nM, respectively (3 times the standard deviation of the noise). A linear response curve ranging from 10 nM to 1 μM, and a relatively stable current response across different pH are observed (Figs. 2c–e and Extended Data Figs. 4e–f). The linearity of FSCV sensing starts to decrease for concentrations above 1 μM, while chronoamperometry shows a better linearity for 5-HT sensing at the μM range (Extended Data Fig. 4g). NeuroString also allows simultaneous sensing of 5-HT and other catecholamines (norepinephrine and epinephrine) with a selectivity in the sub-μM range (Extended Data Figs. 4h–i). Autoclave (121°C) sterilization has a minimal effect on its sensory performance, which facilitated its in vivo usage (Supplementary Fig. S2).
Fig. 2: Electrochemical sensing performance of NeuroString electrode in solution.

(a) Comparison of the selectivity of different graphene electrodes (made of graphene with Fe3O4 nanoparticles, graphene with NiO nanoparticles, and graphene only) and carbon fiber electrodes for simultaneously sensing DA and 5-HT using cyclic voltammetry (the individual voltammogram are shown in Extended Data Fig. 4d). Error bars are obtained from n=6 different NeuroString electrodes examined in independent measurement. (b) X-ray tomography 3D reconstruction showing the cross-section of the NeuroString electrode as the sensing area. (c) Stable oxidation current peak of the electrodes, made by graphene with Fe3O4 nanoparticles, under different strains. The cyclic voltammetry is performed in a solution with 500 nM DA and 500 nM 5-HT in phosphate-buffered saline (PBS) buffer (pH 7.4) with a scan rate of 10 V/s (n=6 electrodes). (d-e) Concentration-dependent calibration response of NeuroString electrode to DA, epinephrine, norepinephrine, and 5-HT ranging from 10 to 200 nM in PBS buffer (pH 7.4) with a scan rate of 400 V/s (Error bars are obtained from n=6 different NeuroString electrodes examined in independent measurement). (f) The current response to 100 nM analytes in PBS with different pH values (2, 4, 6, 7.4 and 10) with a scan rate of 400 V/s (Error bars are obtained from n=6 different NeuroString electrodes examined in independent measurement).
Next, we used the NeuroString to monitor neurotransmitter dynamics in vivo in the mouse brain. The nucleus accumbens (NAc) is one of the major regions receiving projections from DA neurons in the ventral tegmental area (VTA). We stereotaxically injected Cre-dependent adeno-associated virus (AAV-DIO-ChR2) into the VTA of DAT-Cre mice to express light-sensitive channelorohopsin-2 (ChR2) specifically in DA neurons, and implanted a 3-channel NeuroString sensor (90×50 μm2 in size) in the NAc and an optic fiber in the VTA for optogenetic stimulation (Fig. 3a). Using fast-FSCV (triangle waveform scanning from −0.4V to 1.3V), we achieved multiple-channel DA sensing in the NAc after delivering laser stimulus in the VTA (Figs. 3b–c). The peak of DA release ([DA]max) under different stimulation frequency was also examined (Figs. 3d–e). Fast detection of phasic DA release was achieved after repeated opto-stimulation (Fig. 3f), suggesting the sub-second temporal resolution of NeuroString. To test the NeuroString’s capacity to sense behaviorally relevant endogenous DA release in freely moving animals, we implanted the NeuroString in the mouse NAc to measure the DA dynamics during reward learning and fear extinction. For the rewarding learning experiments, freely moving mice were trained to associate an auditory cue with a water ensuing reward (Figs. 3g–l). On the first training day (day 1), the NeuroString detected DA release triggered by the reward itself but not reward-predicting cue (Fig. 3l). After 3 days of training, the mice can gradually associate the cue with the reward and a reward-predictive cue evoked DA release developed. We also subjected the mice to fear conditioning and extinction training using two different custom-made chambers inside a sound attenuating box. Accompanied with the change of animal freezing levels across association and extinction phase, we found that dopamine release increased after acute footshock during the conditioning phase and also at the end of tone during the early extinction phase by NeuroString recording (Extended Data Fig. 5a–d), consistent with the role of dopamine signal in reinforcing and extinction learning38.
Fig. 3: Neurochemical sensing in the brain.

(a) Schematic of dopamine sensing in the NAc by NeuroString sensor while optogenetically stimulating VTA dopaminergic neurons. (b) Representative curves of estimated DA concentration versus time and (c) corresponding background-subtracted color plots measured from a 3-channel NeuroString through optogenetic stimulation (20 Hz with 15 pulses). (d) Representative traces of phasic DA release traces in the NAc under different stimulation frequency (15 pulses). (e) Calibrated DA peak concentration evoked by stimulation using different frequencies (n=6 mice); (f) Representative trace of phasic DA release under repetitive stimulation (20 Hz, 15 pulses). (g) Experimental paradigm for a Pavlovian rewarding learning task in freely-moving mice. (h) Representative lick raster plots from example mouse across nine conditioning sessions (upper), and corresponding average lick rate across nine conditioning sessions (lower). (i-j) Exemplar time-aligned DA signals from a mouse in (i) naive and (j) trained sessions. (k-l) Group analysis of DA responses to (k) unconditioned stimulus (water) and (l) and conditioned stimulus (auditory cue) across trainings (n=6 mice). P values: water: 0.3898 (day 3), 0.2425 (day 6), and 0.8826 (day 9); auditory cue: 0.0002 (day 3); 0.0001 (day 6), and 0.0004 (day 9). (m) Schematics showing the serotonin measurements in the BLA with optogenetic stimulation using SERT-Cre mouse. (n) Estimated [5-HT]max evoked by 15 pulse stimulation trains applied at 5, 20, and 100 Hz (n=6 mice). (o-p) Representative color plots showing 5-HT release evoked in BLN by a 20 Hz, 15 pulses dorsal raphe nucleus (DRN) stimulation (o) before SSRI injection and (p) 30 min after SSRI injection (10 mg/kg). (q) Averaged concentration trace showing 5-HT release evoked by 20 Hz stimulation at baseline (blue line) and 30 min after SSRI (fluoxetine, red line) injection. (r) Comparison of average clearance half-time t1/2 at baseline and 30 min after SSRI injection (n=6 mice), P value: 0.0005. (s) Schematics showing NeuroString in striatum for measuring CAT and 5-HT co-release. (t) Representative color plot (upper) and the corresponding estimated concentrations (lower) of CAT and 5-HT measured by NeuroString after administration of cocaine (15 mg/kg) + 5-HTP (15 mg/kg). (u) Representative color plot (upper) and the corresponding estimated concentrations (lower) of CAT and 5-HT measured by NeuroString after administration of cocaine (15 mg/kg) + 5-HTP (15 mg/kg) + SSRI (10 mg/kg). (v) Representative cyclic voltammograms for detecting DA and 5-HT in the NAc after 30 min administration of cocaine (15 mg/kg) + 5-HTP (15 mg/kg) + SSRI (10 mg/kg). (w) Comparison of average 5-HT clearance half-time t1/2 at baseline and 30 min after SSRI injection (n=6 mice). P value: 0.000079. (x) Comparison of average catecholamine clearance half-time t1/2 at baseline and 30 min after SSRI injection (n=6 mice), P value: 0.7930. P values are calculated by paired two-tailed Student’s t-test: ns P > 0.05; *P ≤ 0.05; **P ≤ 0.01; ***P ≤ 0.001.
Next, we used optogenetic methods to activate the dorsal raphe nucleus (DRN) neurons and used the NeuroString to measure the optically stimulated 5-HT response in the basolateral amygdala (BLA) of the SERT-Cre mice (Fig. 3m). The peak amplitude of 5-HT release [5-HT]max can be enhanced with the frequency of photostimulation (Fig. 3n). Relative to baseline controls, systemic administration of fluoxetine, a selective serotonin reuptake inhibitor (SSRI), significantly increased the clearance half-time of 5-HT (Figs. 3 o–r).
We then used the NeuroString to examine the release of neurotransmitters induced by pharmacological compounds (Fig. 3s). We first performed ex vivo recording on acute brain slice to study the response of the catecholamine (CAT) and 5-HT under various drug stimulation including cocaine, amphetamine, 5-HTP, fluoxetine. A concentric bipolar cluster microelectrode and a NeuroString electrode were positioned into the ventral striatum for electrical stimulation and neurochemical sensing, respectively. NeuroString detected the electrical stimulation evoked phasic catecholamine release with increased amplitude and duration by both cocaine and amphetamine, while the 5-HT signal was selectively enhanced by 5-HTP and fluoxetine application (Supplementary Fig. S3). We then examined the release of catecholamine and 5-HT at ventral striatum evoked by intraperitoneal (i.p) injection of cocaine and 5-HTP in living mice. Two oxidation peaks in the color plot recorded by NeuroString suggested the release of both DA and 5-HT after co-administration of cocaine and 5-HTP (Figs. 3t). To further confirm the specificity, we injected fluoxetine after 5-HTP + cocaine co-injection, and observed that the clearance time of 5-HT was selectively modified by the fluoxetine (Figs. 3u–x).
Chronic implantation and optogenetic probing showed that NeuroString can achieve reproducible DA signals evoked by optogenetic stimulation up to 16 weeks, demonstrated exceptional stability for long-term in vivo neurochemical sensing (Extended Data Fig. 5e–g). Immunohistology against the microglia marker Iba-1 (ionized calcium-binding adapter molecule) and astrocyte marker GFAP (glial fibrillary acidic protein) showed that the soft NeuroString induced only slight elevation of GFAP and minimal overexpression of Iba-1 (Supplementary Fig. S4). The GFAP and Iba-1 signals were significantly lower than that caused by rigid silica fiber control (100 μm diameter), which is commonly used to encapsulate conventional carbon fiber electrodes. Together, these results indicated that the soft NeuroString displayed better biocompatibility and evoked less adverse tissue response compared to conventional rigid probes.
In addition to neurochemical sensing in the CNS, NeuroString is uniquely suited for in vivo neurochemical sensing in the GI. 5-HT is an essential gut signaling molecule that contributes to the activation of intrinsic and extrinsic GI reflexes and has a major effect on the microbiota29 (Fig. 4a). In previous works, carbon fibers were able to measure the luminal or mucosal surface serotonin release and uptake of rodent intestine, which was usually dissected and pinned flat on a surface39,40. To study the 5-HT dynamics in active intestine, we first verified the mechanical compliance of the NeuroString in mouse intestine under ex vivo peristalsis motion. Whole mice colon tissue without content was placed into a Krebs-filled bath. Fig. 4b shows that the NeuroString can readily interface with and attach to the mucosa of mouse colon as both the SEBS and the colon mucosa are soft and hydrophobic. Time-lapse images (Fig. 4c) showed that the mouse colon exhibited continuous contraction and relaxation when a NeuroString was placed in the lumen during electrochemical measurement (Supplementary Video S1). The colonic motility assay (Extended Data Fig. 6 and Supplementary Video S2) indicated that placing a NeuroString (2 cm × 800 μm × 120 μm) in a mouse colon did not induce latency of the myoelectric slow-wave-induced mechanical contractions and colonic migrating motor complexes (CMMCs). In contrast, placing a flexible (but not stretchable) polyimide fiber with the same dimension in the colon lumen delayed both the CMMCs and slow-wave-induced contractions, most likely due to the modulus mismatch and lack of stretchability (Figs. 4d–f). Behaviorally, the presence of the NeuroString in the colon did not affect the mobility of mice in the open field assay or the fecal output (Extended Data Fig. 6). In contrast, the flexible polyimide control dramatically reduced the mouse activity and fecal output. Hematoxylin and eosin (H&E) staining also showed that NeuroString electrodes induced minimal tissue damage, while placing a polyimide fiber in the colon led to damages of the mucosa layer (Extended Data Fig. 6).
Fig. 4: Neurochemical sensing in the GI system.

(a) Scheme showing 5-HT being released by the EC cell on the intestinal epithelium layer. (b) Ex vivo image showing that the NeuroString can conform to the mucosa of mouse colon. (c) Time-lapse images showing contraction and relaxation of the mouse colon during the neurochemical measurement. (d) Representative spatiotemporal maps of colonic migrating motor complex (CMMC). Control data was obtained using a colonic motility assay without a device in the lumen. Spatiotemporal maps indicate the interval between CMMCs (y-axis) at each cross-sectional diameter (x-axis) along the colon length. (e) CMMC intervals and (f) Slow-wave-induced contraction intervals mapped by video imaging colonic motility (error bar bands denote ± SD of the measurement results obtained from colons of n=5 biologically independent mice). (g) Ex vivo chronoamperometry measurement of 5-HT concentration and the corresponding displacement (red) of mouse colon undergoing peristalsis motion (potential: + 500mV) using a NeuroString or commercial carbon fibers during the colon contracting motion. (h-i) Representative traces (h) and histogram (i) of temperature increase from 37°C to 34°C evoked 5-HT concentration change in mouse colon measured by NeuroString (n= 6 mice colons, P values: 0.8190, 0.0004, and 0.1806). (j) Mouse colon 5-HT concentration change measured by NeuroString during dextran sulfate sodium (DSS) induced colitis development (n= 4 mice, P values: 0.7348, 0.0073, and 0.0075). Each data point represents an average of 5 measurements within this range at a distance of 0-3 cm from the anus of the mouse. (k) Representative 5-HT concentration mapping of the mouse colon (3 cm from the anus) of a colitis mouse and a healthy mouse. Simultaneous DA and 5-HT measurement using chocolate as reward and nutrition stimulates for mice. (l) Phasic CAT release in the striatum with intake of chocolate (error bar denotes ± SD of the measurement results obtained from n=5 biologically independent mice), measured from striatum, and (m) corresponding 5-HT level changes in the colon over time following intake of chocolate (n= 5 mice). P values are calculated by paired two-tailed Student’s t-test: ns P > 0.05; *P ≤ 0.05; **P ≤ 0.01; ***P ≤ 0.001.
Enterochromaffin (EC) cells locate within the gut epithelia and store the largest pool of 5-HT in the body41. Thus, a significant amount of 5-HT is released from EC cells into the gut lumen in response to various stimuli and can be detected by the NeuroString through electrochemical measurements. The vagal afferents of gut are particularly sensitive to mechanical stimuli due to the abundance of mechanoreceptors in the sensory endings of the GI tract wall to trigger 5-HT release and enhance peristaltic reflexes42. Real-time 5-HT recording using a NeuroString by chronoamperometry showed a stable 5-HT concentration during the peristalsis motion of the colon (Fig. 4g). However, recordings obtained with a commercial carbon fiber indicated obvious mechanically stimulated 5-HT releases during colon movements. This was consistent with a previous study of mechanically stimulated 5-HT release in the gut of the guinea pig43. Interestingly, we also observed that increasing bath temperature from 37°C to 42°C can evoke elevation of 5-HT release in the colon lumen using ex vivo assay (Figs. 4h–i). Taken together, these results confirmed that the mechanical compliance of the NeuroString is uniquely adequate to reduce disruptions to the physiological state of actively moving organs while maintaining high data recording fidelity.
5-HT can act as both pro-inflammatory and anti-inflammatory signaling molecule in the intestinal mucosa via activation of 5-HT receptors44,45. We next explored whether NeuroString can noninvasively monitor the changes of 5-HT levels during the development of GI inflammation in a mouse model of inflammatory bowel disease (IBD). Feeding mice for 10 days with dextran sulfate sodium (DSS) in their drinking water induced acute colitis46, as shown in the H&E staining of the mice colon (Extended Data Fig. 6). Colonic measurements using the NeuroString (acutely placed in the colon lumen during each test) showed elevated 5-HT levels in DSS but not saline-fed mice after 5 days of DSS treatment (Fig. 4k). The increase of 5-HT level for DSS mice was also confirmed by ELISA assay (Extended Data Fig. 6). The increased availability of luminal 5-HT is consistent with the increased number of EC cells associated with inflammation47. By mapping the colon luminal 5-HT using multiple-channel NeuroString, we observed that healthy mice showed a gradual decrease in 5-HT level from the middle to distal colon, while the 5-HT level in mice with colitis lacked such spatial distribution with a much higher concentration level and higher variation due to the colon purulency (Fig. 4k). An average concentration difference of ~6% was also observed between different channels, indicating the local 5-HT heterogeneity. These results indicate that 5-HT can serve as a biomarker for gut inflammation, while the integration of the NeuroString can be used for IBD diagnosis and studying the gut chemistry in human. The flexibility of the NeuroString allows it to be wrapped on an endoscope to enable rapid mapping of the colon 5-HT by navigating the endoscope working channel while performing electrochemical sensing in a rat model (Extended Data Fig. 6 f–g).
We also performed experiments of using NeuroString to measure the kinetics of intestine luminal 5-HT in a pig model through acute experiments. Multi-channel NeuroString can simultaneously measure different segment of the GI tract. We also examined drug-induced 5-HT release in the pig model and found that a cocktail drug of fluoxetine (SSRI) and methylene blue (MB, a monoamine oxidase inhibitor) led to 5-HT concentration increase in living miniature pigs (Extended Data Fig. 6). These results further validated the functionality of the device for real-time sub-second neurotransmitter measurements in different species and can be adopted to study the neurotransmitter kinetics in large animals. Lastly, we used the NeuroString sensors to simultaneously measure striatal catecholamine release and colon 5-HT changes in response to intake of chocolate in mouse, which is rewarding and nutrient. We detected reproducible release patterns of striatal catecholamine following intake of rewarding chocolate within seconds across animals while an elevation of colonic 5-HT was also observed at 30-60 min after the nutrition uptake (Figs. 4k–l), a result consistent with the typical transit time of mice gastrointestinal tract 48. This result demonstrated the potential of using NeuroString for understanding neurotransmitter dynamics and their roles in CNS-GI axis.
In summary, by developing a graphene-elastomer composite based sensor, we demonstrate NeuroString functions as a soft bioelectronic interface to monitor the dynamics of monoamine neurotransmitter, including DA and 5-HT, in both the brain and the gut of living animals. With tissue-like mechanical property, the NeuroString can interface acutely with the GI mucosa and is compatible with traditional medical inspection device such as endoscopy for noninvasive biomolecular monitoring. NeuroString allows chronically stable and multiplexed neurochemical sensing in the mouse CNS. In the GI tract, the stretchability and softness of NeuroString offers high conformability with intestinal tissue without disturbing the peristaltic movement and without inducing undesired stimulation. The unique elastic features of NeuroString make it suitable for simultaneous monitoring of neurotransmitter signaling from both the central and peripheral nervous systems, and potentially addresses current technical limitation in studying the dynamics of gut chemistry and its interplay with microbes. While inheriting the limitation of voltammetry method makes the sensitivity and selectivity of NeuroString in general worse than the latest genetically encoded fluorescence probes1,11,12, such electrochemical methods are advantageous for translational use in human18,19. NeuroString can also simultaneously sensing multiple biomolecules at multiple locations. Further development will be dedicated to improving the spatial resolution of the sensor using micro/nanofabrication, to improve its selectivity and multiplexity by incorporating different molecular recognition probes, and eventually to integrate it with wireless electronics and to validate its long-term implantation performance. Combining the excellent mechanical properties with the versatility of chemical sensing provided by the graphene surface chemistry, we envision the NeuroString platform will be readily adaptable for studying the dynamics of various signaling biomolecules and electrophysiological signals throughout the body in primates.
Methods
Materials Preparation
Synthesis of polymer precursor containing Fe or Ni metalloporphyrin
5,10,15,20-tetrakis-(4’-aminophenyl) iron (III) porphyrin chloride and 5,10,15,20-tetrakis-(4’-aminophenyl) nickel (II) porphyrin (Ni-TAPP) were synthesized according to a previously reported protocol49. 100 mg of pyromellitic dianhydride (4.59×10⁻¹ mM) was dissolved in 1.4 mL N-Methyl-2-Pyrrolidone (NMP) at 100 °C. The solution was cooled to room temperature. Then, 180 mg of 5,10,15,20-tetrakis-(4’-aminophenyl) iron (III) porphyrin chloride (2.30×10⁻¹ mM), 3 drops of isoquinoline, and 1.4 g of polyamic acid solution (Poly(pyromellitic dianhydride-co-4,4′-oxydianiline)) were introduced in sequence under stirring at room temperature. Pyromellitic dianhydride, isoquinoline and polyamic acid solution, 15.0-16.0 wt.% in NMP) were purchased from Sigma Aldrich without any additional purification before use.
Device Fabrication
NeuroString for brain neurochemical sensing
The NeuroString fabrication process is based on direct laser carbonization of above polyimide polymer precursor (containing metalloporphyrin) into conductive nanoporous graphene networks decorated with nanoparticles (Extended Data Fig. 1a). The design layout of the multi-channel NeuroString for brain neurochemical sensing is shown in Extended Data Fig. 1b. Electrical-Grade Kapton® Polyimide Film (McMASTER-CARR Kapton® Polyimide Film, Electrical-Grade, 12” Wide, 0.0050” Thick, 12” Long) was used as the initial substrate. The polyimide film was first cut into a rectangle shape with a dimension of 3” × 2”. The surface of the polyimide film was then cleaned with oxygen plasma (Technics Micro-RIE Series 800, 150 W, 200 mTorr) for 2 min. Then the prepared metalloporphyrin-containing polyamic acid solution was uniformly coated (50 μL/cm2) on the polyimide substrate using a razor blade (Step 1 in Extended Data Fig. 1c). Due to the high viscosity of the precursor solution, this preparation was left in air for 1 h to form a uniform liquid film with flat surface. Then the sample was loaded on a hotplate (100 °C) for 1 h to remove all the solvent. The film was then annealed at 150°C for 5 min, and annealed at 250°C for 1 h (Step 2 in Extended Data Fig. 1c). Then the resulting film surface was laser engraved by an Epilog Fusion M2 CO2 Laser (Step 3 in Extended Data Fig. 1c) following a reported method on laser-induced graphene50. A laser power of 6 W was used with a raster speed of 25%. After laser engraving, the film turned into a nanoporous graphene network decorated with nanoparticles. A HPDFO (High Power Density Focusing Optics) lens with a focal point of 0.001 inch (25.4 μm) can be used improve the resolution of the engraving.
To prepare the NeuroString, a solution containing poly(Styrene-co-Ethylene-co-Butylene-Styrene) (SEBS) in toluene (Asahi Kasei Tuftec H1062, 0.1g ml−1) was drop-casted on the graphene networks (100 μL/cm2) and then placed in a desiccator with house vacuum for 5 min to remove all gas bubbles. After allowing toluene solvent evaporated overnight, the graphene/SEBS composite was peeled off from the polyimide, flipped to expose graphene on top and placed on another glass substrate (Step 4 in Extended Data Fig. 1c). A tape was used to cover the interconnect area, and another SEBS layer (H1062, 0.1 g ml−1 in toluene) was spin-coated on top at 1,000 r.p.m., to form a stretchable encapsulation layer (step 5 in Extended Data Fig. 1c). After removal of the tape, the film was attached to a glass slide and laser cutting was used to define the individual separated electrodes with a width of 50-90 μm (step 6 in Extended Data Fig. 1c). A laser power of 30 W was used to cut the undesired part and to form small individual electrodes. Then the electrode was dip-coated with another block copolymer solution (Kuraray LA3320, 0.1 g ml−1 in acetone) to fully encapsulate the sidewalls of graphene electrodes (step 7 in Extended Data Fig. 1c). Then acetone was used to dissolve LA3320 in order to not induce any dissolution of the formed electrodes and substrate.
For implantation in the brain, the NeuroString was dip-coated in a pullulan solution (0.3 g mL−1) and dried overnight on a Teflon film to form the shuttle layer (step 8 in Extended Data Fig. 1c). Finally, the tips of electrodes were cut using a razor blade to expose the cross sections of the graphene (step 9 in Extended Data Fig. 1c). To fully expose the graphene, the cross-sectional surfaces of electrodes were oxygen plasma-treated (Technics Micro-RIE Series 800, 150 W, 200 mTorr) for 2 min. To avoid any interference of the ascorbic acid and biofouling from the biological fluids, the tip of the electrodes was finally dipped in a Nafion solution (0.5% in water/ethanol) to form a Nafion coating before use. Once the device was implanted in the brain tissue, the NeuroString was released after pullulan dissolved away to give a soft implanted electrode (step 10 in Extended Data Fig. 1c). The electronic design was created with CorelDraw software.
NeuroString for gut neurochemical sensing
The NeuroString fabrication process is based on direct laser carbonization of above polyimide polymer precursor (containing metalloporphyrin) into conductive nanoporous graphene networks decorated with nanoparticles (Extended Data Fig. 1a). The design layout the multi-channel NeuroString for gut neurochemical sensing is shown in Extended Data Fig. 1d. Electrical-Grade Kapton® Polyimide Film (McMASTER-CARR Kapton® Polyimide Film, Electrical-Grade, 12” Wide, 0.0050” Thick, 12” Long) was used as the initial substrate. The polyimide film was firstly cut into a rectangle shape with a dimension of 3″× 2″. The surface of the polyimide film was then cleaned with oxygen plasma (Technics Micro-RIE Series 800, 150 W, 200 mTorr) for 2 min. Then the prepared metalloporphyrin-containing a polyamic acid solution was uniformly coated (50 μL/cm2) on the polyimide using a razor blade (Step 1 in Extended Data Fig. 1d). Leaving the solution in the air for 1 h gave a uniform solution coating. Then the sample was placed on a hotplate (100 °C) for 1 h to remove all the solvent. The film was then annealed at 150°C for 5 min, and then annealed at 250°C for 1 h (Step 2 in Extended Data Fig. 1). Then individual electrodes (width ~120-220 μm) were directly patterned on the polyimide surface using the laser engraving by an Epilog Fusion M2 CO2 Laser (Step 3 in Extended Data Fig. 1) following reported method on laser-induced graphene (2). A laser power of 6 W was used with a raster speed of 25%. After laser engraving, the film coating was transformed into a nanoporous graphene network decorated with nanoparticles.
Next, a SEBS solution (H1062, 0.1 g ml−1 in toluene) was uniformly drop-cast on the graphene network (100 μL/cm2) and then placed in a desiccator and pumped with a house vacuum for 5 min to remove all the possible gas bubbles from the SEBS solution. After allowing toluene solvent evaporation overnight, the formed graphene/SEBS composite was peeled off from the polyimide substrate, flipped to expose graphene on top and placed on another glass substrate (step 4 in Extended Data Fig. 1). Then a tape was used to cover the interconnect area, and another SEBS solution (H1062, 0.1 g ml−1 in toluene) was spin-coated on top at 1,000 r.p.m., to form a stretchable encapsulation layer (step 5 in Extended Data Fig. 1). After removal of the tape, the interconnect-encapsulated film was attached to a glass slide and a laser cutting through step was used to define the probes (step 6 in Extended Data Fig. 1). A CO2 laser with a 30 W power was used to cut away the undesired part.
For easier placing the mouse gut, the NeuroString was dipped in a pullulan solution (0.1 g mL−1 and dried overnight on Teflon film to form the shuttle layer (step 8 in Extended Data Fig. 1). Finally, the ends of electrodes were cut using a razor blade to expose the cross sections of the graphene (step 8 in Extended Data Fig. 1). To fully expose the graphene, the cross-section surfaces of electrodes were oxygen plasma treated (Technics Micro-RIE Series 800, 150 W, 200 mTorr, make sure the sensing electrode opening is facing up towards the plasma treatment in this proces) for 2 min. To avoid any interference of the ascorbic acid and biofouling from the biological fluids, the tips of the electrodes were finally dipped in a Nafion solution (0.5% in water/ethanol) to form a Nafion coating before use. Once the device was in the gut tissue, dissolving of the pullulan released the NeuroString as a soft implant (step 9 in Extended Data Fig. 1). The electronic design was created with CorelDraw software.
Characterization
Morphological and compositional characterization
The SEM images were taken by a FEI XL30 Sirion SEM (5 kV). The LabRAM HR Evolution microscope (HORIBA Scientific) was used for Raman spectroscopy with 532 or 633 nm excitation and a 1,800 grooves mm−1 grating. High resolution transmission electron microscope (HRTEM) images were taken on a FEI Titan 80-300 environmental (scanning) electron microscope (E(S)TEM). Laser-induced graphene was scraped off and sonicated in ethanol before being transferred onto a copper TEM grid. The EDS/EELS elemental mappings were acquired using a Gatan Quefina dual-EELS spectrometer with an energy dispersion of 0.1 eV per channel. To minimize possible electron beam irradiation effects, all the EELS and EDS spectra demonstrated in this project were acquired from areas without pre-beam irradiation. XPS was performed on a PHI Versa Probe Scanning X-ray Photoelectron Spectroscopy Microprobe.
Micro X-ray computed tomography
Non-destructive computed tomography (CT) reconstructions of the graphene-elastomer composite and the NeuroString in mouse colon were performed with a ZEISS Xradia 520 Versa X-ray microscope (Carl Zeiss AG). 1% iodine metal (I2 dissolved in 100% ethanol) solution was used as the staining solution to increase the contrast of the device51. To stain the graphene networks, the iodine metal solution was directly dropped on the laser-induced graphene networks, after 10 min ethanol solvent evaporation, SEBS solution (H1062, 0.1 g ml−1 in toluene) was drop-cast on the graphene networks and then placed in a desiccator for 5 min to remove all the possible gas bubbles from the SEBS solution. After the toluene solvent evaporation overnight, the formed graphene/SEBS composite was peeled off from the polyimide substrate, flipped to expose graphene on top and placed on another glass substrate. A CO2 laser with a 30 W power was used to cut the composite into small fibers with a diameter of ~200 μm for CT scan. A homemade acrylic stage was used to allow the fiber to be stretched and imaged in the CT scanner. Similarly, to image the NeuroString in the mouse colon, iodine metal solution (I2 dissolved in 100% ethanol) was directly dropped on the laser-induced graphene networks before the SEBS encapsulation process. The exposure time of 10 s was used with an acceleration voltage of 30 kV. A total of 2,501 CT scans were taken at 30 kV to create a 3D rendering of the interior morphology of the samples. The projection images were reconstructed into 3D images and processed using the software Dragonfly (Object Research System).
Mechanical property characterization
Mechanical properties of freestanding graphene/SEBS composite films with ~50 μm in thickness were studied using Instron 5565 with a 100-N loading cell. The samples were glued between compression plates. The width and length of the film were measured by a caliper. The thickness was measured by an optical microscope. A strain rate of 5%/min was used for mechanical testing if not otherwise indicated. The composite films had rectangular symmetry with a sample size of 10×2 mm.
Electrical and electrochemical characterization
To measure the conductivity of the graphene-SEBS composites during stretching, samples were attached to a homemade stretching station attached to an LCR meter (Keysight Technologies E4980). Silver epoxy was used to make contacts. Graphene-SEBS composite with a size of 5×10 mm2 was used to measure the square resistivity, while the stretching state was stretched with 2 mm in each step. The neurotransmitter sensing is based on fast-scan cyclic voltammetry14,17,32. Electrochemical measurements were performed with a portable potentiostat PalmSens4 built with impedance spectroscopy, fast-scan cyclic voltammetry (FSCV), and a 4-channel multiplexer. The electrochemical impedance of the NeuroString and FSCV were measured in the PBS buffer solution (pH 7.4). The potentiostatic electrochemical impedance spectroscopy (PEIS) was measured with a sine wave (frequency from 1 Hz to 1 MHz) and a signal amplitude of 10 mV. The FSCV was performed at different scan rates from 10 V/s to 400 V/s with a triangular waveform (−0.4 to 1.3 V, interval from 1 to 100 ms depending on the scanning parameters) relative to the Ag/AgCl reference electrode placed in 3 M KCl. Selective neurotransmitter sensing can be achieved with a scan rate from 10-50 V/s, while increasing the scan rate to 500V/s will give better sensitivity. Depending on the size of the electrode, the background current varies from 100-2000 nA. For comparison, carbon fiber electrodes with a tip diameter of 10 μm were ordered from World Precision Instruments (Carbon Fiber Electrode, L 500 μm). Due to the background current variation of each electrode, the background-subtracted Faradic currents response were normalized to a background current of 1000 nA for comparison. Because the monoamine analytes in aqueous solution can be easily oxidized, the analyte solution used in the tests should be made directly before that testing, and it is preferred to pump nitrogen to the PBS buffer for 2 hours to remove the oxygen before making the solution. To stabilize the recording electrode, a triangular waveform was applied to the electrode at a frequency of 60 Hz for least 1 h to reduce the drifting32,52,53. A functioning electrode should have a stable capacitive background response during cyclic voltammetry scan as shown in Extended Fig. 4b.
Animal Studies
Surgery for implantation of NeuroString into the mice brain and viral expression
All surgical procedures for mice were performed in accordance with protocols approved by the Institutional Animal Care and Use Committee (IACUC) at Stanford University. All the channels of the NeuroString were calibrated by measuring the normalized oxidation current at different analyte concentrations (10-200 nM in PBS) and then continuously scanned using FSCV (10-400 V/s, trigangle wave, −0.4 to 1.3 V) for 1 h to ensure there is no obvious drifting of the background current (<1% over 250 scans) before implantation. Mice were anesthetized with ketamine cocktail (100 mg/kg ketamine and 10 mg/kg xylazine, intraperitoneally) and placed in a stereotactic frame (Stoelting #51600). A heating pad was used to maintain the body temperature of the mice. A midsagittal incision was placed slightly anterior and posterior of bregma and lambda, respectively. Craniotomies (Stoelting #51449) were stereotaxically guided to place the NeuroString (with pullulan coating as shuttle materials) into the NAc (+1.18 AP, +0.6 ML, −4.2 DV) or BLA(− 1.34 AP, + 2.9 ML, − 4.7 DV) and then fixed with dental cement. A chloritized silver reference electrode (Ag/AgCl) was implanted ipsilaterally into cortex area for each animal54. Following surgery, mice received analgesia that consisted of either ibuprofen (100 mg/kg) or buprenorphine (1 mg/kg). For all surgical procedures, animals were allowed to fully recover for at least two weeks before chronic recordings.
For the optogenetic stimulation experiments, 200 nl concentrated adeno-associated virus encoding cre-inducible Channelrhodopsin-2 (AAV9-DIO-ChR2-EYFP; University of Pennsylvania Vector Core) was unilaterally injected into the VTA (−3.28 AP, +0.4 ML, −4.3 DV) of DAT-Cre animals (The Jackson Laoratory, No: 006660) or DRN of Sert-Cre animals (The Jackson Laoratory, No: 014554) at the angle of 10 degrees (−4.6 AP, 0 ML, −3.1 DV). Then, immediately following viral injection, a fabricated fiber optic was implanted above the injection site (VTA: −3.28 AP, +0.4 ML, −4.1 DV; DRN: −4.6 AP, 0 ML, −2.9 DV) and affixed to the skull using dental cement.
Neurotransmitter sensing in the mice brain
Monoamine level was recorded using fast-scan cyclic voltammetry. To stabilize the recording electrode, a triangular waveform was applied to the electrode at a frequency of 60 Hz for at least 1 h before each recording session32,52,53. The cycling frequency was then reduced to 10 Hz for 30 min or until a stable background was detected prior to initiation of the recording session. During this ‘cycling’ period, mice remained in their home cage. Voltammetric electrodes were validated for functionality and for data inclusion using two criteria53: electrodes with a background current above 100 nA and background signaknoise is above 250:1; the background current is stable with a drift <1% over 250 scans. The first 10 scans before stimulation were averaged as the background. The variable background drift was subtracted for each recording to eliminate the noise fluctuation during subsequent analysis. Voltammetric analysis was conducted using PSTrace 5.6 software, MATLAB, and Origin.
Optogenetic stimulation
For optogenetic stimulation, dopaminergic neurons or serotoninergic neurons were stimulated using laser (Laserglow, 473 nm, 5 mW, 1 s at 5, 20, 50, or 100 Hz). dopamine or serotonin level was recorded during the stimulation using fast-scan cyclic voltammetry, which consisted of a triangular waveform (−0.4 to 1.3 V and back at 400 V/s) applied to the tip of the sensing electrode with a frequency of 10 Hz.
Drug effect
Drug-induced neurotransmitter release was performed using DAT-Cre animals. Neurochemical measurement was recorded after the drug injection using FSCV, which consisted of a triangular waveform (−0.4 to 1.3 V) with a relatively reduced scanning speed of 20 V/s and a frequency of 5 Hz. The method for evoking simultaneous release of serotonin and dopamine was achieved by a published method using a synthetic precursor of serotonin, 5-hydroxytryptophan (5-HTP), to increase the amount of serotonin in the dopamine terminals of the brain55–57. First, (S)-3-(3,4-Dihydroxyphenyl)-2-hydrazino-2-methylpropionic acid monohydrate (carbidopa), which prevents the 5-HTP from being converted into serotonin before it reaches the brain, was intraperitoneally injected (25 mg/kg) if 5-HTP would be administered later. Thirty minutes later, cocaine (15 mg/kg), 5-HTP (500 mg/kg), a cocktail drug containing cocaine and 5-HTP or a cocktail drug containing cocaine, 5-HTP and fluoxetine (10 mg/kg) was intraperitoneally injected. As control, saline was injected on separated days. Neurochemical measurement was performed at 10 min after the drug injection by FSCV.
Pavlovian cued-reward learning task
Six DAT-Cre animals with NeuroString implantation into the NAc were trained to lick a water spout after an auditory tone to get water in a custom-made chamber (30 x 35 mm). The chamber was equipped with a retractable spout in the center of one wall and an auditory loudspeaker on the other side of the same wall. Mice were deprived from water and habituated to the chamber for 2 days. During the habituation, the animals reliably licked the spout to get the water. After the habituation, the cued reward training began. In each trial, tone (4 kHz) was delivered for 2 s, followed by the extension of the water spout and a 4 s lick detection period. During this period, mice needed to lick the spout to trigger the delivery of 6 μl water. Mice had 2 s of consumption period after water delivery, followed by the retraction of the spout and a random inter trial interval (ITI) (17-27 s). If mice failed to lick during the lick-detection period, the spout was retracted immediately after this period and ITI was counted. The behavior training and lick events were controlled and recorded by custom-written Matlab code. FSCV recording was performed at 400 V/s. Mice were trained for 50 trials every day and water was supplied to ensure they got 1 ml water every day (including the obtained amount during training) before going back to their homecage.
Fear extinction learning task
Five DAT-Cre animals with NeuroString implantation into the NAc were used in this study. Fear conditioning and extinction were performed in two different custom-made contexts inside a sound attenuating box (Med Associates). All mice were habituated to the context A (a square chamber with an electrical grid floor) on day one. An auditory tone (4 kHz, 10 s) was played for 5 times with a random inter trial interval (ITI, 60-100 s). On day two, mice were subjected to fear conditioning consisting of 5 pairs of CS (conditioned stimuli, 4 kHz tone, 10 s) with a US (unconditioned stimuli, footshock, 0.35 mA, 1 s) in context A. The US occurred immediately after the termination of CS. The random ITI ranged from 60-100 s between each pair. Twenty-four h later, mice received an extinction training in context B (a triangle chamber). Only auditory tone (4 kHz, 10 s) was played in each trial. Mice were videotaped for analyzing the freezing level in response to the CS. FSCV recording was performed at 400 V/s during each day.
Neurochemical sensing in the mice brain slices
One-month-old wild-type mice were used for slice experiments. Coronal 250 μm slices containing the NAc were prepared using a vibratome (VT-1000S, Leica) in an ice-cold cutting solution (in mM): sucrose 213, KCl 2.5, NaH2PO4 1.25, MgSO4 10, CaCl2 0.5, NaHCO3 26, and glucose 11 (300–305 mOsm). Slices were incubated in the artificial CSF (ACSF) containing the following (in mm): NaCl 126, KCl 2.5, NaH2PO4 1.25, MgCl2 2, CaCl2 2, NaHCO3 26, and glucose 10 (300–305 mOsm) at 34°C to recover for 30 min and then kept in the ACSF at room temperature for at least 30 minutes prior to recording. To induce and detect the release of dopamine, a concentric bipolar cluster microelectrode (FHC, Inc) and a NeuroString electrode were positioned into the ventral striatum. FSCV recording was performed at 10 V/s before drug perfusion or at 10 minutes after drug perfusion. The electrical stimuli (200 μA, 20 Hz, 0.5 s) was delivered for 5 times with a 10 s interval between each stimulus for each FSCV recording. Four drugs were used to test their dosage effect on the evoked release of dopamine: amphetamine (AMPH, 1, 5, 10 μM), cocaine (1, 5, 10 μM), 5-HTP (1, 5, 10 μM) and fluoxetine (5, 10, 50 μM).
Serotonin sensing in mouse colon
Mice were sacrificed by cervical dislocation. The abdomen was immediately opened and the entire colon from the caecum to the terminal rectum was removed. In all experiments, the full-length colon was placed in a Petri dish filled with carbogen-gassed (95% O2 / 5% CO2) Krebs solution (25–30°C; in mM concentrations: NaCl 118; KCl 4.7; NaH2PO4 1; NaHCO3 25; MgCl2 1.2; D-Glucose 11; CaCl2 2.5). Residual pellets were gently flushed from the colon using Krebs solution. A NeuroString was placed in the colon using pullulan as shuttle materials. Chronoamperometry with a potential of 600 mV was used to monitor the serotonin overflow. An Ag/AgCl wire was placed in the flow bath as the reference electrode. The heating and cooling of the buffer environment was achieved by a flow cell with a thermostat to control the temperature. The graphene electrodes of the NeuroString were calibrated at by measuring the temperature-dependent oxidation current of serotonin solution in a water bath.
Serotonin sensing in living pigs
Female juvenile mini-Yucatan pigs (Sus scrofula, n = 6), age 6-9 weeks, and weight of 10 kg, from breeder S&S Farms (Ramona, CA) were utilized in this study. NeuroString sensors were applied to gastro-intestinal tract to record enteric serotonin levels. Briefly, all pigs were fasted overnight, placed under general anesthesia using vaporized isoflurane, and connected to vital sign monitors during this terminal procedure. A midline laparotomy incision was made to expose the viscera. Krebs/PBS buffer was infused to the porcine intestine to flush the contents prior to sensing. The ligament of Treitz was identified to locate the duodenum and jejunum and the ileocecal valve was found to designate the ileum. Cecum and spiral colon were also exposed. Soft NeuroString sensors were applied directly on the gastro-intestinal tract (duodenum, jejunum, ileum, cecum, colon) by inserting within the lumen through ostomies, for continuous live recordings. An Ag/AgCl wire is inserted in the jejunum lumen as the reference electrode. Recordings of baseline concentrations of serotonin were performed before administration of drugs. Serotonin reuptake inhibitor fluoxetine (10 mg/kg), monoamine oxidase inhibitor methylene blue (5 mg/kg) or saline water were administered (1 ml) around the sensing sites by direct injection in the bowel wall. Measurements were performed 10 minutes after the injection of drugs to the colon tissue. Anesthetized animals were euthanized by veterinarians at the end of the recordings.
Locomotor and pellet output behavior
Mice were divided into three groups and behavioral testing was performed by double-blinded individuals. Mice were first anesthetized in an induction chamber (4% isoflurane) and maintained at 1% to 2% isoflurane for device implantation. NeuroString (2 cm length, 800 μm width, 120 μm thickness) was placed in the colon of one group, flexible Kapton (2 cm length, 800 μm width, 120 μm thickness) was placed in the colon of the second group, while no device was placed in the colon of the third group. After recovering from anesthesia, mice were placed in a chamber, where they freely moved. The open field activity was assessed based on the previously published protocol58. The mice were videotaped for 5 min using a Microsoft LifeCam Cinema camera and the movement was analyzed using MATLAB.
The pellet output was recorded based on the previously published protocol59,60. The same mice were divided into 3 groups and received NeuroString, flexible Kapton implantation or no implantation into the colon as described above. After device implantation and recovering from anesthetization, mice were placed into a recording chamber. Pellets were collected and counted at the end of the 3-h recording period.
Colitis inflammation model
Colitis was induced by the addition of 2.5% wt/vol DSS to the drinking water for 10 days (from day zero)61,62 while control mice received normal drinking water. During and after DSS treatment, animals were monitored for signs of pain, altered feeding habits, or weight loss to ensure that their nutritional needs are met and there is no significant distress. The colon serotonin was measured in anesthetized mice by acutely inserting the NeuroString in the mouse colon at different days after the DSS treatment.
Serotonin sensing in living mice
NeuroString was acutely inserted into the colon to measure the serotonin level in each recording. Mice, fasted overnight, were anesthetized with 1-2% isoflurane and placed in a stereotaxic apparatus while resting on a heating pad. Following Krebs solution flushing in the colon, the fecal contents in the colon were removed, and then lubricant (MEDLINE, E-Z Lubricating Jelly) was placed in the colon with a Teflon tube. NeuroString probe was inserted into the mouse colon using pullulan as shuttle materials or with the help of an endoscope. Chronoamperometry with a potential of 500 mV was used to monitoring the serotonin dynamics. An Ag/AgCl wire was placed in the colon lumen as the reference electrode. The measurements were performed at the distal colon region (2 cm from the anus).
To simultaneously measure the dynamics of brain dopamine and gut serotonin after rewarding consumption, mice with chronically implanted NeuroString (2 months after implantation) in the striatum were used. Mice were first habituated to head fixation, fasted overnight and NeuroString was inserted into the colon as described above before the sensing experiments. For the reward intake experiment, 30 μl chocolate syrup (The Hershey Company) was delivered into the mouth using an oral gavage. The experimenter observed whether the mice consumed the fluid well in each session. The brain NeuroString was used to detect the phasic dopamine release in the NAc, while the gut NeuroString placed in the colon was used to detect the serotonin concentration over time.
Histology and immunohistology staining
Biocompatibility studies were performed to compare the tissue damages and immune responses at the implantation site for the NeuroString and control devices. To study the brain immune responses, a NeuroString or silica fiber (diameter 100 μm) as control was implanted at the mouse striatum. Three mice (three implants for each mouse) were used for each device. Four weeks after implantation, the mice were sacrificed. The brain tissues were fixed in a PBS solution with 4% formaldehyde for 24 h and then in 70% ethanol for 24 h. The sections of tissue samples (5 μm thickness) were stained with monoclonal antibodies for ionized calcium-binding adapter molecule (Iba-1, a microglia marker, Wako Chemicals, 1:400 dilution) and glial fibrillary acidic protein (GFAP, an astrocyte marker, Thermo Fisher Scientific 2.2B10, 1:500 dilution). For another batch of mice, the brain sections were cleared and immunostained following a published protocol63. Briefly, brain slices (200 μm thickness) were incubated with CUBIC-L (TCI, T3740) for 48 h and rinsed with PBS. The slices were then incubated with primary antibodies for GFAP (DaKO Z0334, 1:1000 dilution) and MAP2 (Synaptic Systems 188004, 1:200) diluted in a staining solution consisting of 0.2% Triton-X and 3% goat serum in PBS for 48 h, and rinsed again in PBS. The slices were then incubated with the secondary antibodies Alexa guinea pig 488 (1:500) and Alexa rabbit 568 (1:500) in the same staining solution for 24 h. After staining, the slices were pre-treated with 50% CUBIC-R+ (TCI, T3741) in water for 6 h, and then incubated in 100% CUBIC-R+ for 48 h, or until cleared. Imaging was performed using a Leica SP8 confocal microscope.
To study the biocompatibility of devices with the mouse colon, a NeuroString (2 cm length, 800 μm width, 120 μm thickness) was placed in the colon of one group (3 mice). A flexible Kapton film with the same dimension as the NeuroString was placed in the colon for the control group (3 mice). After 3 h, the mice were euthanized by cervical dislocation. Then the colons were collected and the longitudinal tissue sections were fixed in neutral buffer with 10% formalin (vol/vol) for 15 h, then transferred into 70% ethanol for 5 h, and embedded in paraffin. The tissue sections with 5 μm thickness were prepared and stained with H&E staining (completed by the Stanford Department of Comparative Medicine’s Animal Histology Services). For the mice treated with DSS, the colons were collected on day 10 after the induction of colitis. The transverse tissue sections (5 μm thickness) were stained with H&E as well. The stained sections were scanned by Hamamatsu NanoZoomer 2.0HT and the images were processed using ImageScope viewing software.
Colonic motility assay
Spatiotemporal mapping was completed according to a published protocol by keeping the cecum on the colon64. 12-week-old, wild-type male mice were fasted overnight and euthanized by carbon dioxide administration and cervical dislocation. Colons were removed and pinned loosely in the bath containing 37°C physiological Krebs solution. A camera (DMK 41AF02, The Imaging Source, Charlotte, North Carolina) was oriented above the tissue and used to record 10-min videos (3.75 fps, 1280x960, 8-bit) using IC Capture software (The Imaging Source, version 2.4.642.2631). Colon samples were randomized to one of three groups to be inserted with different electrodes: 1) a soft NeuroString inserted 2 cm into the distal end; 2) a flexible polyimide inserted 2 cm into the distal end; 3) control group in which no probe was inserted. Analysis was performed using custom-written software (VolumetryG9a, Dr. Grant Hennig, University of Vermont). In brief, videos of the colons were transformed into particle formats, and a spline was fit longitudinally to measure the diameter over time at every point along the length of the colon. Spatiotemporal maps, which display the matrix of diameter versus time, were generated. From these maps, two thresholds were set to select for long (83 frames, 8 to 30 seconds) and short (9 frames, 0.8 to 3.2 seconds) intervals between contractions to identify CMMCs and slow wave contraction events65, respectively. A color gradient was fit to the spatiotemporal maps to represent the interval between slow waves at each cross-sectional diameter for the entire length of the colon. The summation of each focal diameter over the 10-min time period was normalized to graph the cumulative distribution of the percentile of intervals (in seconds) of CMMCs and slow wave contractions. The method and source code for the ex vivo gut segment diameter mapping recipe is provided in supplementary information.
Statistical analysis
For statistical analyses, R, Origin, Prism and Excel were used. All replicate numbers, error bars, P values and statistical tests were indicated in the figure legends.
Extended Data
Extended Data Fig. 1 |. Fabrication process of the NeuroString sensors.

a, Scheme showing the chemical structures of the polymer precursors and the laser carbonization process. b, Layout showing the dimensions of the multi-channel NeuroString electrodes for the sensing in the brain. c, Fabrication process of the NeuroString for brain neurochemical sensing: (1) A polymer precursor solution containing a polyamic acid mixed with a metalloporphyrin (2.3×10⁻¹ mM) was uniformly drop-casted (50 μL/cm2) as a film on a polyimide substrate. (2) The precursor film was annealed in air at 250 °C for 1h in air to form the polyimide film. (3) The film surface was laser engraved by an Epilog Fusion M2 Laser (6W power) to generate the graphene network with Fe3O4 or NiO nanoparticles. A HPDFO (High Power Density Focusing Optics) lens with a focal point of 0.001 inch (25.4 μm) can be used improve the resolution of the engraving. (4) A SEBS solution (H1062, 0.1g ml−1 in toluene) was drop-casted on the graphene networks, which was then peeled off from the substrate and attached to another glass substrate when the SEBS side was in contact with glass. (5) Another SEBS layer (H1062, 0.1g ml−1 in toluene) was spin-coating on top at 1,000 r.p.m., to form an encapsulation layer. (6) A high laser power of 30W was subsequently used to cut into desired size and shape and isolate the individual electrode strings with 90 μm width. (7) The electrode area is dip-coated in another elastomer solution (Kuraray LA3320, 0.1g ml−1 in acetone) to fully encapsulate the graphene electrodes. (8) For implantation in the brain, the NeuroStrings were dip-coated in a pullulan solution (0.3g mL−1) and dried overnight to form a rigid coating. (9) The tips of electrodes were cut by a razor blade to expose the cross sections of the graphene. To fully expose the graphene, the cross-section surfaces of electrodes were additionally oxygen plasma treated for 2 min (Technics Micro-RIE Series 800, 150 W, 200 mTorr). To avoid any electrochemical interference of the ascorbic acid from the biological fluids, the tip of the electrodes is dipped in a Nafion solution (0.5% in water/ethanol) to form a Nafion coating before using. (10) Dissolving of the pullulan in tissue finally releases the NeuroString as a soft implant. d, Layout showing the dimensions of the NeuroString electrodes for sensing in the gut. e, Fabrication process of the NeuroString for gut neurochemical sensing. (1) A polymer precursor solution containing a polyamic acid mixed with a metalloporphyrin (2.3×10⁻¹ mM) was uniformly drop-casted (50 μL/cm2) as a film on a polyimide substrate. (2) The precursor film was annealed in air at 250 °C for 1h to form the polyimide film. (3) The film surface was laser engraved by an Epilog Fusion M2 Laser (6W power) to generate the graphene network with Fe3O4 or NiO nanoparticles. (4) SEBS solution (H1062, 0.1g ml−1 in toluene) is drop casted on the graphene networks to form graphene/SEBS composite, which is then is delaminated and transferred from the substrate and flipped on another glass substrate. (5) Another SEBS layer (H1062, 0.1g ml−1 in toluene) is spin-coated on top at 1,000 r.p.m., to form an encapsulation layer. (6) A high laser power with 30W power and 20% speed was used to cut the undesired part of the device. (7) For easier placing the mouse gut, a pullulan solution (0.1g mL−1) was dip-coated on the electrodes and dried overnight to form the shuttle layer. (8) The ends of electrodes are cut using a razor blade to expose the cross sections of the graphene. To fully expose the graphene, the cross-section surfaces of electrodes were oxygen plasma treated for 2min. To avoid any interference of the ascorbic acid from the biological fluids, the tip of the electrodes is finally dipped in a Nafion solution (0.5% in water/ethanol) to form a Nafion coating before use. (9) Dissolving of the pullulan in tissue will release the NeuroString as a soft implant.
Extended Data Fig. 2 |. Characterization of the laser-induced graphene used in the NeuroString sensor.

a, SEMs showing the resolution of the laser fabrication process (laser power 6W). Directly laser writing can achieve a resolution ~100 μm, while individual structure smaller than 50 μm can be fabricated by laser engraving (etching) process: e.g. two laser cutting line with a distance of 150 μm will lead to a free-staning electrode with the width of 50 μm. b-d, SEM images showing the graphene networks made by different laser powers. The graphene layer thicknesses are: 40-50 μm (laser power 6 W), 50-80 μm (laser power 9 W), and 120-150 μm (laser power 12 W). Thicker polyimide film will be carbonized at a higher laser power so that the graphene layer increases. The SEM characterization was repeated and reproduced for 6 times. e, High- resolution TEM of laser-induced graphene showing the characteristic 0.34 nm d- spacing between graphene sheets (laser power 6W). The TEM characterization was repeated and reproduced for 3 times. f, Normalized confocal Raman spectra (633-nm laser excitation) of a laser-induced graphene film made by different laser powers. The intensity profile indicates that higher laser power induced more defects in graphene. The higher D band at lower laser power is mainly due to the more oxygen and graphene oxide present in the laser-induced graphene.
Extended Data Fig. 3 |. Characterization of the transition metal oxide nanoparticles involved in the NeuroString sensor.

a, TEM characterization of the laser-induced graphene decorated with Fe3O4 nanoparticles (laser power 6W). The TEM characterization was repeated and reproduced for 3 times. b, TEM intensity profile of the Fe3O4 nanocrystal shown in (a). c, EELS analysis of the laser-induced graphene decorated with Fe3O4 nanoparticles (laser power 6W). d, Electron energy-loss spectroscopy (EELS) mapping showing decoration of Fe3O4 nanoparticles on the graphene e, TEM characterization of the laser-induced graphene decorated with NiO nanoparticles (laser power 6W). The TEM characterization was repeated and reproduced for 3 times f, TEM intensity profile of the NiO nanocrystal shown in (e). g, EELS analysis of the laser-induced graphene decorated with NiO nanoparticles (laser power 6W).
Extended Data Fig. 4 |. Selectivity and sensitivity characterization of the NeuroString sensors.

a-b, Cyclic voltammetry backgrounds of different electrodes in phosphate-buffered saline (PBS) buffer (pH 7.4) (scan rate 400 V/s). NeuroString has lower background current than the carbon fiber. c, Reaction mechanism of the dopamine and serotonin oxidation during fast scan cyclic voltammetry measurement. d, Comparison of the selectivity of different electrodes for simultaneous dopamine and serotonin sensing using cyclic voltammetry. The cyclic voltammetry is performed in a solution with 500 nM dopamine and 500 nM serotonin in PBS (pH 7.4) with a scan rate of 10V/s. e-f, Normalized oxidation current (nA ) of NeuroString (without and with Fe3O4 nanoparticles) and carbon nanofibers for dopamine and serotonin sensing (scan rate: 400 V/s). As the background current varies from 100-500 nA depending on the dimension, the ; the background current is defined as the current value at the 0.5 V. n=5 different NeuroString electrodes examined in independent measurement, box range: 25% to 75%. g, Concentration-dependent calibration response of NeuroString electrode to 5-HT using FSCV and chronoamperometry. (PBS buffer pH 7.4; Chronoamperometry potential: 0.6 V, error bars are obtained from n=6 different NeuroString electrodes examined in independent measurement)). Simultaneous and selective detection of DA and 5-HT: h, FSCVs of various concentrations of 5-HT (100 nM, 250 nM, 500 nM, 750 nM, 1000 nM) in 200 nM DA solution (dissolved in PBS buffer, pH 7.4), inset shows the linear plot of currents against concentrations of 5-HT.; i, FSCVs of various concentrations of DA (100 nM, 250 nM, 500 nM, 750 nM, 1000 nM) in 200 nM 5-HT solution (dissolved in PBS buffer, pH 7.4), inset shows the linear plot of currents against concentrations of DA. Simultaneous and selective detection of NP, EP and 5-HT: j, FSCVs of various concentrations of EP (100 nM, 250 nM, 500 nM, 750 nM, 1000 nM) in 200 nM 5-HT and 200 nM EP solution (dissolved in PBS buffer, pH 7.4), inset shows the linear plot of currents against concentrations of EP; k, FSCVs of various concentrations of 5-HT (100 nM, 250 nM, 500 nM, 750 nM, 1000 nM) in 200 nM NP and 200 nM EP solution (dissolved in PBS buffer, pH 7.4), inset shows the linear plot of currents against concentrations of 5-HT.; l, FSCVs of various concentrations of NP (100 nM, 250 nM, 500 nM, 750 nM, 1000 nM) in 200 nM 5-HT and 200 nM EP solution (dissolved in PBS buffer, pH 7.4), inset shows the linear plot of currents against concentrations of NP.
Extended Data Fig. 5 |. Measurement of the neurotransmitter release during fear conditioning and extinction training, and chronic stability of the NeuroString for neurotransmitter sensing.

a-d, Dopamine release in the NAc measured during various phases of a fear extinction task (NeuroStrings were implanted at least two weeks before the behavior assay started). a, Trial structure for the fear extinction training. b, Percentage of freezing to the CS during early extinction phase (E-Ext, 1-8 trials) and late extinction phase (L-Ext, 9-15 trials) (n = 5 mice). The CS evoked lower freezing levels during late phase indicated successful extinction learning. P value 0.0005. c, Quantification of dopamine responses to the CS during habituation (before Cond.), the fear conditioning (an electric shock after the tone) and fear extinction phase (n = 5 mice). P value: 0.0018 (shock), 0.003 (E-Ext), 0.0706 (L-Ext). d, Exemplar time-aligned dopamine signals from a mouse during each phase. e, Chronic measurement of dopamine in the NAc evoked by optogenetic stimulation of dopamine neurons in the VTA of DAT-Cre mice expressing ChR2 (Error bars are obtained from measurements from n=6 biologically independent mouse). P values: 0.9011 (week 4); 0.9926 (week 8); 0.6946 (week 12); and 0.4462 (week 16); f-g, Representative measurements from a NeuroString electrode in a mouse across 16 weeks in the form of (f) background-subtracted cyclic voltammogram and (g) the corresponding electrochemical impedance. P values are calculated by paired two-tailed Student’s t-test: ns P > 0.05; *P ≤ 0.05; **P ≤ 0.01; ***P ≤ 0.001.
Extended Data Fig. 6 |. Evaluation of NeuroString performance for serotonin sensing in the GI tract of rodents and large animals.

a, Setup of the colonic motility assay providing video imaging and spatiotemporal maps to analyze colonic motility of mice inserted with NeuroString ex vivo. Control is a mouse colon without anything inside the lumen. b, Representative H&E staining images showing the colon tissue of mice placed with a flexible Kapton (2 cm, 800 μm width, 120 μm thickness) film and a NeuroString with the same dimension. The materials were placed in the colon of freely moving mice for 3 h before collecting the tissue. damage to the tissue was clearly observed with flexible polyimide film implant. The H&E staining was repeated and reproduced for in 5 mice. c-d, Open field activity (average velocity) and e, pellet output in a 5-hour duration for mice with the colon acutely placed with a NeuroString or a flexible Kapton polyimide as control (n = 6). P value: NeuroString (0.9689) and Polyimide (0.0004) in d; NeuroString (0.4895) and Polyimide (0.0015) in e. The dotted lines in (c) showed 5-min trajectories of the mice. f. Photos showing NeuroString is wrapped around on a probe extended from one working channels of an endoscope (left), and the obtained endoscopy photo showing the NeuroString entering the colon lumen for serotonin sensing in a rat model (right). g. Representative serotonin concentration mapping in the rat colon (5 cm from the anus) collected by delivering the NeuroString into the colon lumen and slowly taking it out (error bar denotes ± SD of the measurement results obtained from 3 channels). h. μ-CT images showing the NeuroString conformally loaded in the mouse colon. i, Representative H&E staining images showing the colon tissue of control mouse treated with saline water, and colitis mouse with inflammation induced by dextran sulfate sodium after 10 days colitis development. The H&E staining was repeated and reproduced for in 5 mice. j, Measured serotonin concentration in the colon tissue of control and DSS mice using ELISA assay. P value 0.0171. k. Layout of the NeuroString sensor for serotonin sensing in the pig colon. The sensor fabrication process is the same as illustrated in Extended Data Fig. 1 except using a large polyimide sheet (12 inch by 12 inch) as a substrate. l, Scheme and photo showing the multiple-site serotonin measurement in the intestine of a pig by NeuroString. m, Simultaneous serotonin sensing in different segments of the intestinal tract by multiple channel NeuroString. n-o, Drug-induced luminal serotonin concentration change using fluoxetine (SSRI), methylene blue (MB), fluoxetine (SSRI) + methylene blue (MB), and saline as control (n = 6 pigs). P value: SSRI (0.5553), MB (0.3567); and SSRI+MB (0.0099). P values are calculated by paired two-tailed Student’s t-test: ns P > 0.05; *P ≤ 0.05; **P ≤ 0.01; ***P ≤ 0.001.
Supplementary Material
Acknowledgments:
This work was partly supported by the Stanford Bio-X Interdisciplinary Initiatives Seed Grants Program (IIP Award) and the Wu Tsai Neuroscience Institute Big Idea Award. Part of this work was performed at the Stanford Nano Shared Facilities (SNSF), supported by the National Science Foundation under award ECCS-1542152. X.C. and L.Y. is partially supported by National Institutes of Health grants R01DA045664, R01MH116904 and R01HL150566, and X.C. is also supported by Firmenich Next Generation Fund. Y.L. is supported by National Science Scholarship (A*STAR, Singapore). Part of the electrochemical measurement experiments during revision was conducted at Michigan State University. The authors thank Drs. Nick G Hollon and Xin Jin from the Salk Institute for their help with the fast-scan cyclic voltammetry technique; Dr. Grant Hennig (University of Vermont) for the design and use of Volumetry software; Drs. Samuel Baker and Anqi Zhang for the help on pig animal surgery; Dr. Subhamoy Das from the Julia Kaltschmidt lab for the help on the colonic motility assay setup; Theodore Z Gao for comments on the manuscript; and Yuchi Tsao, Dr. Shucheng Chen, and Yunzhi Liu for help on materials characterization.
Footnotes
Competing interests: J.L., Y.L., and Z.B. are inventors on a patent application (no. 63/085,720) submitted by the Board of Trustees of Stanford University.
Data availability
The datasets generated during and/or analysed in this study are available from the corresponding author upon reasonable request. The method and source code for the ex vivo gut segment diameter mapping recipe is provided in supplementary information. The source data are provided with this paper.
References:
- 1.Patriarchi T et al. Ultrafast neuronal imaging of dopamine dynamics with designed genetically encoded sensors. Science 360, (2018). [DOI] [PMC free article] [PubMed] [Google Scholar]
- 2.Nakatsuka N et al. Aptamer–field-effect transistors overcome Debye length limitations for small-molecule sensing. Science 362, 319–324 (2018). [DOI] [PMC free article] [PubMed] [Google Scholar]
- 3.Kishida KT et al. Subsecond dopamine fluctuations in human striatum encode superposed error signals about actual and counterfactual reward. Proceedings of the National Academy of Sciences of the United States of America 113, 200–205 (2016). [DOI] [PMC free article] [PubMed] [Google Scholar]
- 4.Wise RA Dopamine, learning and motivation. Nature Reviews Neuroscience vol. 5 483–494 (2004). [DOI] [PubMed] [Google Scholar]
- 5.A review of the role of serotonin receptors in psychiatric disorders - Naughton - 2000 - Human Psychopharmacology: Clinical and Experimental - Wiley Online Library. . [DOI] [PubMed]
- 6.Hyman SE & Malenka RC Addiction and the brain: The neurobiology of compulsion and its persistence. Nature Reviews Neuroscience 2, 695–703 (2001). [DOI] [PubMed] [Google Scholar]
- 7.Russo SJ & Nestler EJ The brain reward circuitry in mood disorders. Nature Reviews Neuroscience vol. 14 609–625 (2013). [DOI] [PMC free article] [PubMed] [Google Scholar]
- 8.Cummings JL Depression and parkinson’s disease: A review. American Journal of Psychiatry 149, 443–454 (1992). [DOI] [PubMed] [Google Scholar]
- 9.Spohn SN & Mawe GM Non-conventional features of peripheral serotonin signalling-the gut and beyond. Nature Reviews Gastroenterology and Hepatology vol. 14 412–420 (2017). [DOI] [PMC free article] [PubMed] [Google Scholar]
- 10.Furness JB The enteric nervous system and neurogastroenterology. Nature Reviews Gastroenterology and Hepatology vol. 9 286–294 (2012). [DOI] [PubMed] [Google Scholar]
- 11.Marvin JS et al. An optimized fluorescent probe for visualizing glutamate neurotransmission. Nature Methods 10, 162–170 (2013). [DOI] [PMC free article] [PubMed] [Google Scholar]
- 12.Sun F et al. A Genetically Encoded Fluorescent Sensor Enables Rapid and Specific Detection of Dopamine in Flies, Fish, and Mice. Cell 174, 481–496.e19 (2018). [DOI] [PMC free article] [PubMed] [Google Scholar]
- 13.Robinson DL, Venton BJ, Heien MLAV & Wightman RM Detecting Subsecond Dopamine Release with Fast-Scan Cyclic Voltammetry in Vivo. Clinical Chemistry 49, 1763–1773 (2003). [DOI] [PubMed] [Google Scholar]
- 14.Hashemi P, Dankoski EC, Petrovic J, Keithley RB & Wightman RM Voltammetric detection of 5-hydroxytryptamine release in the rat brain. Analytical Chemistry 81, 9462–9471 (2009). [DOI] [PMC free article] [PubMed] [Google Scholar]
- 15.Schwerdt HN et al. Long-term dopamine neurochemical monitoring in primates. doi: 10.1073/pnas.1713756114. [DOI] [PMC free article] [PubMed]
- 16.Taylor IM et al. Enhanced dopamine detection sensitivity by PEDOT/graphene oxide coating on in vivo carbon fiber electrodes. Biosensors and Bioelectronics 89, 400–410 (2017). [DOI] [PMC free article] [PubMed] [Google Scholar]
- 17.Clark JJ et al. Chronic microsensors for longitudinal, subsecond dopamine detection in behaving animals. Nature Methods 7, 126–129 (2010). [DOI] [PMC free article] [PubMed] [Google Scholar]
- 18.Moran RJ et al. The Protective Action Encoding of Serotonin Transients in the Human Brain. Neuropsychopharmacology 43, 1425–1435 (2018). [DOI] [PMC free article] [PubMed] [Google Scholar]
- 19.Bang D et al. Sub-second Dopamine and Serotonin Signaling in Human Striatum during Perceptual Decision-Making. Neuron 108, 999–1010.e6 (2020). [DOI] [PMC free article] [PubMed] [Google Scholar]
- 20.Chung HU et al. Binodal, wireless epidermal electronic systems with in-sensor analytics for neonatal intensive care. Science 363, (2019). [DOI] [PMC free article] [PubMed] [Google Scholar]
- 21.Wang S et al. Skin electronics from scalable fabrication of an intrinsically stretchable transistor array. Nature 555, 83–88 (2018). [DOI] [PubMed] [Google Scholar]
- 22.Lee S et al. Ultrasoft electronics to monitor dynamically pulsing cardiomyocytes. Nature Nanotechnology 14, 156–160 (2019). [DOI] [PubMed] [Google Scholar]
- 23.Park S et al. Self-powered ultra-flexible electronics via nano-grating-pattened organic photovoltaics. Nature 561, 516–521 (2018). [DOI] [PubMed] [Google Scholar]
- 24.Liu Y et al. Soft and elastic hydrogel-based microelectronics for localized low-voltage neuromodulation. Nature Biomedical Engineering 3, 58–68 (2019). [DOI] [PubMed] [Google Scholar]
- 25.Hong G & Lieber CM Novel electrode technologies for neural recordings. Nature Reviews Neuroscience vol. 20 330–345 (2019). [DOI] [PMC free article] [PubMed] [Google Scholar]
- 26.Terem I et al. Revealing sub-voxel motions of brain tissue using phase-based amplified MRI (aMRI). Magnetic Resonance in Medicine 80, 2549–2559 (2018). [DOI] [PMC free article] [PubMed] [Google Scholar]
- 27.Spencer KC et al. Characterization of Mechanically Matched Hydrogel Coatings to Improve the Biocompatibility of Neural Implants. Scientific Reports 7, 1–16 (2017). [DOI] [PMC free article] [PubMed] [Google Scholar]
- 28.Schwerdt HN et al. Subcellular probes for neurochemical recording from multiple brain sites. Lab on a Chip 17, 1104–1115 (2017). [DOI] [PMC free article] [PubMed] [Google Scholar]
- 29.Mazzuoli-Weber G & Schemann M Mechanosensitivity in the enteric nervous system. Frontiers in Cellular Neuroscience vol. 9 408 (2015). [DOI] [PMC free article] [PubMed] [Google Scholar]
- 30.Patel BA, Bian X, Quaiserová-Mocko V, Galligan JJ & Swain GM In vitro continuous amperometric monitoring of 5-hydroxytryptamine release from enterochromaffin cells of the guinea pig ileum. Analyst 132, 41–47 (2007). [DOI] [PubMed] [Google Scholar]
- 31.Osorio N & Delmas P Patch clamp recording from enteric neurons in situ. Nature Protocols 6, 15–27 (2011). [DOI] [PubMed] [Google Scholar]
- 32.Bucher ES & Wightman RM Electrochemical Analysis of Neurotransmitters. Annual Review of Analytical Chemistry vol. 8 239–261 (2015). [DOI] [PMC free article] [PubMed] [Google Scholar]
- 33.Xu C, Wu F, Yu P & Mao L In Vivo Electrochemical Sensors for Neurochemicals: Recent Update. ACS Sensors vol. 4 3102–3118 (2019). [DOI] [PubMed] [Google Scholar]
- 34.Kinloch IA, Suhr J, Lou J, Young RJ & Ajayan PM Composites with carbon nanotubes and graphene: An outlook. Science vol. 362 547–553 (2018). [DOI] [PubMed] [Google Scholar]
- 35.Sun D et al. Electrodeposition synthesis of a NiO/CNT/PEDOT composite for simultaneous detection of dopamine, serotonin, and tryptophan. Sensors and Actuators, B: Chemical 259, 433–442 (2018). [Google Scholar]
- 36.Yang W et al. Enhancing electrochemical detection of dopamine: Via dumbbell-like FePt-Fe3O4 nanoparticles. Nanoscale 9, 1022–1027 (2017). [DOI] [PubMed] [Google Scholar]
- 37.Fernandes DM et al. Novel electrochemical sensor based on N-doped carbon nanotubes and Fe3O4 nanoparticles: Simultaneous voltammetric determination of ascorbic acid, dopamine and uric acid. Journal of Colloid and Interface Science 432, 207–213 (2014). [DOI] [PubMed] [Google Scholar]
- 38.Salinas-Hernández XI et al. Dopamine neurons drive fear extinction learning by signaling the omission of expected aversive outcomes. eLife 7, (2018). [DOI] [PMC free article] [PubMed] [Google Scholar]
- 39.Bertrand PP, Hu X, Mach J & Bertrand RL Serotonin (5-HT) release and uptake measured by real-time electrochemical techniques in the rat ileum. American Journal of Physiology - Gastrointestinal and Liver Physiology 295, (2008). [DOI] [PubMed] [Google Scholar]
- 40.Bertrand PP Real-time measurement of serotonin release and motility in guinea pig ileum. Journal of Physiology 577, 689–704 (2006). [DOI] [PMC free article] [PubMed] [Google Scholar]
- 41.PP B & RL B Serotonin release and uptake in the gastrointestinal tract. Autonomic neuroscience : basic & clinical 153, 47–57 (2010). [DOI] [PubMed] [Google Scholar]
- 42.Mazzuoli-Weber G & Schemann M Mechanosensitivity in the enteric nervous system. Frontiers in Cellular Neuroscience vol. 9 408 (2015). [DOI] [PMC free article] [PubMed] [Google Scholar]
- 43.Bertrand PP Real-time detection of serotonin release from enterochromaffin cells of the guinea-pig ileum. Neurogastroenterology and Motility 16, 511–514 (2004). [DOI] [PubMed] [Google Scholar]
- 44.Mawe GM & Hoffman JM Serotonin signalling in the gut-functions, dysfunctions and therapeutic targets. Nature Reviews Gastroenterology and Hepatology vol. 10 473–486 (2013). [DOI] [PMC free article] [PubMed] [Google Scholar]
- 45.Gershon MD & Tack J The Serotonin Signaling System: From Basic Understanding To Drag Development for Functional GI Disorders. Gastroenterology 132, 397–414 (2007). [DOI] [PubMed] [Google Scholar]
- 46.Okayasu I et al. A novel method in the induction of reliable experimental acute and chronic ulcerative colitis in mice. Gastroenterology 98, 694–702 (1990). [DOI] [PubMed] [Google Scholar]
- 47.Linden DR, Chen JX, Gershon MD, Sharkey KA & Mawe GM Serotonin availability is increased in mucosa of guinea pigs with TNBS-induced colitis. American Journal of Physiology - Gastrointestinal and Liver Physiology 285, 761–768 (2003). [DOI] [PubMed] [Google Scholar]
- 48.Padmanabhan P, Grosse J, Asad ABMA, Radda GK & Golay X Gastrointestinal transit measurements in mice with 99mTc-DTPA-labeled activated charcoal using NanoSPECT-CT. EJNMMI Research 3, (2013). [DOI] [PMC free article] [PubMed] [Google Scholar]
- 49.Singh MK & Bandyopadhyay D Design and synthesis of nanoporous perylene bis-imide linked metalloporphyrin frameworks and their catalytic activity. Journal of Chemical Sciences 128, 1–8 (2016). [Google Scholar]
- 50.Lin J et al. Laser-induced porous graphene films from commercial polymers. Nature Communications 5, 1–8 (2014). [DOI] [PMC free article] [PubMed] [Google Scholar]
- 51.Metscher BD Micro CT for comparative morphology: Simple staining methods allow high-contrast 3D imaging of diverse non-mineralized animal tissues. BMC Physiology 9, 1–14 (2009). [DOI] [PMC free article] [PubMed] [Google Scholar]
- 52.Roberts JG & Sombers LA Fast-Scan Cyclic Voltammetry: Chemical Sensing in the Brain and beyond. Analytical Chemistry vol. 90 490–504 (2018). [DOI] [PMC free article] [PubMed] [Google Scholar]
- 53.Howard CD, Li H, Geddes CE & Jin X Dynamic Nigrostriatal Dopamine Biases Action Selection. Neuron 93, 1436–1450.e8 (2017). [DOI] [PMC free article] [PubMed] [Google Scholar]
- 54.Clark JJ et al. Chronic microsensors for longitudinal, subsecond dopamine detection in behaving animals. Nature Methods 7, 126–129 (2010). [DOI] [PMC free article] [PubMed] [Google Scholar]
- 55.Stamford JA, Kruk ZL & Millar J Striatal dopamine terminals release serotonin after 5-HTP pretreatment: in vivo voltammetric data. Brain Research 515, 173–180 (1990). [DOI] [PubMed] [Google Scholar]
- 56.Swamy BEK & Venton BJ Carbon nanotube-modified microelectrodes for simultaneous detection of dopamine and serotonin in vivo. Analyst 132, 876–884 (2007). [DOI] [PubMed] [Google Scholar]
- 57.Jackson BP & Mark Wightman R Dynamics of 5-hydroxytryptamine released from dopamine neurons in the caudate putamen of the rat. Brain Research 674, 163–166 (1995). [DOI] [PubMed] [Google Scholar]
- 58.Tatem KS et al. Behavioral and locomotor measurements using an open field activity monitoring system for skeletal muscle diseases. Journal of Visualized Experiments (2014) doi: 10.3791/51785. [DOI] [PMC free article] [PubMed] [Google Scholar]
- 59.Lynch JJ, Castagné V, Moser PC & Mittelstadt SW Comparison of methods for the assessment of locomotor activity in rodent safety pharmacology studies. Journal of Pharmacological and Toxicological Methods 64, 74–80 (2011). [DOI] [PubMed] [Google Scholar]
- 60.Hoibian E, Florens N, Koppe L, Vidal H & Soulage CO Distal colon motor dysfunction in mice with chronic kidney disease: Putative role of uremic toxins. Toxins 10, (2018). [DOI] [PMC free article] [PubMed] [Google Scholar]
- 61.Okayasu I et al. A novel method in the induction of reliable experimental acute and chronic ulcerative colitis in mice. Gastroenterology 98, 694–702 (1990). [DOI] [PubMed] [Google Scholar]
- 62.Wirtz S et al. Chemically induced mouse models of acute and chronic intestinal inflammation. Nature Protocols 12, 1295–1309 (2017). [DOI] [PubMed] [Google Scholar]
- 63.Tainaka K et al. Chemical Landscape for Tissue Clearing Based on Hydrophilic Reagents. Cell Reports 24, 2196–2210.e9 (2018). [DOI] [PubMed] [Google Scholar]
- 64.Swaminathan M et al. Video imaging and spatiotemporal maps to analyze gastrointestinal motility in mice. Journal of Visualized Experiments 2016, e53828 (2016). [DOI] [PMC free article] [PubMed] [Google Scholar]
- 65.Spear ET et al. Altered gastrointestinal motility involving autoantibodies in the experimental autoimmune encephalomyelitis model of multiple sclerosis. Neurogastroenterology & Motility 30, e13349 (2018). [DOI] [PMC free article] [PubMed] [Google Scholar]
Associated Data
This section collects any data citations, data availability statements, or supplementary materials included in this article.
Supplementary Materials
Data Availability Statement
The datasets generated during and/or analysed in this study are available from the corresponding author upon reasonable request. The method and source code for the ex vivo gut segment diameter mapping recipe is provided in supplementary information. The source data are provided with this paper.