Abstract
Purpose:
Tebentafusp is a first-in-class bispecific fusion protein designed to target gp100 (a melanoma-associated antigen) through a high affinity T cell receptor (TCR) binding domain, and an anti-CD3 T cell engaging domain which redirects T cells to kill gp100-expressing tumor cells regardless of their intrinsic specificity. Here we report data from a multicentre Phase 1/2 trial of tebentafusp in metastatic melanoma (NCT01211262) focusing on the mechanism of action of tebentafusp.
Patients and Methods:
84 patients with advanced melanoma (n=61 cutaneous, n=19 uveal, n=4 other origin) received tebentafusp. Treatment efficacy and treatment-related AEs were assessed and coded, and biomarker assessments were performed for blood-derived and tumor biopsy samples obtained at baseline and on-treatment.
Results:
Tebentafusp was generally well tolerated and active in both metastatic Uveal melanoma (mUM) and metastatic Uveal melanoma (mCM) patients. A 65% 1-year overall survival rate was achieved for both patient cohorts. On-treatment cytokine measurements were consistent with the induction of IFNγ pathway-related markers in the periphery and tumor. Notably, tebentafusp induced an increase in serum CXCL10 (a T cell attractant), and a reduction in circulating CXCR3+ CD8+ T cells together with an increase in cytotoxic T cells in the tumor microenvironment. Furthermore, increased serum CXCL10 or the appearance of rash, (likely due to cytotoxic T cells targeting of gp100-expressing skin melanocytes) showed a positive association with patient survival.
Conclusions:
These data suggest that re-directing T cells using a gp100-targeting T cell receptor/anti-CD3 bispecific fusion protein may provide benefit to patients with metastatic melanoma. Furthermore, the activity observed in these two molecularly disparate melanoma classes hints at the broad therapeutic potential of tebentafusp.
Keywords: immunotherapy, tebentafusp, metastatic melanoma, cutaneous melanoma, uveal melanoma
Introduction
Re-activating the immune system with checkpoint inhibitors (CPI) to treat cancer has seen significant success in the last decade (1) and is established as one of the pillars of cancer treatment (2). However, many patients derive little benefit from CPI principally because of the lack of sufficient tumor-specific cytotoxic CD8+ T cells or insufficient tumor neo-antigenicity (3). Thus, new approaches that re-direct any cytotoxic T cell to attack cancer cells may be key to achieving broader efficacy. Less than 10 years after the approval of the first checkpoint inhibitor, the immuno-oncology field is now replete with novel approaches to engage the immune system to fight cancer (4,5).
Natural T cell responses are driven by interactions between the T cell receptor (TCR) and its peptide antigen presented by human leukocyte antigen (HLA) on the surface of a target cell (6). However, the TCR repertoire is limited by the thymic selection of T cells that recognize self-antigens with low affinity leading to anergy. To re-direct any T cell, regardless of its TCR specificity, antibody and TCR-based bispecifics that can activate T cells are being developed. Antibody-based bispecifics have demonstrated efficacy in hematologic tumors; however, the repertoire of antibody targets is limited to surface-expressed proteins and, thus, limited to targeting only 10% of the human proteome (7). Additionally, antibody-based therapeutics only target highly expressed proteins. ImmTAC (Immune-mobilizing monoclonal TCRs Against Cancer) are a new class of molecules designed to overcome these limitations. These bispecific fusion proteins, comprised of a soluble affinity-enhanced TCR and an anti-CD3 scFv, re-direct and activate T cells to peptide-HLA (pHLA) complexes on the target cell surface (4). As the majority of proteins are processed and presented on the surface of the cell as a pHLA complex, ImmTAC molecules could in principle be engineered to target almost the entire proteome (7). Tebentafusp, the first ImmTAC molecule to enter clinical testing, recognizes the gp100 peptide (pos280–288) presented on HLA-A*02:01 with picomolar affinity. gp100 is a lineage melanocytic antigen expressed in melanocytes and melanoma. The high affinity of tebentafusp for the pHLA target seen in preclinical studies enables cells with low cell surface levels of HLA-A-gp100280–288 to be detected: as few as five to ten epitopes are sufficient for tebentafusp to mount successful clearance of target cells in vitro (8,9). The anti-CD3 scFv effector domain of tebentafusp enables polyclonal activation of native T cells independently of their natural TCR specificity leading to the formation of an immune synapse and the killing of target cells (Supplementary Fig. 1) (8,10). The in vitro capability of tebentafusp to induce potent and selective killing of antigen-positive tumor was previously demonstrated (9,11). Furthermore, broad immune responses that extend beyond the induction of CD8+ T cell-mediated cytotoxicity were observed (8) and supported the progression of tebentafusp to Phase 1 clinical investigations.
Methods
Study design and participants
This first-in-human (FIH) study of tebentafusp was a multicenter, phase 1/2, open-label, dose-finding study to assess the safety, tolerability, and efficacy of tebentafusp (NCT01211262) in patients with stage IV or unresectable stage III melanoma, including cutaneous and uveal, who were resistant to standard treatment regimens or for whom no standard treatments existed. Additional key eligibility criteria included HLA-A*02 status, Eastern cooperative oncology group performance ≤ 1 as well as completed previous surgery, radiotherapy, systemic or experimental therapy.
The primary objectives of the trial were to evaluate the safety and tolerability of tebentafusp following weekly and daily dosing with the aim of establishing the maximum tolerated dose based on the occurrence of dose-limiting toxicity and to establish the recommended PhaseII dose (RP2D).
84 HLA-A2+ patients with advanced melanoma (n=61 cutaneous, n=19 uveal, n=4 other origin (acral, lentiginous (vulval), mucosal (rectal), and unknown primary)) received tebentafusp (additional baseline demographics are captured in Supplementary Table 1).
Procedures
The study assessed a weekly (Arm 1) and daily (Arm 2) dosing regimen for tebentafusp, each at a range of doses (Arm 1 (n=66): dose escalation, weight-based dosing from 5 – 900 ng/kg; dose expansion, 600 ng/kg converted to 50 mcg flat dose. Arm 2 (n=18): once daily × 4 days every 3 weeks; dose ranges from 10–50 mcg) (Supplementary Table 2).
Treatment efficacy was assessed using Response Evaluation Criteria In Solid Tumors (RECIST v1.1) and Kaplan–Meier survival. Treatment-related AEs were coded according to CTCAE v4.0. For ‘rash’, any grade, composite terms included rash; rash erythematous; rash generalized, rash macular; rash maculo-papular; rash papular; rash pruritic, rash pustular; rash vesicular.
Biomarker assessments were performed for blood-derived and tumor biopsy samples obtained at baseline and on-treatment. Briefly, peripheral blood mononuclear cells (PBMC) were stained for flow cytometric analysis and samples acquired with the BD Fortessa X20 HTS with BD FACSDiva v6. Compensation matrices and data analysis were performed with FlowLogic v7 software. The presence of cytokines/chemokines was assessed in serum samples using Luminex bead-based multiplexing kits and acquired xPONENT software version 4.2 SECURITY on a Magpix Instrument. Multiplex gene expression analysis was carried out on RNA isolated from tumor biopsies using NanoString technology. Tumor biospy samples were sectioned and stained by single-plex IHC for CD3, CD4, CD8, granzyme B or PD-L1 positivity. Images were acquired with either the Aperio (Leica Microsystems Ltd) or the Pannoramic MIDI (3D HISTECH) whole slide scanner and analysed using HALO™ software. Additional details of the procedure are included in the supplementary material.
Outcomes
Treatment efficacy was assessed using RECIST v1.1 and Kaplan–Meier survival. Overall survival (OS) was measured from the start of treatment to time of death. Patients alive at the time of the analysis were censored on the last date they were known to be alive. Treatment-related AEs were coded according to CTCAE v4.0. To explore tebentafusp effects on peripheral cytokine/chemokine profiles and T cell number and phenotype, markers in serum and PBMC samples were analysed in baseline and on-treatment samples. T cell infiltration and gene expression profile was assessed comparing baseline and on-treatment tumour biopsy analysis.
Statistical analysis
Statistical analyses were performed as described in the figure legends. Survival analysis was carried out using Kaplan–Meier curves (R package survminer) and log-rank test was used to assess differences between the survival curves. Univariate Cox proportional-hazards methods were used to model the prognostic importance of potential predictors of survival. Fisher’s exact test was used to assess association of biomarker response with the maximum % reduction in the sum of longest diameters (SLD) of tumor measurements from baseline. Spearman’s correlations were used to measure the association between different types of biomarker responses. Differences in percentage of a given phenotypic subpopulation on-treatment relative to baseline were calculated by Wilcoxon signed rank test for paired data. Nanostring tumor gene expression analysis comparing the log2 fold change between baseline and early post-dose samples between patient groups using t-tests. The differential genes (p<0.05) were then accessed for enrichment of 21 Nanostring pre-defined categories, using hypergeometric tests (12). Those genes that fell into these significantly enriched categories were then presented in a heatmap displaying the pre/post dose log2 fold change values. Heatmaps were constructed using the ComplexHeatmap R library (13).
Results
84 HLA-A2+ patients with advanced melanoma (n=61 mCM, n=19 mUM, n=4 other origin) were treated and evaluated: 31 patients with a weekly dose regimen of 5 900 ng/kg; and 18 patients with daily dose regimen of 10 – 50 mcg (for four consecutive days every three weeks). Repeat dosing with tebentafusp continued as long as, in the opinion of the investigator, the patient was deriving clinical benefit and the benefit–risk ratio remained favorable. In addition, 35 patients were treated with weekly doses of 600 ng/kg or 50 mcg with no patient experiencing dose limiting toxicity (DLT) during the first 8 days after treatment. At the 900 ng/kg dose, two patients experienced DLT, indicating that the maximum tolerated dose (MTD) had been exceeded. Three further patients were treated with the 600 ng/kg dose, with none reported with DLT. The MTD was identified as 600 ng/kg and RP2D for weekly dosing was set as 68 mcg 83 (99%) patients had ≥1 treatment-related adverse events (TRAE) of any grade (Table 1), while two patients (2.4%) experienced drug-related AEs leading to treatment discontinuation. The most common Grade ≥3 TRAE were rash (26% total, 20% Arm 1, 29% Arm 2) and lymphopenia (13% total, 14% Arm1, 11% Arm2), possibly mechanism-related, consistent with an on-target effect specific to melanocytic gp100 and peripheral T cell redirection.
Table 1:
Most frequent Treatment-related adverse events (TRAE; shown for both any grade and grades≥3) observed in FIH Phase 1 study of tebentafusp split by study arm and also shown as total number
| Treatment-related AEs, | Total (N=84) | |||||
|---|---|---|---|---|---|---|
| All grades n (%) | Grade ≥3 n (%) | |||||
| Arm 1 | Arm 2 | Total | Arm 1 | Arm 2 | Total | |
| Any treatment-related AE | 65 (98) | 18 (100) | 83 (99) | 27 (41) | 9 (50) | 36 (43) |
| CRSa | 50 (60)b | 0 (0) | ||||
| Other CRS-related AEc | 8 (10) | 8 (10) | ||||
| Rashd | 47 (71) | 10 (56) | 57 (68) | 13 (20) | 7 (39) | 22 (26) |
| Pruritus | 43 (65) | 16 (89) | 59 (70) | 0 (0) | 1 (6) | 1 (1) |
| Pyrexia | 35 (53) | 13 (72) | 48 (57) | 3 (4) | 1 (6) | 4 (5) |
| Periorbital edema | 30 (45) | 11 (61) | 41 (49) | 0 (0) | 0 (0) | 0 (0) |
| Fatigue | 35 (53) | 10 (56) | 45 (54) | 0 (0) | 0 (0) | 0 (0) |
| Nausea | 34 (51) | 10 (56) | 44 (52) | 0 (0) | 0 (0) | 0 (0) |
| Hypotension | 21 (32) | 7 (39) | 28 (33) | 6 (9) | 1 (6) | 7 (8) |
| Vomiting | 24 (36) | 10 (56) | 34 (40) | 0 (0) | 0 (0) | 0 (0) |
| Chills | 17 (26) | 9 (50) | 26 (31) | 0 (0) | 0 (0) | 0 (0) |
| Skin exfoliation | 19 (29) | 5 (28) | 24 (29) | 0 (0) | 0 (0) | 0 (0) |
| Dry skin | 18 (27) | 5 (28) | 23 (27) | 0 (0) | 0 (0) | 0 (0) |
| Headache | 16 (24) | 6 (33) | 22 (26) | 0 (0) | 0 (0) | 0 (0) |
| Erythema | 17 (26) | 2 (11) | 19 (23) | 0 (0) | 0 (0) | 0 (0) |
| Lymphopenia | 13 (20) | 4 (22) | 17 (20) | 9 (14) | 2 (11) | 11 (13) |
| Hypophosphatemia | 5 (8) | 3 (17) | 8 (10) | 3 (4) | 2 (11) | 5 (6) |
Cytokine release syndrome (CRS), which has been described with other T cell activating bispecifics, was evaluated post-hoc (Table 1) (14). The incidence of any grade CRS was 60%, the majority (45%) of which were generally mild with transient fever, fatigue, nausea, headache; 10.7% were moderate; while 3.6% were severe. No G4/G5 CRS was reported.
A 65% (95% CI: 48–78) 1-year overall survival (OS) rate was achieved with similar survival recorded for both mUM and mCM patients (Fig. 1). Overall response rate (ORR) by RECIST v1.1 (15) was 8.7% (six responses, all partial response; PR) with a further thirty eight patients (55%) categorized as stable disease of which five patients (7.2%) showed minor responses (Supplementary Table 3). For the six patients who achieved a partial response, 3 (16%) had mUM. The median duration of response was 10.5 months (range 3.7 – 28.2) and survival (censored at last contact) was 33.4 months (range 13.9 to 47.2).
Fig. 1:
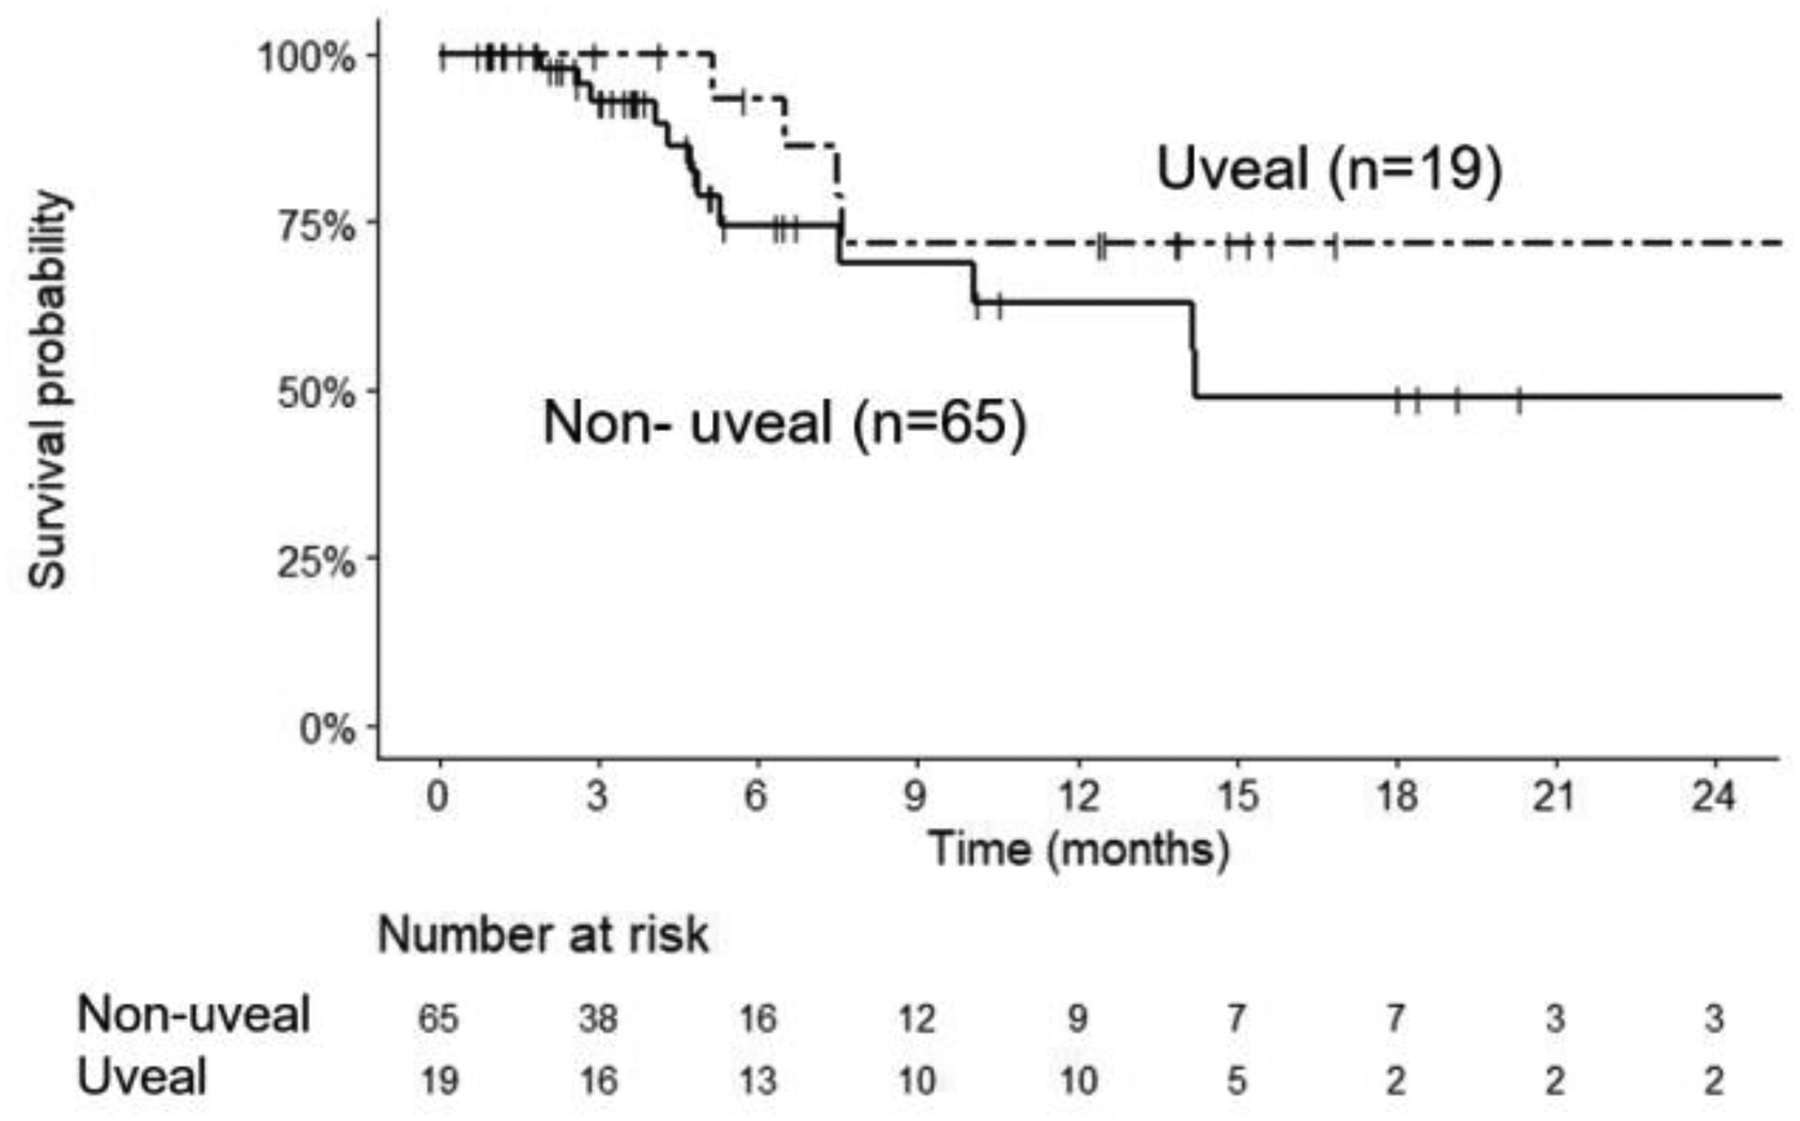
1-year Overall survival (OS) for Tebentafusp treated mUV and mCM patients
To examine the effect of tebentafusp on immune activation in metastatic melanoma patients and to assess whether immune activation translates into anti-tumor activity, pre- and on-treatment serum samples and peripheral blood mononuclear cells (PBMC), available from patient subsets, were used to determine cytokine/chemokine levels and the phenotype of circulating CD4+ and CD8+ T cell subpopulations and correlated with clinical outcomes. The majority of patients with biomarker data were treated with a weekly dose of 600 ng/kg or 50 mcg.
Changes in serum markers in response to tebentafusp were determined through multiplex analyses. Thirty-two markers of immune modulation, IFNγ-dependent pathways, chemokines as well as markers of angiogenesis, cell adhesion, and extracellular matrix (ECM) modulation were analyzed for up to 40 patients (13 mUM, 25 mCM, 1 lentiginous, 1 unknown primary) (Fig. 2a). In response to the first dose of tebentafusp, more than half of patients in the analyzed subset exhibited a treatment-induced increase of at least 2-fold from baseline for the following markers: CXCL10, CXCL11, CXCL9, MCP-1 IFNγ, IL-6, IL-10, IL-2, IL-15, IL-1RA, TNFα, GCSF, CTACK, HGF and IL-4, whereas other markers including IL-17, IL-5, IL-1b, IL-12p70, and GMCSF showed negligible detectable changes in most (≥ 90 %) patients. The five markers with the greatest magnitude of treatment-induced increase included the interferon-inducible chemokines CXCL10 (median 66-fold, range 414-fold), and CXCL11 (median 7-fold, range 120-fold), as well as IL-2, IL-6, and IL-10. Across all the serum markers analysed, CXCL10 showed the greatest increase in the majority of patients analysed in both mUM and mCM.
Fig. 2: Tebentafusp induced a pharmacodynamic response in multiple peripheral immune markers.
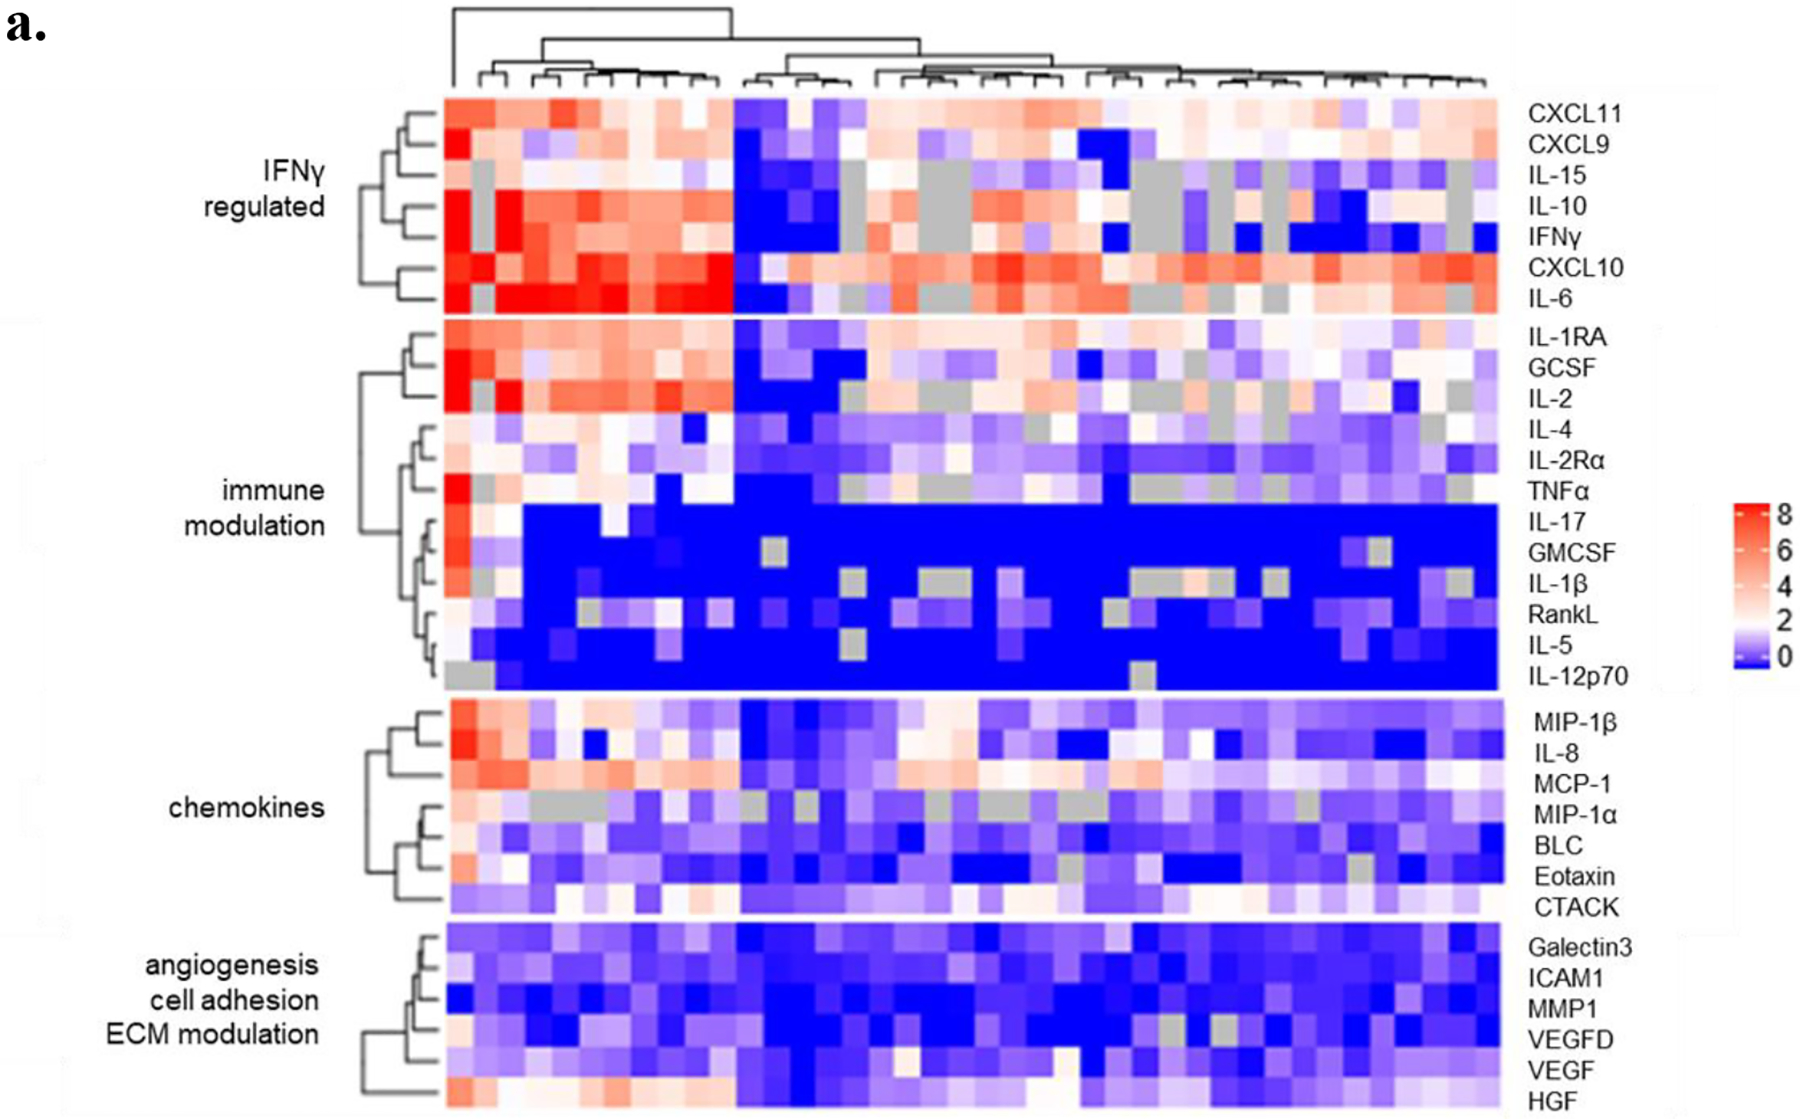
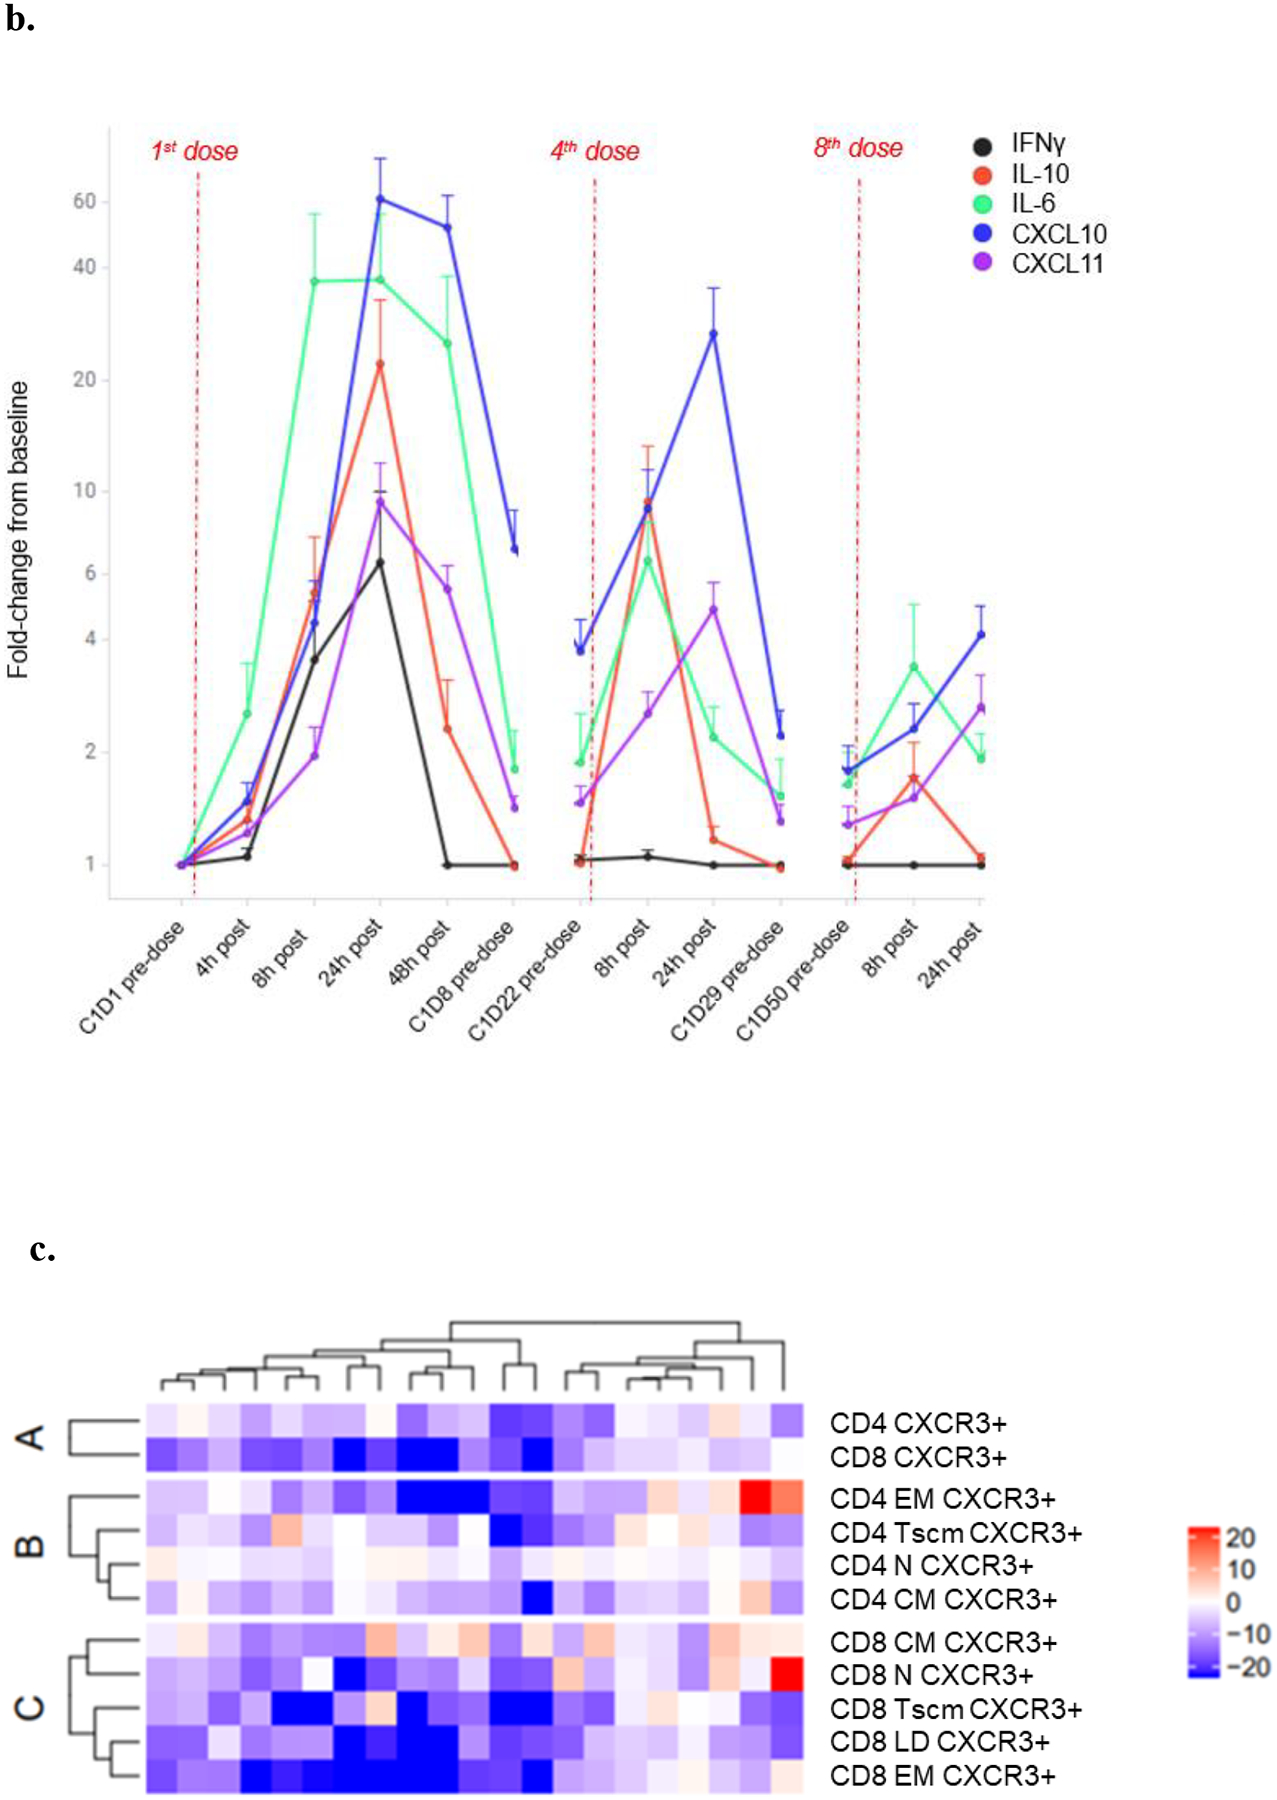
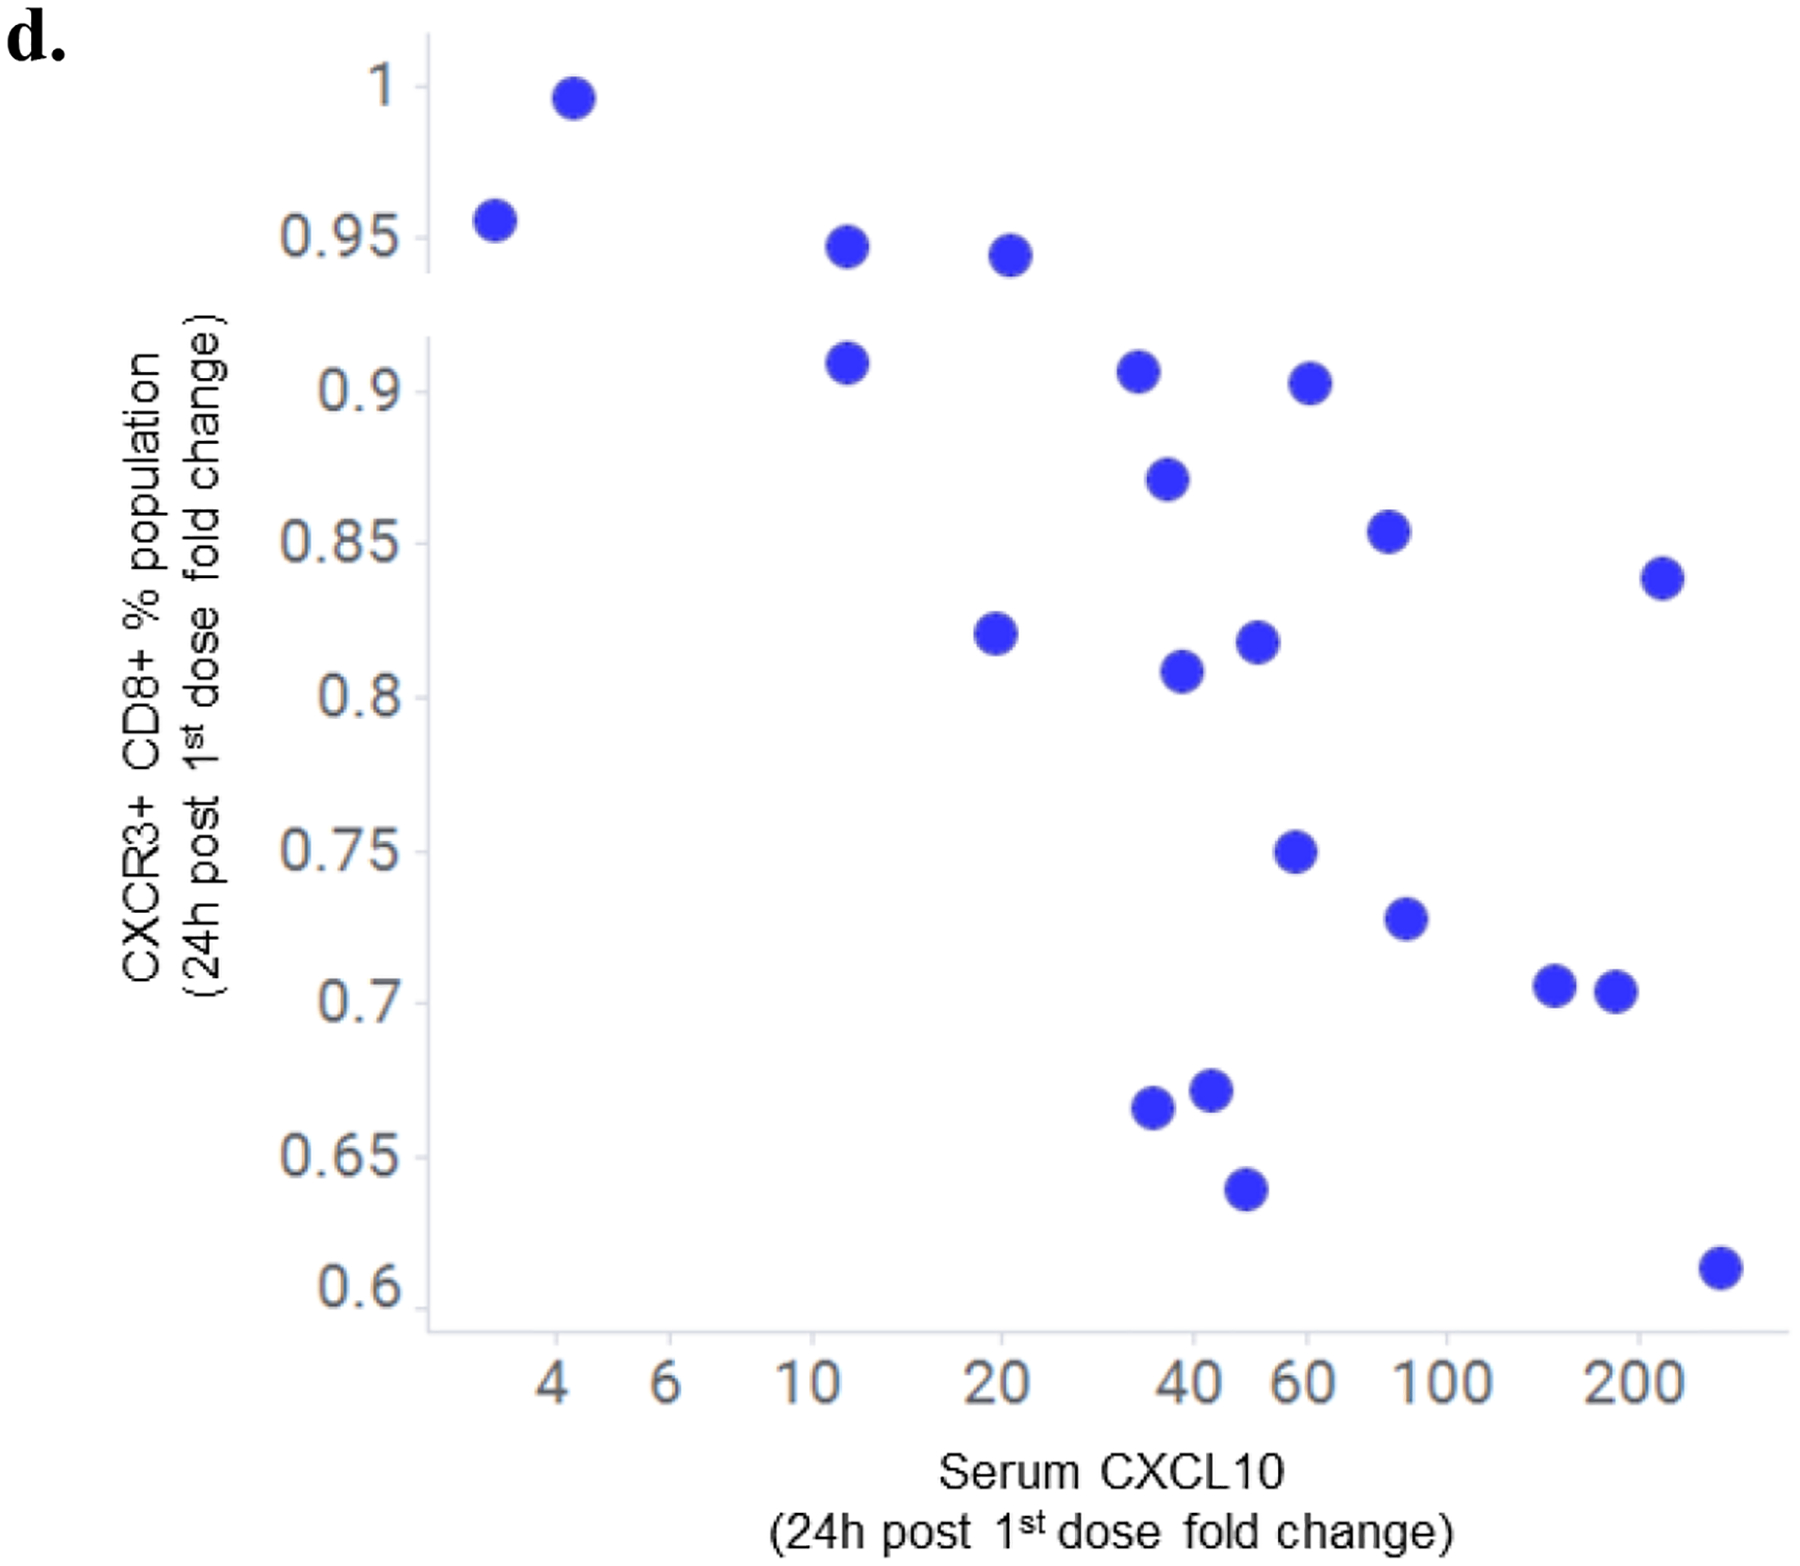
a. Maximal post-dose (log2) fold-change, relative to baseline concentration, in response to first dose in serum markers in a subset of 40 patients: IL-8, MMP-1, CXCL10, MCP-1, VEGF, BLC, IL-1RA, Galectin 3, MIP-1α, MIP-1β, IL-4, IL-17, GM-CSF, IL-2 Rα, RANK L, CXCL9, IL-5, G-CSF, IL-12 p70, ICAM-1, CXCL11, HGF, VEGF-D, CTACK, Eotaxin (n=40); IFNγ, TNFα, IL-1β, IL-2, IL-6, IL-10 and IL-15 (n=31/40). (ECM, extracellular matrix).
b. Temporal profile of post 1st, 4th and 8th dose fold-change response in IFNγ ( ), IL-10 (
 ), IL-6 (
 ), CXCL10 (
 ) and CXCL11 (
 ) in a subset of 15 patients treated weekly with 600 ng/kg/ 50 mcg tebentafusp. Plots represents mean ± standard error of the mean [SEM]
c. Percentage differences in CXCR3+ CD4+ and CD8+ parent populations (A), CD4+ subsets (B) and CD8+ subsets (C) at ~24 h post 1st dose tebentafusp compared with baseline. Heatmaps constructed using the ComplexHeatmap R library(13). N, naïve; EM, effector memory; CM, central memory; Tscm, stem-cell memory T cell; and LD, late differentiated effector memory.
d. Correlation of fold increase in serum CXCL10 with fold decrease in peripheral CXCR3+ CD8+ cell population 24 h following first dose of tebentafusp (Spearman R= −0.66; p=0.00104; n=21).
Temporal analysis showed the induction of serum cytokines to be transient, reaching maximal levels 8–24 h post-dose, with the profile returning toward baseline levels prior to the next dose, while notably CXCL10 remained elevated relative to baseline levels (Fig. 2b). The induction of cytokines was attenuated after repeated weekly dosing, suggestive of a tachyphylactic immune response (Fig. 2b).
Given previous in vitro data demonstrating tebentafusp induced redirection and activation of effector and memory cells from both CD8+ and CD4+ T cell populations (8), and together with the observation here that the most pronounced serum pharmacodynamic impact of tebentafusp was an increase in chemokine CXCL10, we hypothesized that tebentafusp treatment would preferentially redirect CD4+ and CD8+ T cell subsets expressing the cognate receptor, CXCR3. This chemoattractant receptor has a key role in the trafficking of Th1 and CD8+ T cells to peripheral sites of Th1-type inflammation and establishing the Th1 amplification loop mediated by IFNγ and the IFNγ-inducible CXCR3 ligands (16).
Immunophenotyping analysis was performed on PBMC samples from 22 patients (11 mUM, 10 mCM, 1 unknown primary). Analysis of on-treatment PBMC samples showed that there was a relative reduction in the prevalence of CXCR3+ immune cell populations that was more evident in CD8+ versus CD4+ populations (Fig. 2c); consistent with their higher baseline CXCR3 expression levels (Supplementary Fig. 2). On-treatment response of CXCR3+ CD8+ subsets was compared at 8h, 24h, and 48h post 1st dose. The largest relative decrease at 24 h was observed for memory CD8+ T cell subsets, which was sustained at 48h (Supplementary Fig.3).
Linking the observed marked tebentafusp-induced pharmacodynamic changes in CXCL10 and CXCR3+ CD8+ T cells, we found a greater increase in serum CXCL10 was associated with a greater transient reduction in peripheral CXCR3+ CD8+ T cells at all three time points examined, with the strongest association at 24 h after first treatment (Fig. 2d; R= −0.66, p=0.00104). Within the CXCR3+ CD8+ T cell pool, an increase in serum CXCL10 was associated with concomitant reduction in cells with an effector memory phenotype (EM; p=0.03, 0.007, 0.02, and LD/TEMRA; p=0.02, 0.03, 0.003) at 8 h, 24 h, and 48 h (Supplementary Table 4). In contrast, for memory CD4+ T cells, significant correlations with increased CXCL10 were only observed at the later time points of 24 h (p=0.006) and 48 h (p=0.01) for EM and 48hr for CM (p=0.002) and Tscm (p=0.004). At 24 h post first treatment, generally reflective of maximal temporal change, the reduction in peripheral CXCR3+ CD8+ EM cells also correlated with serum increase in the other IFNγ-inducible CXCR3 receptor ligands CXCL11 (p=0.04) and CXCL9 (p=0.008) (Supplementary Table 4). In contrast, no relationship was evident for other tebentafusp-induced serum markers that are known chemoattractants for B cells (BLC), eosinophils (Eotaxin), and neutrophils (IL-8).
To assess changes in T cells in the tumor micro-environment following tebentafusp treatment, paired pre- and post-treatment tumor biopsy immunohistochemistry (IHC) analyses (melanoma type: 1 mUM, 7–8 mCM, 1 lentiginous, 1 acral) revealed that most post treatment biopsy samples (taken 3–17 days after 1st tebentafusp treatment) had a relatively greater presence of T cell markers compared with pre-treatment (Fig. 3a). At least a two-fold increase in the number of intra-tumoral T cells was evident in most on-treatment biopsies relative to paired pre-treatment samples: CD3+ (n=8 out of 11 evaluable patients), CD4+ and CD8+ (n=5 out of 10 evaluable patients). Furthermore, an increase in CD8+ cells on-treatment was seen even in patients with relatively few intra-tumoral T cells prior to treatment, as exemplified by the mUM patient in the IHC paired dataset (Fig. 3b, Patient C). At least a two fold increase in PD-L1 expression was also observed in 5/9 patients (Fig. 3a), and treatment with tebentafusp did not induce loss of gp100 expression as evidenced by the median gp100 expression pre and post-treatment (median 54.1%, n=16 pre vs. 52.9%, n=25 post; Supplementary Fig. 4).
Fig. 3: Increased presence of T cells observed in on-treatment tumors.
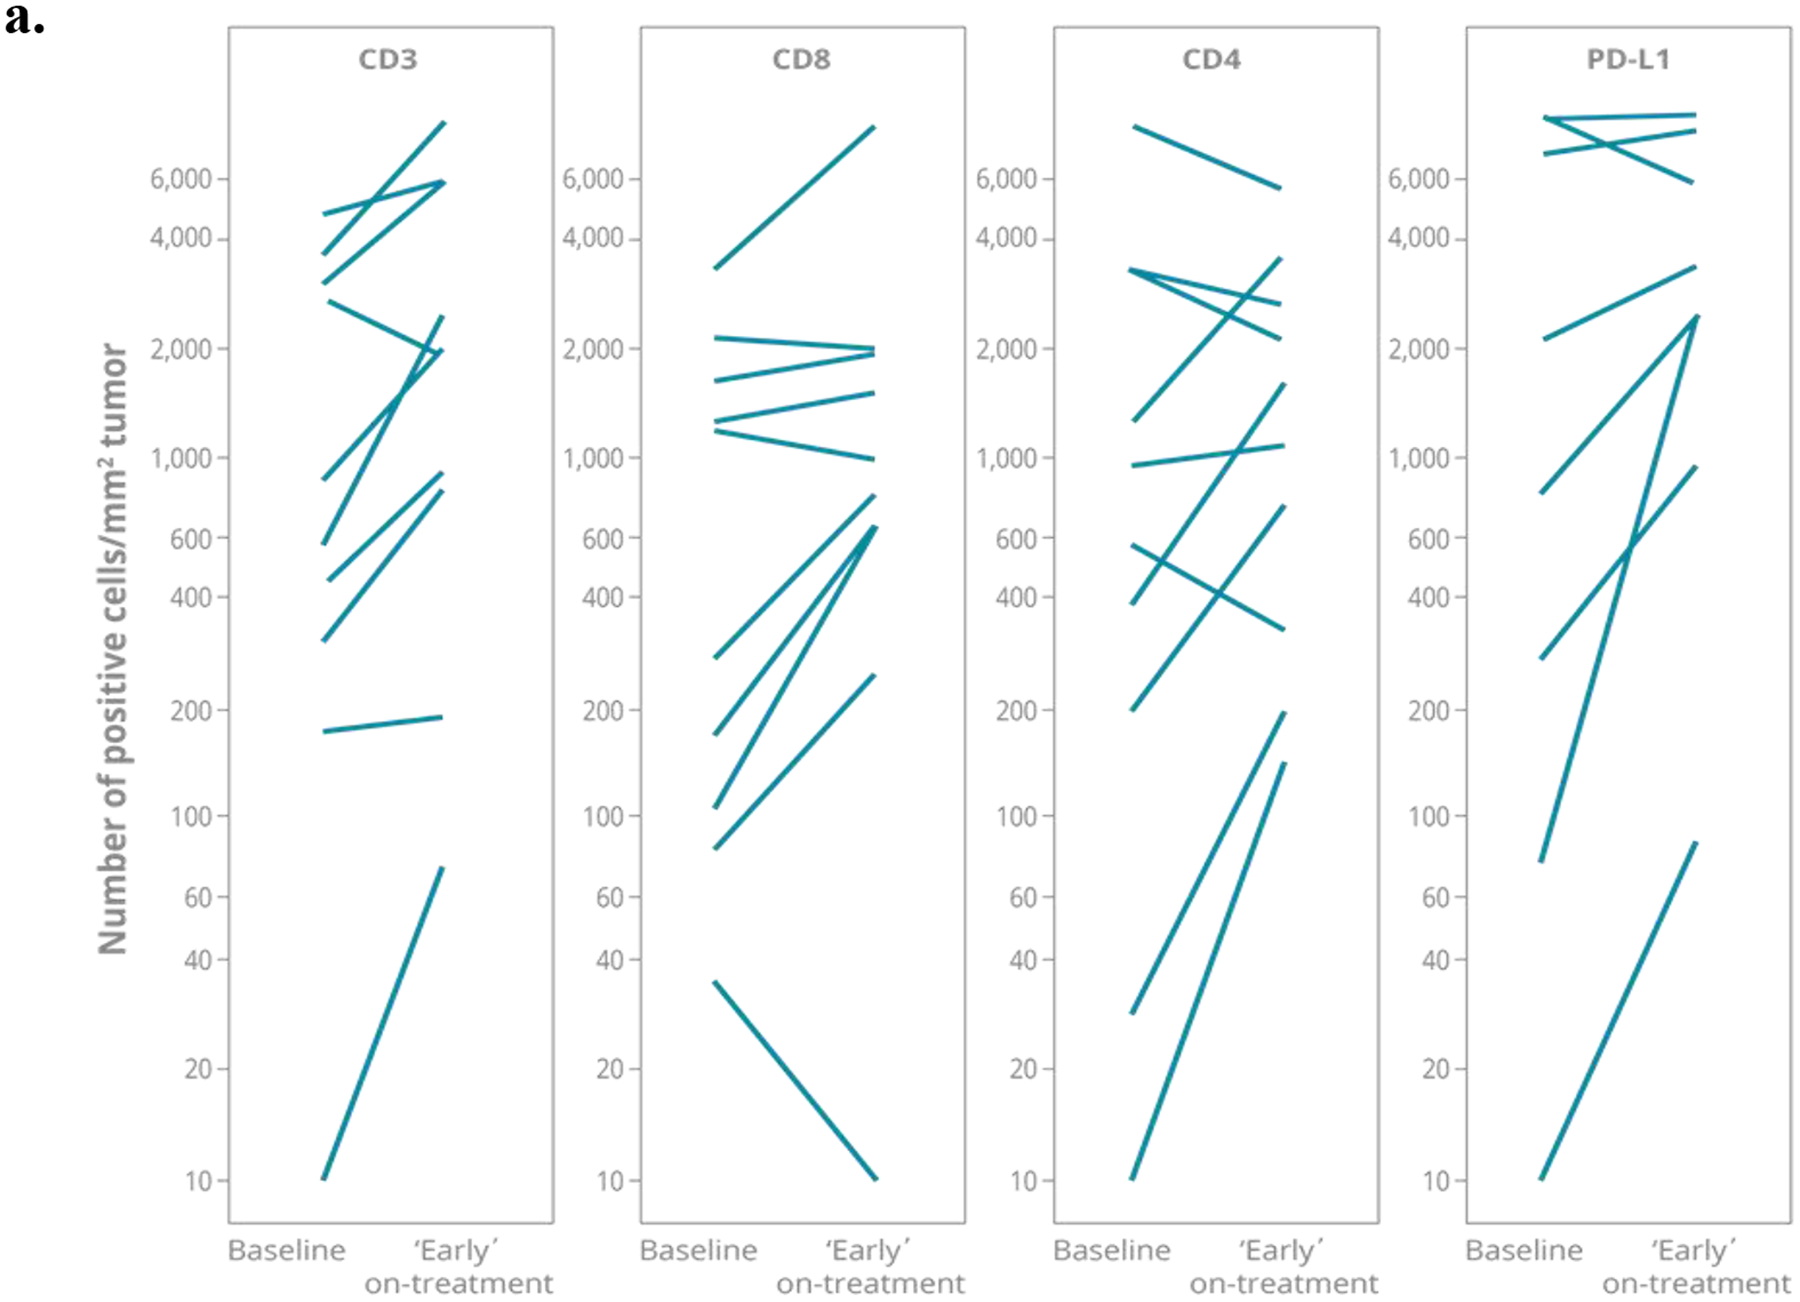
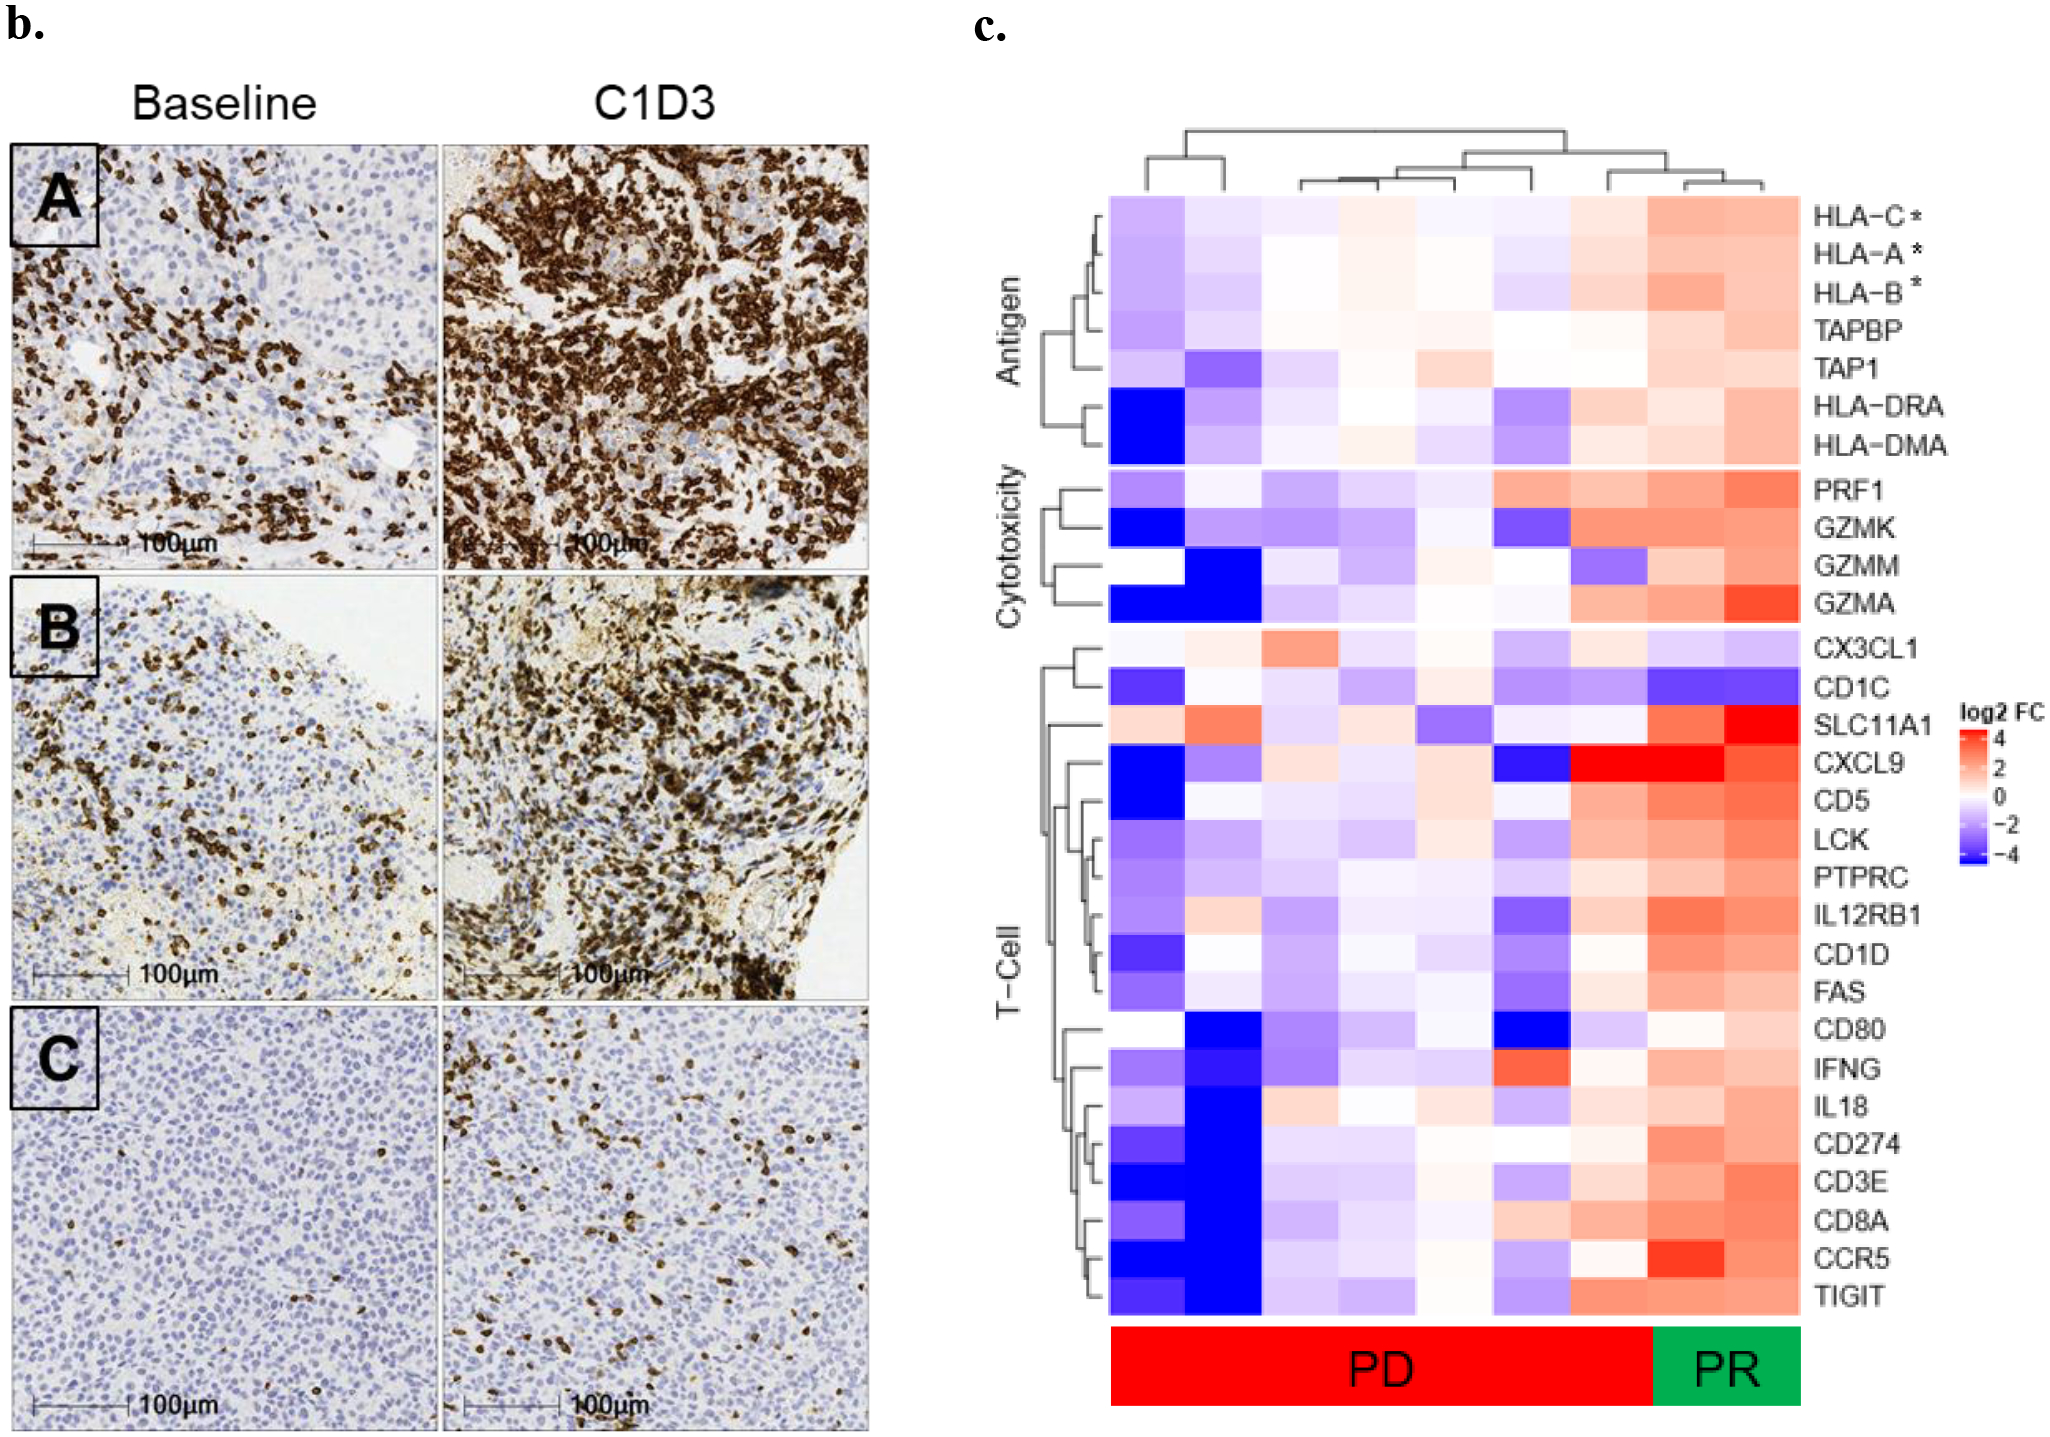
Image analysis quantified the expression of CD3+, CD4+, or CD8+ T cells together with PD-L1 expression. (a) Number of CD3+, CD8+, CD4+ and PD-L1+ cells/ mm2 tumor in paired baseline and early on-treatment biopsies (taken Cycle 1 Day 3–17) from up to 11 patients; line per patient. (b) Example immunohistochemistry (IHC) images of CD3+ staining in baseline and on-treatment (C1D3) biopsies from three patients: non-uveal Patient A (Rectus abdominal muscle) and B (L abdomen); uveal Patient C (abdominal wall). (c) Heatmap representation of genes identified from enrichment analysis with significantly different expression in on-treatment tumor biopsy (taken Cycle 1 Day 3–17) relative to baseline sample from partial response compared with progressive disease patients. These genes belonged to NanoString categories ‘Antigen processing’, ‘Cytotoxicity’ or ‘T cell function’ (*HLA-C, -A, -B also in Antigen Processing and Cytotoxicity category). Data scale represents log2 fold-change relative to associated baseline.
To assess the changes in the tumor immune micro-environment following tebentafusp more broadly, we analyzed gene expression from paired baseline and on-treatment biopsies. We compared within a subset of nine patients (melanoma type: 1 mUM, 6 mCM, 1 lentiginous, 1 acral), two responders (partial response) and seven with progressive disease. Enrichment analysis of significantly different genes comparing on-treatment changes in tumor biopsies from partial response compared with progressive disease patients found three categories of genes, defined a priori, to be significantly enriched: cytotoxicity (7/10 genes, p=0.00007), antigen processing (8/22, p=0.006), and T cell functions (16/72, p=0.029) (Fig. 3c).
In the study of mechanism of action for any therapy, biomarker analysis provides important insight and the association of biomarkers with positive clinical outcome adds tangible value from a clinical perspective. The relative relationships between measured peripheral biomarkers and clinical outcomes were examined.
Maximal transient increase in serum CXCL10 level was typically noted in response to the first dose of tebentafusp (Fig. 2b). Within this subset of patients, data suggest that a greater maximal fold increase was associated with both longer OS (Fig. 4a; p=0.00019) and greater tumor shrinkage (Fig. 4b; p= 0.0029). Higher treatment-induced levels of CXCL11, another CXCR3 ligand, were also associated with longer OS (Supplementary Fig. 5). For the transient reduction in circulating CXCR3+ CD8+ T cell population in response to first dose of tebentafusp, a greater decrease was associated with longer OS (Fig. 4c; p=0.0086) and greater tumor shrinkage (Fig. 4d; p=0.03).
Fig. 4: On-treatment biomarkers associated with clinical response.
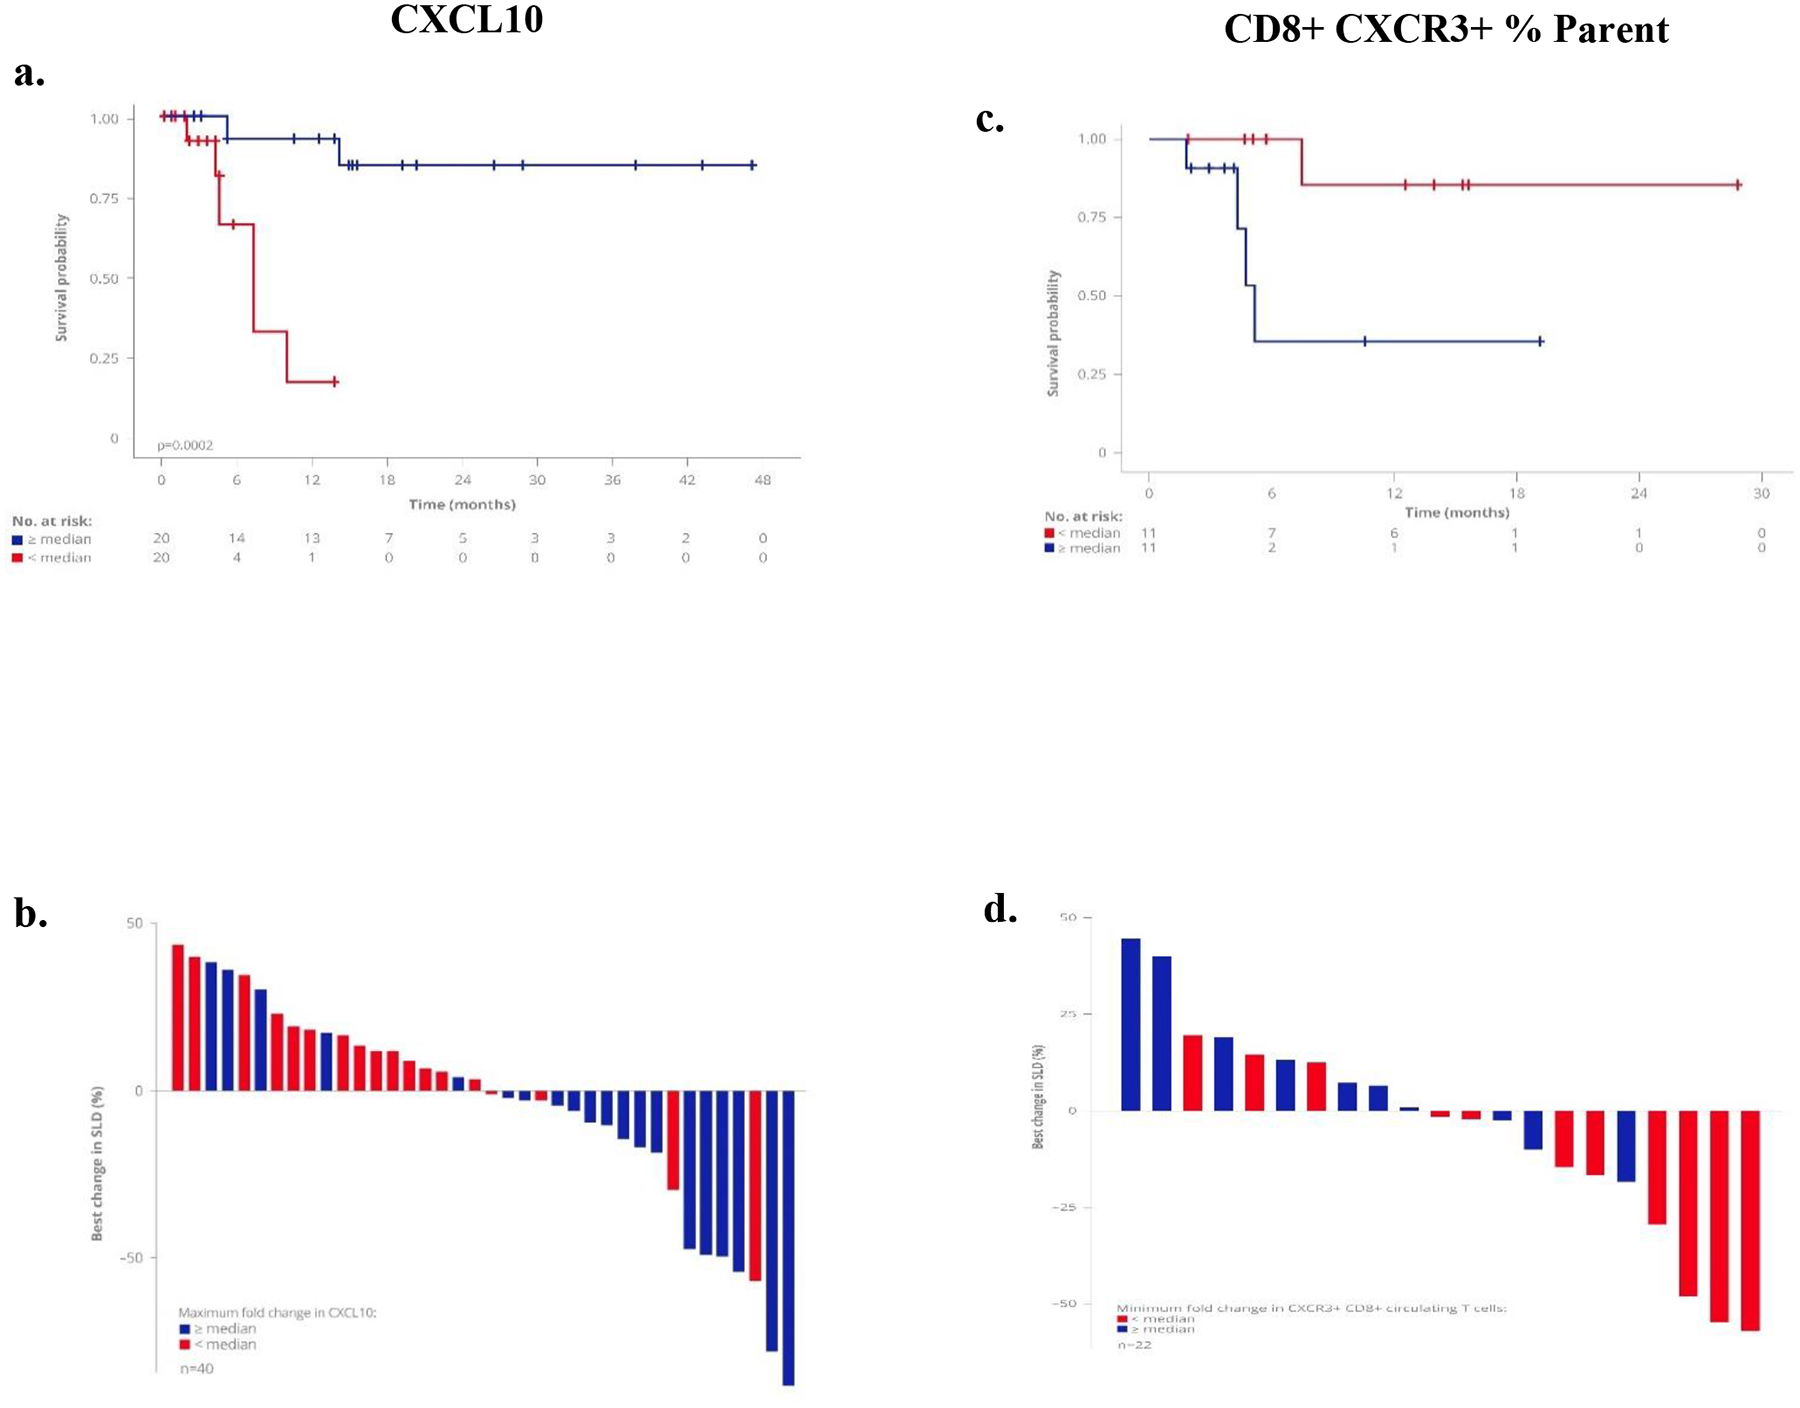
A greater maximal fold increase in serum CXCL10 level, and maximal fold decrease in circulating CXCR3+ CD8+ T cell population in response to first dose of tebentafusp, was associated with longer OS and tumour shrinkage. Kaplan–Meier survival of patients by: (a) serum CXCL10 (n=40, p=0.00019) and (c) CXCR3+ CD8+ T cell population (n=22, p=0.0086); both ≥median vs <median.
Waterfall plots depicting the maximum % reduction in the sum of longest diameters (SLD) of target tumor measurements from baseline for change in (b) serum CXCL10 (Fisher’s Exact test, p=0.0029) and (d) CXCR3+ CD8+ T cells (Fisher’s Exact test, p=0.03), both ≥median vs <median.
The majority of patients treated with tebentafusp developed rash within the first few days of dosing, consistent with cytotoxic T cells being re-directed to attack gp100-expressing melanocytes in the skin. Of the 84 patients treated, 69 (82%) experienced any ‘rash’ (refer to methods for composite terms Table 1) of any grade occurring within 21 days of first dose; these patients survived longer than those who did not have rash (p=0.003, Fig. 5a, Supplementary Table 5) and this was independent of absolute lymphocyte count and prior anti-PD1 therapy in a multivariate analysis. Patients with ‘rash’ had a relatively greater maximal on-treatment peripheral response: increase in serum CXCL10 level and decrease in CXCR3+ CD8+ T cell population (Fig. 5b & c).
Fig. 5: Rash associated with patient survival and elevated serum CXCR10.
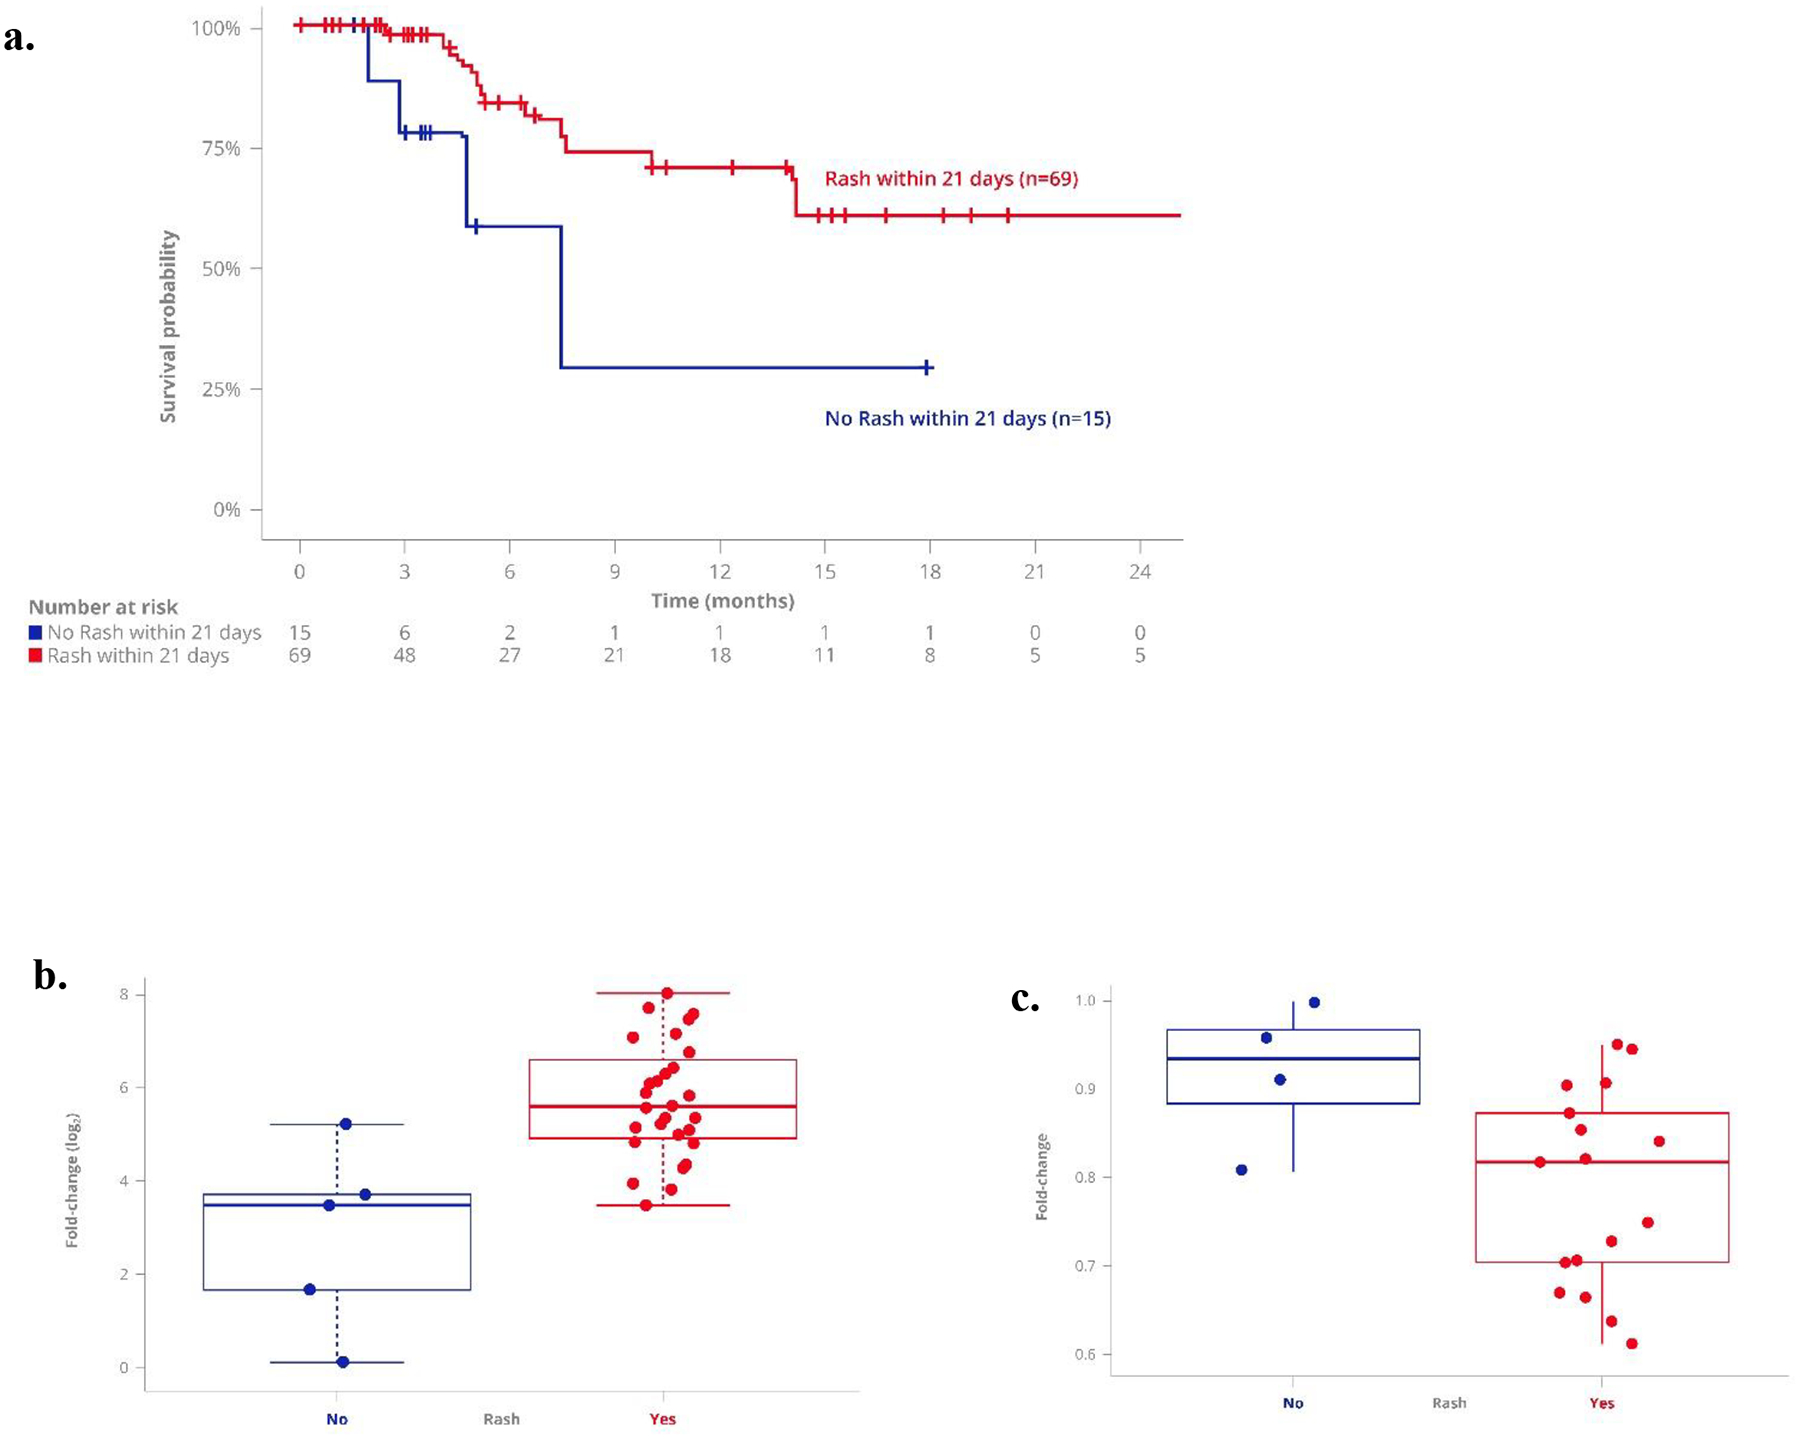
a. Kaplan–Meier survival of patients with any ‘rash’ (refer to methods) within 21 days of treatment start (n=69) versus no rash reported (n=15), (p=0.028). Patients with ‘rash’ have tendency for greater on-treatment maximal fold-change in (b) serum CXCL10 (‘rash’ n=34 vs. no rash n=6, p= 0.001) and (c) circulating CXCR3+CD8+ T cells (‘rash’ n=17 vs. no rash n=4, p= 0.04). Box plot representation of fold-change relative to baseline, showing median and quartiles for each group.
Discussion
Tumors escape the immune system through the cooperative processes of central and peripheral tolerance. Overcoming peripheral tolerance through CPI or administration of cytokines has delivered long-term patient benefit in the treatment of some neoplasms (1), and these agents are changing the landscape of cancer therapy. However, accumulating evidence suggests that efficacy of agents focused on breaking peripheral tolerance may be limited to inflamed tumors (those with tumor-infiltrating immune cells) and that patients with immune-deserted (or immunologically ignorant) tumors fail to have long-term benefit due to inadequate tumor-specific CD8+ T cells or insufficient neo-antigenicity (17).
Tebentafusp is the first soluble TCR bispecific (ImmTAC molecule) to demonstrate anti-tumor activity by bypassing central tolerance and redirecting polyclonal T cells to kill tumor cells expressing target antigens (4,9). Data presented here demonstrated tebentafusp monotherapy was well tolerated and active in mUM and mCM patients. the on-treatment response profile was consistent with the induction of IFNγ pathway related markers in the periphery and tumor. On-treatment increase in T cells within the TME, together with concomitant increase in peripheral IFNγ-inducible chemokines (CXCL9, CXCL10, and CXCL11) and reduced circulating CXCR3+ T cells, provide strong evidence for the mechanistic role of this chemoattractant axis in T cell redirection by tebentafusp.
The importance of CXCL10 recruitment of tumor-suppressive CXCR3+ T cells has been demonstrated in other solid cancer models (18,19) and high intratumoral concentration was associated with a higher lymphocytic infiltrate (18) and an improved survival in several malignancies, including metastatic melanoma (20–23). Similarly, data from HER2–CD3 bispecific pre-clinical murine studies have previously suggested a mechanistic role for CXCL10–CXCR3 axis in tumor response (24). A role of this axis in the sensitivity to anti-PD-1 therapy has also been indicated (25). In contrast to the relative lack of peripheral biomarkers of response identified for CPI treatments, data presented here suggest potential dynamic markers for tebentafusp.
Adverse effects from tebentafusp were consistent with its observed in vitro mechanism of action (4,11,26). For example, rash and pruritus (likely due to targeting T cells to gp100+ melanocytes) or cytokine-mediated AEs, such as fever, are expected for a bispecific such as tebentafusp. The temporal association between some of these AEs and key peripheral cytokines underscore the apparent mechanistic relationship. Furthermore, the occurrence of rash appeared associated with longer survival and related to a greater peripheral CXCL10 and CXCR3+ T cell response.
In the limited number of on-treatment tumor biopsies that were available, tebentafusp treatment was associated with increased numbers of CD4+ and CD8+ T cells. While numbers were small and evaluation was across both arms and tumor types, genes associated with T cell function, antigen processing, and cytotoxicity were significantly greater in biopsies from partial responders compared with those with progressive disease. This response was evident even in patients with low levels of tumor-infiltrating lymphocytes prior to treatment, including uveal melanoma, suggesting that tebentafusp may be useful broadly in the treatment of patients regardless of baseline tumor-infiltrating lymphocytes.
The anti-tumor activity observed for tebentafusp monotherapy (reduction in target tumor SLD and extended survival) in mUM patients within this trial is promising for this rare cancer with high unmet need (26). Uveal melanoma arises from melanocytes within the uveal tract of the eye (27,28) and metastasizes in half of patients, with 90% of these patients developing metastases to the liver (17,29). mUM has a poor prognosis with 10–40% 1-year survival from development of metastases (30). The limitations in the treatment options for mUM, with no universally recognized standardized treatment and no new medicines approved for this subset of melanoma patients in the past 30 years, is reflected in the failure to improve OS in the last 50 years (31).
Importantly, in contrast to mCM, mUM has a low tumor mutational burden and is relatively insensitive to CPI (32). Therefore, the anti-tumor activity observed within this trial with two molecularly diverse tumor types, suggest the possibility of the broad therapeutic potential of tebentafusp in tumors with a high mutational burden and sensitive to CPI (CM) and those with a low mutational burden, immunologically barren and insensitive to CPI (UM). Trials of tebentafusp in uveal melanoma patients are underway to confirm and extend these findings.
Supplementary Material
Translational relevance.
The use of immunotherapeutic approaches for the treatment of metastatic disease has had some success in a subset of tumor types. However, limitations of success associated with tumor mutational burden are now recognized. Metastatic uveal melanoma (mUM) has low mutational burden and consequently both lacks an immune response within the tumor and shows little response checkpoint inhibitor therapies. Indeed, mUM patients currently have few treatment options and have a poor prognosis with approximately 1 year median survival time after detection of metastases. Outcomes for these patients have not improved in decades and no new therapies have been approved for this subset of melanoma patients for more than 30 years.
Here we present data focusing on the mechanism of action of tebentafusp from a first-in-human study in which patients with previously treated advanced metastatic melanoma (both cutaneous and uveal) received a soluble affinity-enhanced T cell receptor (TCR) and an anti-CD3 scFv fusion protein designed to facilitate targeting of T cells to the tumor. Our results suggest that tebentafusp is well tolerated in both cancer cohorts and has clinically meaningful antitumor activity as a monotherapy. This is particularly impactful within the uveal melanoma cohort not only due to the absence of effective therapies but also as it suggests this therapy can enhance immune responses in previously immune inactive tumors. These early data support further investigation of tebentafusp as a promising new anticancer therapy for metastatic melanoma.
Acknowledgements
The investigators are grateful to the patients, their carers, and the study teams at participating sites for their support of this trial. The UK sites are supported by funding from Experimental Cancer Medicine Centre (ECMC) grants [Cancer Research UK, Department of Health (England), Chief Scientist’s Office (Scotland)]. MRM is supported by the NIHR Oxford Biomedical Research Centre. The views expressed are those of the authors and not necessarily those of the NIHR or the Department of Health and Social Care. We acknowledge everybody who contributed to the study including data acquisition, analysis and interpretation in particular Bent Jakobsen, Koustubh Ranade, David Berman, Yvonne McGrath, David Krige and Namir Hassan
Footnotes
Declaration of competing interests
Cheryl McAlpine, Antonella Vardeu, Emma Leach, Revashnee Naidoo, Sarah Stanhope, Sion Lewis, Jacob Hurst, and Ita O’Kelly are / have been employees of Immunocore, which could benefit from commercialization of these results. Mark Middleton and Mario Sznol have previously served on the scientific advisory board of Immunocore
References
- 1.Wilson RAM, Evans TRJ, Fraser AR, Nibbs RJB. Immune checkpoint inhibitors: new strategies to checkmate cancer. Clinical & Experimental Immunology 2018;191(2):133–48 doi 10.1111/cei.13081. [DOI] [PMC free article] [PubMed] [Google Scholar]
- 2.Ledford H Cancer treatment: The killer within. Nature 2014;508(7494):24–6 doi 10.1038/508024a. [DOI] [PubMed] [Google Scholar]
- 3.Darvin P, Toor SM, Sasidharan Nair V, Elkord E. Immune checkpoint inhibitors: recent progress and potential biomarkers. Experimental & Molecular Medicine 2018;50(12):165 doi 10.1038/s12276-018-0191-1. [DOI] [PMC free article] [PubMed] [Google Scholar]
- 4.Lowe KL, Cole D, Kenefeck R, I OK, Lepore M, Jakobsen BK. Novel TCR-based biologics: mobilising T cells to warm ‘cold’ tumours. Cancer treatment reviews 2019;77:35–43 doi 10.1016/j.ctrv.2019.06.001. [DOI] [PubMed] [Google Scholar]
- 5.Marshall HT, Djamgoz MBA. Immuno-Oncology: Emerging Targets and Combination Therapies. Frontiers in Oncology 2018;8(315) doi 10.3389/fonc.2018.00315. [DOI] [PMC free article] [PubMed] [Google Scholar]
- 6.Rossjohn J, Gras S, Miles JJ, Turner SJ, Godfrey DI, McCluskey J. T cell antigen receptor recognition of antigen-presenting molecules. Annu Rev Immunol 2015;33:169–200 doi 10.1146/annurev-immunol-032414-112334. [DOI] [PubMed] [Google Scholar]
- 7.de Souza JE, Galante PA, de Almeida RV, da Cunha JP, Ohara DT, Ohno-Machado L, et al. SurfaceomeDB: a cancer-orientated database for genes encoding cell surface proteins. Cancer Immun 2012;12:15. [PMC free article] [PubMed] [Google Scholar]
- 8.Boudousquie C, Bossi G, Hurst JM, Rygiel KA, Jakobsen BK, Hassan NJ. Polyfunctional response by ImmTAC (IMCgp100) redirected CD8(+) and CD4(+) T cells. Immunology 2017;152(3):425–38 doi 10.1111/imm.12779. [DOI] [PMC free article] [PubMed] [Google Scholar]
- 9.Liddy N, Bossi G, Adams KJ, Lissina A, Mahon TM, Hassan NJ, et al. Monoclonal TCR-redirected tumor cell killing. Nature medicine 2012;18(6):980–7 doi 10.1038/nm.2764. [DOI] [PubMed] [Google Scholar]
- 10.Bossi G, Buisson S, Oates J, Jakobsen BK, Hassan NJ. ImmTAC-redirected tumour cell killing induces and potentiates antigen cross-presentation by dendritic cells. Cancer immunology, immunotherapy : CII 2014;63(5):437–48 doi 10.1007/s00262-014-1525-z. [DOI] [PMC free article] [PubMed] [Google Scholar]
- 11.Harper J, Adams KJ, Bossi G, Wright DE, Stacey AR, Bedke N, et al. An approved in vitro approach to preclinical safety and efficacy evaluation of engineered T cell receptor anti-CD3 bispecific (ImmTAC) molecules. PLoS One 2018;13(10):e0205491 doi 10.1371/journal.pone.0205491. [DOI] [PMC free article] [PubMed] [Google Scholar]
- 12.Armitage P, Berry G, Matthews J. Statistical Methods in Medical Research. Wiley; 2002. [Google Scholar]
- 13.Gu Z, Eils R, Schlesner M. Complex heatmaps reveal patterns and correlations in multidimensional genomic data. Bioinformatics 2016;32(18):2847–9 doi 10.1093/bioinformatics/btw313. [DOI] [PubMed] [Google Scholar]
- 14.Lee DW, Gardner R, Porter DL, Louis CU, Ahmed N, Jensen M, et al. Current concepts in the diagnosis and management of cytokine release syndrome. Blood 2014;124(2):188–95 doi 10.1182/blood-2014-05-552729. [DOI] [PMC free article] [PubMed] [Google Scholar]
- 15.Eisenhauer EA, Therasse P, Bogaerts J, Schwartz LH, Sargent D, Ford R, et al. New response evaluation criteria in solid tumours: revised RECIST guideline (version 1.1). European journal of cancer (Oxford, England : 1990) 2009;45(2):228–47 doi 10.1016/j.ejca.2008.10.026. [DOI] [PubMed] [Google Scholar]
- 16.Groom JR, Luster AD. CXCR3 in T cell function. Experimental Cell Research 2011;317(5):620–31 doi 10.1016/j.yexcr.2010.12.017. [DOI] [PMC free article] [PubMed] [Google Scholar]
- 17.Marshall E, Romaniuk C, Ghaneh P, Wong H, McKay M, Chopra M, et al. MRI in the detection of hepatic metastases from high-risk uveal melanoma: a prospective study in 188 patients. Br J Ophthalmol 2013;97(2):159–63 doi 10.1136/bjophthalmol-2012-302323. [DOI] [PubMed] [Google Scholar]
- 18.Mulligan AM, Raitman I, Feeley L, Pinnaduwage D, Nguyen LT, O’Malley FP, et al. Tumoral lymphocytic infiltration and expression of the chemokine CXCL10 in breast cancers from the Ontario Familial Breast Cancer Registry. Clinical cancer research : an official journal of the American Association for Cancer Research 2013;19(2):336–46 doi 10.1158/1078-0432.ccr-11-3314. [DOI] [PMC free article] [PubMed] [Google Scholar]
- 19.Yang X, Chu Y, Wang Y, Zhang R, Xiong S. Targeted in vivo expression of IFN-gamma-inducible protein 10 induces specific antitumor activity. Journal of Leukocyte Biology 2006;80(6):1434–44 doi 10.1189/jlb.0306212. [DOI] [PubMed] [Google Scholar]
- 20.Bronger H, Singer J, Windmuller C, Reuning U, Zech D, Delbridge C, et al. CXCL9 and CXCL10 predict survival and are regulated by cyclooxygenase inhibition in advanced serous ovarian cancer. British journal of cancer 2016;115(5):553–63 doi 10.1038/bjc.2016.172. [DOI] [PMC free article] [PubMed] [Google Scholar]
- 21.Kondo T, Ito F, Nakazawa H, Horita S, Osaka Y, Toma H. High expression of chemokine gene as a favorable prognostic factor in renal cell carcinoma. J Urol 2004;171(6 Pt 1):2171–5 doi 10.1097/01.ju.0000127726.25609.87. [DOI] [PubMed] [Google Scholar]
- 22.Mullins IM, Slingluff CL, Lee JK, Garbee CF, Shu J, Anderson SG, et al. CXC chemokine receptor 3 expression by activated CD8+ T cells is associated with survival in melanoma patients with stage III disease. Cancer research 2004;64(21):7697–701 doi 10.1158/0008-5472.can-04-2059. [DOI] [PubMed] [Google Scholar]
- 23.Suyama T, Furuya M, Nishiyama M, Kasuya Y, Kimura S, Ichikawa T, et al. Up-regulation of the interferon gamma (IFN-gamma)-inducible chemokines IFN-inducible T-cell alpha chemoattractant and monokine induced by IFN-gamma and of their receptor CXC receptor 3 in human renal cell carcinoma. Cancer 2005;103(2):258–67 doi 10.1002/cncr.20747. [DOI] [PubMed] [Google Scholar]
- 24.Li J, Ybarra R, Mak J, Herault A, De Almeida P, Arrazate A, et al. IFNgamma-induced Chemokines Are Required for CXCR3-mediated T-Cell Recruitment and Antitumor Efficacy of Anti-HER2/CD3 Bispecific Antibody. Clinical cancer research : an official journal of the American Association for Cancer Research 2018;24(24):6447–58 doi 10.1158/1078-0432.ccr-18-1139. [DOI] [PubMed] [Google Scholar]
- 25.Chow MT, Ozga AJ, Servis RL, Frederick DT, Lo JA, Fisher DE, et al. Intratumoral Activity of the CXCR3 Chemokine System Is Required for the Efficacy of Anti-PD-1 Therapy. Immunity 2019;50(6):1498–512.e5 doi 10.1016/j.immuni.2019.04.010. [DOI] [PMC free article] [PubMed] [Google Scholar]
- 26.Damato BE, Dukes J, Goodall H, Carvajal RD. Tebentafusp: T Cell Redirection for the Treatment of Metastatic Uveal Melanoma. Cancers 2019;11(7) doi 10.3390/cancers11070971. [DOI] [PMC free article] [PubMed] [Google Scholar]
- 27.Damato B Progress in the management of patients with uveal melanoma. The 2012 Ashton Lecture. Eye (London, England) 2012;26(9):1157–72 doi 10.1038/eye.2012.126. [DOI] [PMC free article] [PubMed] [Google Scholar]
- 28.Krantz BA, Dave N, Komatsubara KM, Marr BP, Carvajal RD. Uveal melanoma: epidemiology, etiology, and treatment of primary disease. Clinical ophthalmology (Auckland, NZ) 2017;11:279–89 doi 10.2147/OPTH.S89591. [DOI] [PMC free article] [PubMed] [Google Scholar]
- 29.Lorenzo D, Piulats JM, Ochoa M, Arias L, Gutierrez C, Catala J, et al. Clinical predictors of survival in metastatic uveal melanoma. Japanese journal of ophthalmology 2019;63(2):197–209 doi 10.1007/s10384-019-00656-9. [DOI] [PubMed] [Google Scholar]
- 30.Khoja L, Atenafu EG, Suciu S, Leyvraz S, Sato T, Marshall E, et al. Meta-Analysis in Metastatic Uveal Melanoma to Determine Progression-Free and Overall Survival Benchmarks: an International Rare Cancers Initiative (IRCI) Ocular Melanoma study. Annals of oncology : official journal of the European Society for Medical Oncology 2019. doi 10.1093/annonc/mdz176. [DOI] [PubMed] [Google Scholar]
- 31.Carvajal RD, Schwartz GK, Tezel T, Marr B, Francis JH, Nathan PD. Metastatic disease from uveal melanoma: treatment options and future prospects. Br J Ophthalmol 2017;101(1):38–44 doi 10.1136/bjophthalmol-2016-309034. [DOI] [PMC free article] [PubMed] [Google Scholar]
- 32.Yarchoan M, Hopkins A, Jaffee EM. Tumor mutational burden and response rate to PD-1 inhibition. The New England journal of medicine 2017;377(25):2500–1 doi 10.1056/NEJMc1713444. [DOI] [PMC free article] [PubMed] [Google Scholar]
Associated Data
This section collects any data citations, data availability statements, or supplementary materials included in this article.


