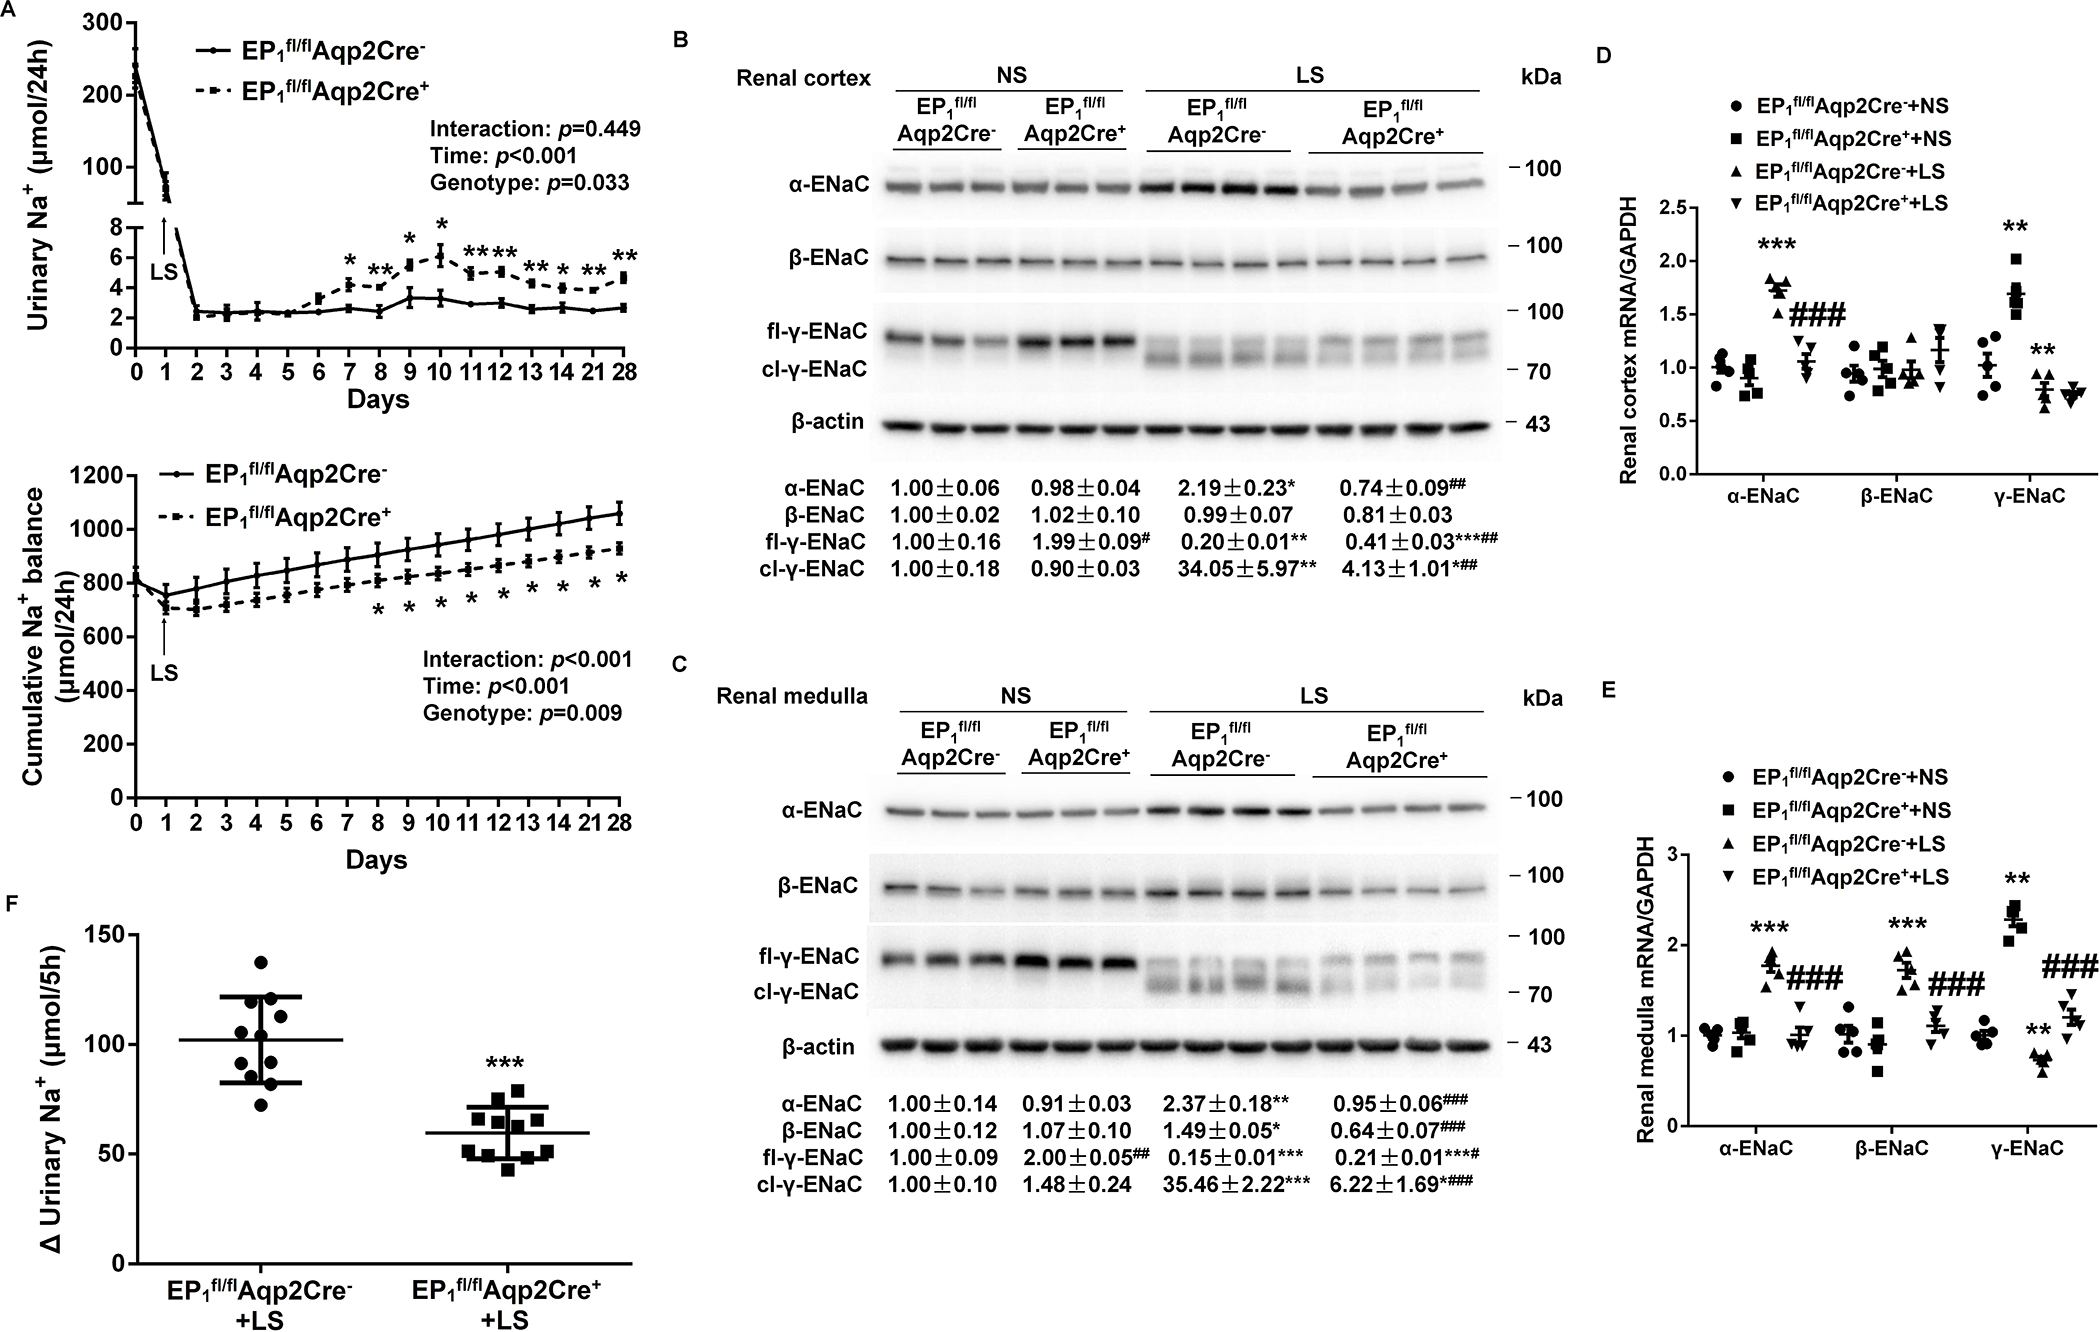
Figure 4.

Analysis of urinary Na+ excretion, cumulative Na+ balance, and renal epithelial sodium channel (ENaC) expression and activity in EP1fl/flAqp2Cre− and EP1fl/flAqp2Cre+ mice on a normal-Na+ (NS) or low-Na+ (LS) diet. (A) 24-h urinary Na+ excretion and cumulative Na+ balance in EP1fl/flAqp2Cre− and EP1fl/flAqp2Cre+ mice fed NS or LS diets. N = 10 per group. Data are mean ± SEM. *p<0.05, **p<0.01 vs. EP1fl/flAqp2Cre− at the corresponding time period (unpaired Student’s t test) (analysis of the interaction [time × genotype] by repeated-measures ANOVA). (B, C) Immunoblotting and densitometric analysis of ENaC subunits in the renal cortex (B) and medulla (C) in NS and LS treated EP1fl/flAqp2Cre− and EP1fl/flAqp2Cre+ mice. γ-ENaC-probed membrane was stripped and re-probed with anti-β-actin antibody. N = 3–4 per group for statistical analysis. Data are mean ± SEM. *p<0.05, **p<0.01, ***p<0.001 vs. NS; #p<0.05, ##p<0.01, ###p<0.001 vs. EP1fl/flAqp2Cre− (ANOVA with the Bonferroni test). (D, E) RT-qPCR analysis of ENaC subunits mRNA in the renal cortex (D) and medulla (E) with GAPDH as an internal control. N = 5 per group. Data are mean ± SEM. **p<0.01, ***p<0.001 vs. EP1fl/flAqp2Cre−+NS; ###p<0.001 vs. EP1fl/flAqp2Cre−+LS (ANOVA with the Bonferroni test). (F) In vivo ENaC activity as reflected by rapid natriuretic responses to amiloride. LS-loaded EP1fl/flAqp2Cre− and EP1fl/flAqp2Cre+ mice were all subjected to a single dose of amiloride (10 mg/kg by intraperitoneal injection) or vehicle treatment, followed by 5-h urine collection, and shown was the change of 5-h urinary Na+ excretion, determined by the delta value of 5-h urinary Na+ excretion of vehicle and amiloride treatment. N = 11 per group. Data are mean ± SEM. ***p<0.001 vs. EP1fl/flAqp2Cre−+LS (unpaired Student’s t test).
