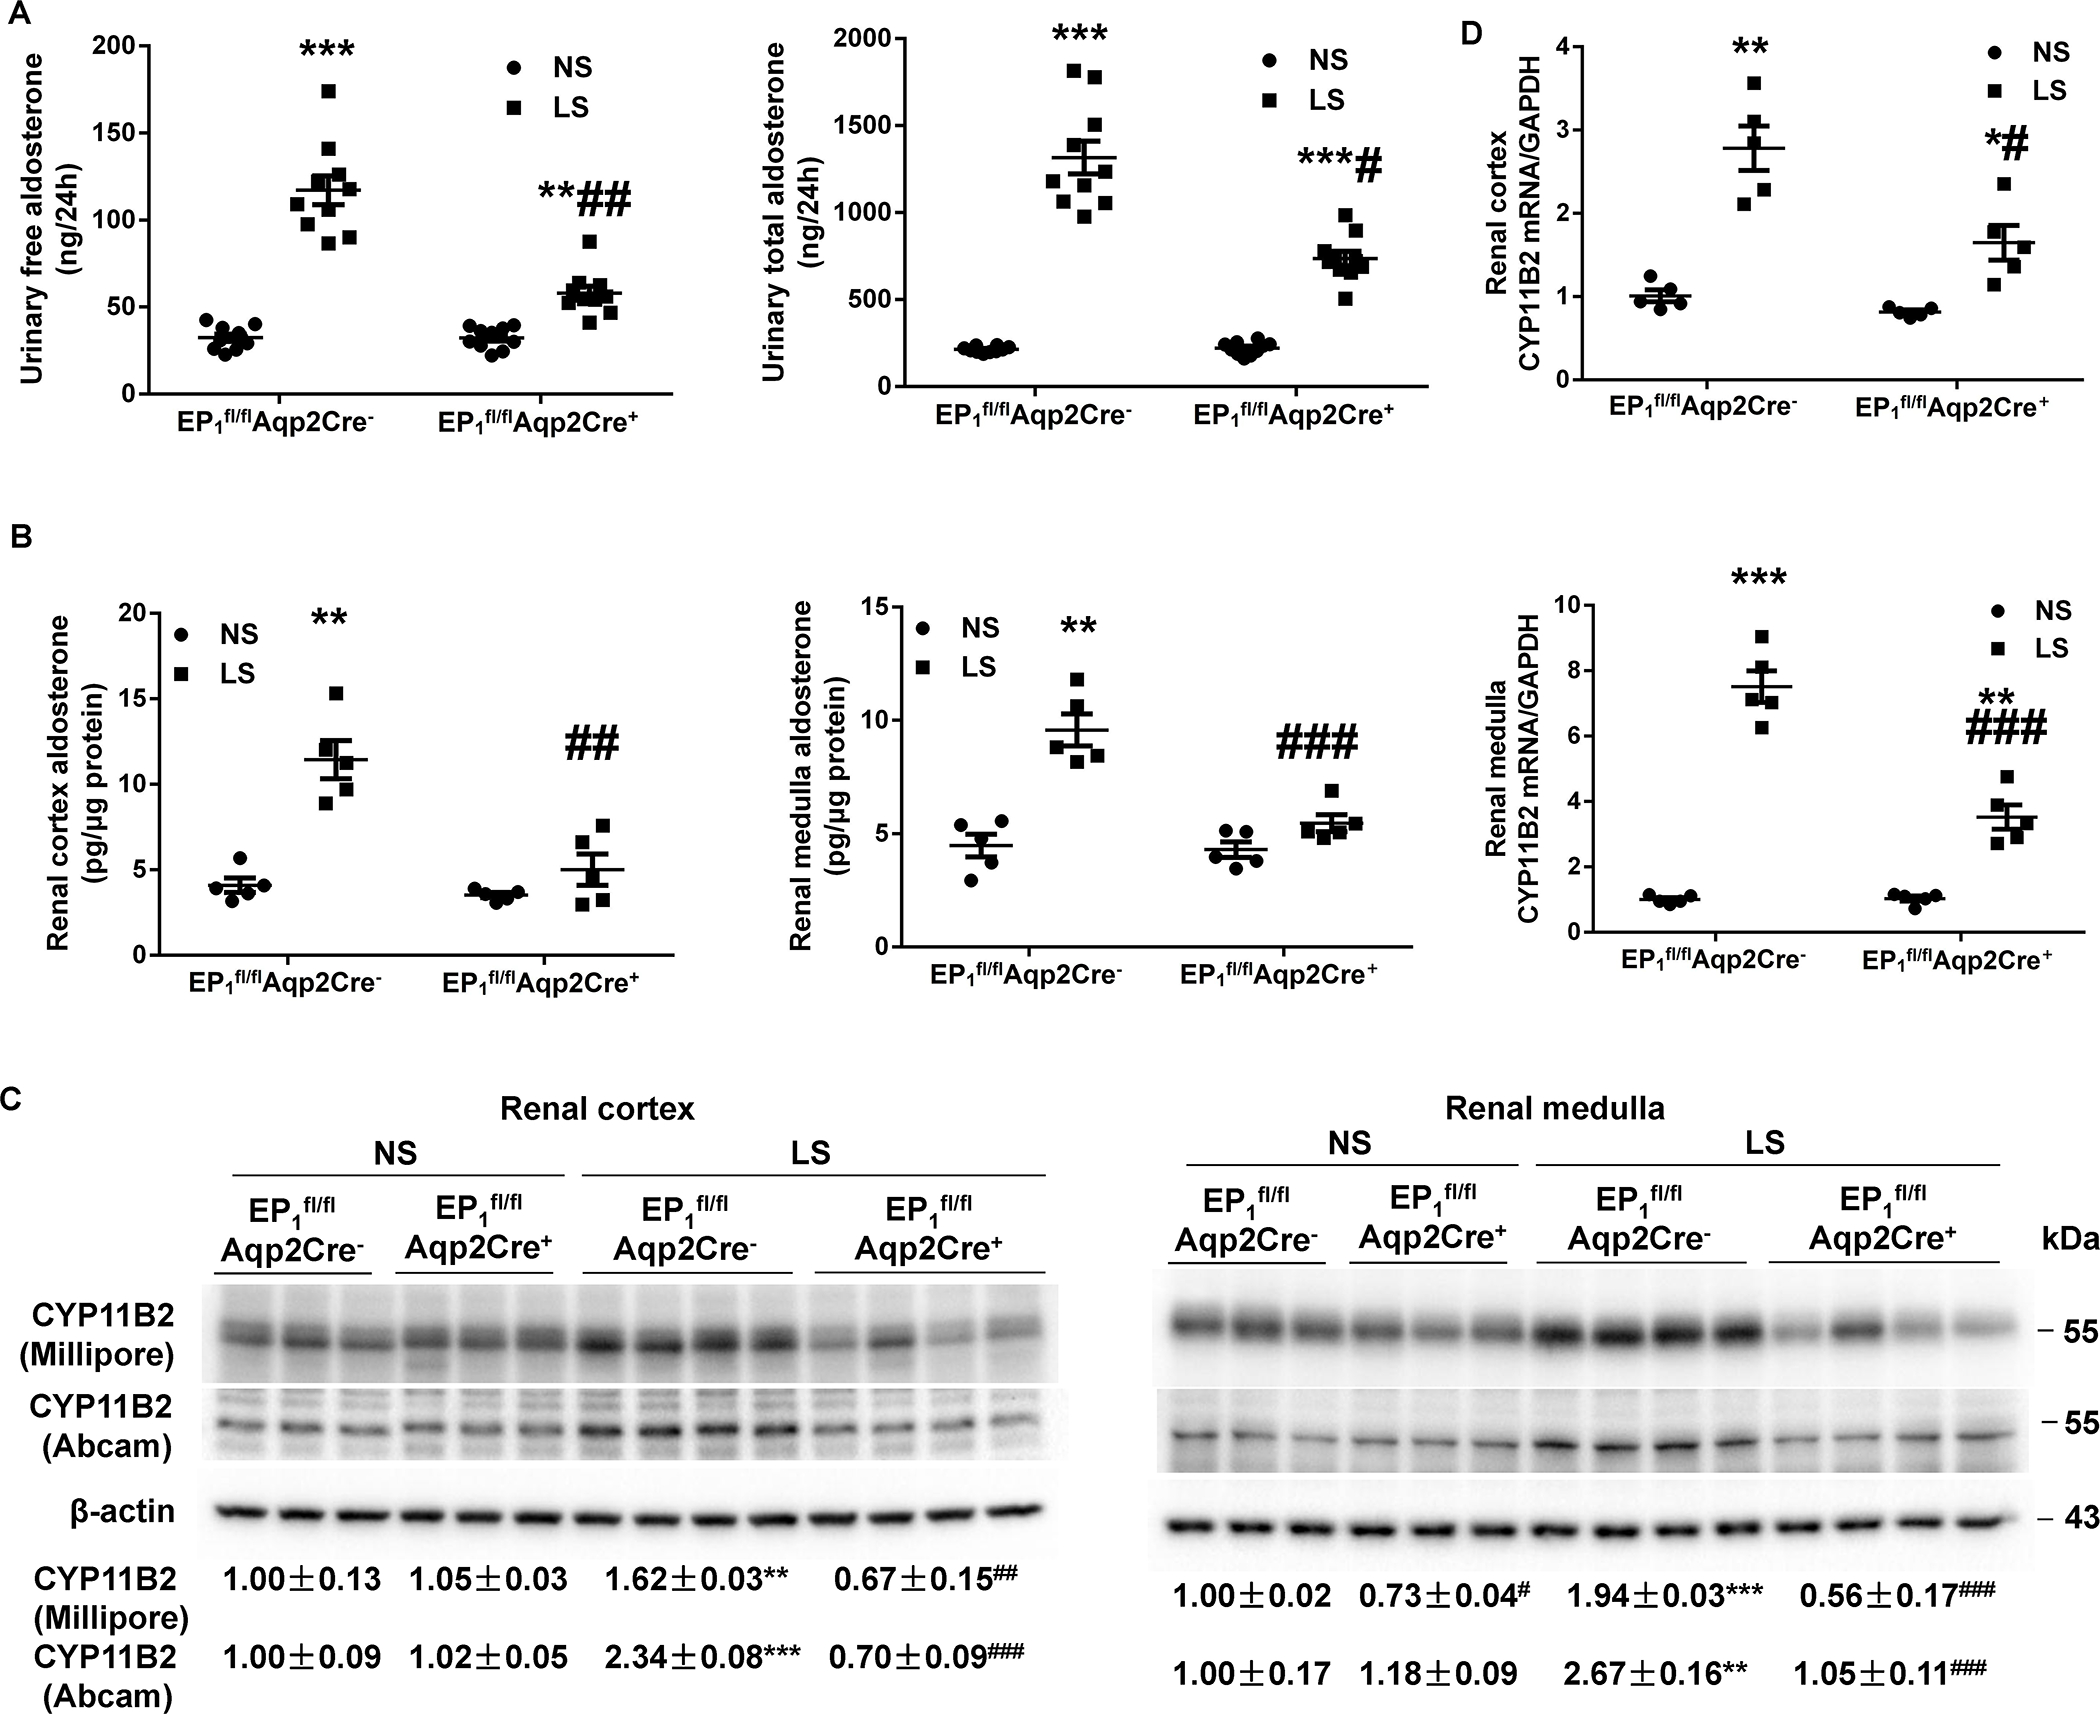
Figure 6.

Responses of intrarenal aldosterone biosynthesis in EP1fl/flAqp2Cre− and EP1fl/flAqp2Cre+ mice during normal-Na+ (NS) and low-Na+ (LS) intake. (A, B) Aldosterone levels in the urine (N=10 per group) (A), and renal cortex and medulla (N=5 per group) (B) were determined by ELISA. Data are mean ± SEM. **p<0.01, ***p<0.001 vs. NS; #p<0.05, ##p<0.01, ###p<0.001 vs. EP1fl/flAqp2Cre− (ANOVA with the Bonferroni test). (C) Representative immunoblotting and densitometric analysis of CYP11B2 (Cytochrome P450 Family 11 Subfamily B Member 2) in the renal cortex and medulla. CYP11B2-probed membranes were stripped and re-probed with anti-β-actin antibody. N = 3–4 per group for statistical analysis. Data are mean ± SEM. **p<0.01, ***p<0.001 vs. NS; #p<0.05, ##p<0.01, ###p<0.001 vs. EP1fl/flAqp2Cre− (ANOVA with the Bonferroni test). (D) RT-qPCR analysis of CYP11B2 mRNA in the renal cortex and medulla with GAPDH as an internal control. N=5 per group. Data are mean ± SEM. *p<0.05, **p<0.01, ***p<0.001 vs. NS; #p<0.05, ###p<0.001 vs. EP1fl/flAqp2Cre− (ANOVA with the Bonferroni test).
