Abstract
Background.
Circulating tumor cells (CTCs) form metastases in distant organs. The purpose of this research was to determine if tumor manipulation could enhance cancer cell release from the primary tumor into the circulatory system.
Methods.
Nude mice were inoculated with melanoma or breast cancer cells. The implanted tumor underwent compression, biopsy, complete resection, or laser treatment. CTCs were monitored in the bloodstream using in vivo photoacoustic and fluorescence flow cytometry.
Results.
We discovered that pressure, biopsy, and laser treatment can dramatically increase CTC counts (up to 60-fold), whereas proper tumor resection significantly decrease CTC counts.
Conclusion.
Standard medical procedures could trigger CTC release that may increase the risk of metastases. This finding suggests the guidance of cancer treatment and likely diagnosis by real-time monitoring of CTC dynamics followed by well-timed treatment to reduce CTCs in the blood. In vivo detection of intervention-amplified CTCs could be used for early diagnosis of a small tumor, which is undetectable with conventional methods.
Keywords: circulating tumor cells, melanoma, breast cancer, in vivo flow cytometry, photoacoustic and fluorescence methods
INTRODUCTION
Most cancer deaths are related to metastases to distant organs due to disease dissemination by circulating tumor cells (CTCs) shed from the primary tumor. Metastases correlate with the presence and number of CTCs in the vasculature.1,2 For many years, oncologists believed that some medical procedures may provoke metastasis; however, no convincing data were reported.3,4 The purpose of this research was to obtain direct evidence on whether typical medical procedures, such as compression, incisional biopsy, tumor resection, or laser surgery, might enhance the release of cancer cells from the primary tumor into the circulatory system, and thus increase the risk of metastases. To monitor CTCs, conventional methods usually isolate CTCs from peripheral blood samples ex vivo using specific cancer markers, and then count the targeted cells.2,5–9 However, these methods are restricted by the discrete time sampling, the low sensitivity caused by small blood-sample volumes, and the difficulty in recording dynamic events in real-time, especially with regard to rare CTCs with short circulation times.10 Highly sensitive, real-time monitoring of CTCs can be performed with advanced in vivo flow cytometry using various detection schematics without the need to extract blood samples. In particular, photoacoustic (PA) flow cytometry (PAFC) is capable of monitoring a variety of cells in the circulation, including CTCs, bacteria, clots, and normal blood cells,10–17 and can yield quantitative results without affecting the physiology of the subject. In this work, we used advanced PAFC integrated with fluorescent detection techniques.17,18
MATERIALS AND METHODS
Cell lines and animal model
Mouse melanoma (B16F10) and human breast cancer (MDA-MB-231) cell lines expressing green fluorescent protein (GFP) were used in the xenograft nude mouse model to provide opportunities for long-term monitoring of CTCs. Nude mice (from Harlan Sprague–Dawley; weighing 20–25 g) were used in accordance with protocols approved by the University of Arkansas for Medical Sciences Institutional Animal Care and Use Committee. Subcutaneous inoculation of 1 × 10⁶ tumor cells (B16F10-GFP) were used to produce tumor-bearing mouse model on the back, and 0.5 × 10⁶ cells (either B16F10-GFP or MDA-MB-231-GFP) were used to produce tumor-bearing mouse model in the ear. The first group contained 27 tumor mice whose tumors were manipulated by applying pressure on the tumor, by incisional biopsy, complete tumor resection, or laser treatment when tumor volumes reached approximately 220 to 260 mm3. The second group contained 15 tumor-free control mice that were subjected to pressure or surgery. Tumor diameters were measured on the long and short directions using a calibration ruler. The tumor volume was calculated by: volume = (long diameter × short diameter2)/2. Before tumor manipulation procedures, each mouse was imaged using an IVIS200 Imaging System (Caliper Life Sciences) to determine if metastasis has been formed. For in vivo monitoring of CTCs, mice were anesthetized using isoflurane inhalation (1.2%). An anesthetized mouse was placed on a temperature-controlled microscope stage (37°C), and the mouse ear was spread over the stage glass window. A total of 5 animals were used for each experiment unless otherwise noted. All experimental sessions consisted of continuous monitoring for CTC detection via in vivo PA and fluorescent flow cytometry during 3 time periods whose lengths depended on how the tumor was manipulated. The 3 time periods consisted of a “before” period to collect CTC detection rates, a “during” period during which the manipulation was administered to the tumor, and an “after” period after manipulation of the tumor was concluded. Complete tumor resection and incisional biopsy experiment was conducted multiple times using 2 different groups of mice at 4 to 5 mice per group, each time, for each procedure, to show reproducibility. Data from both experiments were combined together for statistical analysis.
Principles of in vivo flow cytometry with photoacoustic and fluorescence detection techniques
When strongly pigmented cells (eg, melanoma with intrinsic melanin expression) or cells with fluorescent proteins, such as GFP, pass the irradiated volume in the peripheral blood vessels, laser-induced acoustic waves or fluorescence from CTCs are detected above the blood background by an ultrasound transducer or photomultiplier tube (PMT), respectively (Figure 1).10,11,16 The PA background is associated with the absorption of randomly distributed red blood cells (RBCs) in the irradiated volume, whereas the fluorescence background is related to the autofluorescence from blood and plasma components (Figure 2A). In fluorescence mode, a cell emits fluorescence photons under a continuous wave laser excitation, whereas PAFC uses nanosecond pulse lasers to generate PA signals.
FIGURE 1.
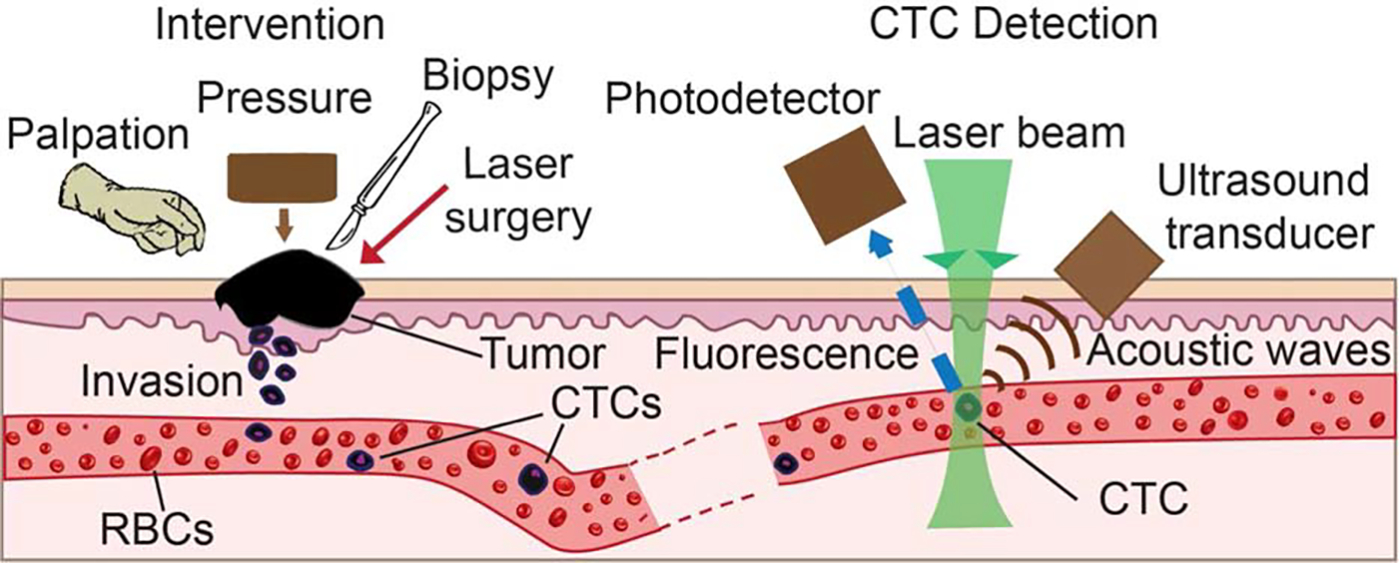
Principle of in vivo flow cytometry using photoacoustic and fluorescence methods for real-time monitoring of melanoma and breast circulating tumor cells (CTCs) directly in the bloodstream during palpation, pressure, biopsy, and surgery. (Left) Schematic of different interventions. (Right) Detection methods. RBC, red blood count.
FIGURE 2.
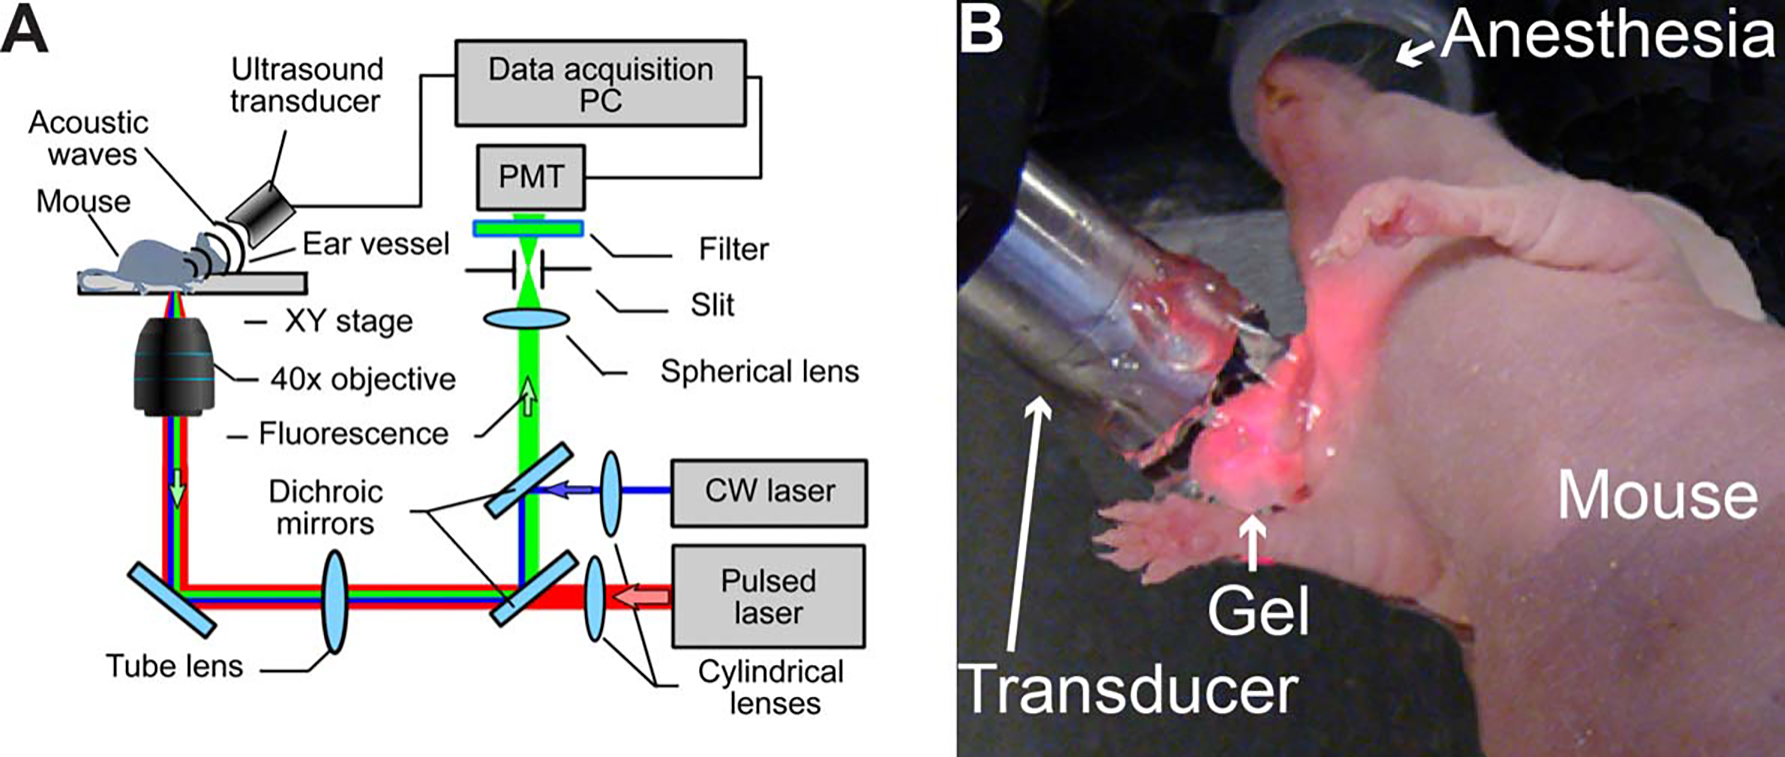
In vivo photoacoustic and fluorescent detection of circulating tumor cells (CTCs). (A) Schematics of the integrated in vivo flow cytometer. (B) Experimental animal model. PC, personal computer; PMT, photomultiplier tube; CW, continuous wave.
Schematic of multimodal flow cytometry
The integrated, multimodal in vivo flow cytometry (Figure 2A) was built on the platform of an Olympus IX81 inverted microscope (Olympus America), which was equipped with a high pulse repetition-rate laser with a wavelength of 1064 nm, pulse energy of 50 μJ, pulse width of 10 ns, and pulse rate from 1 Hz to 750 kHz (Multiwave Photonics, Portugal); and continuous wave diode laser with a wavelength of 488 nm and power of 50 mW (IQ1C45 [488–60] G26; Power Tech., Alexander, AR). Laser beams were focused into the blood vessel by a 40× micro-objective (NA 0.65; Olympus), which simultaneously collected fluorescence from cells. Cylindrical lenses with a focal length of 250 mm provided the 10 μm × 80 μm linear shape of the laser beams in the sample. Two dichroic mirrors separated the laser light and fluorescence emission. The fluorescence was detected using a photodetector-PMT (R928, Hamamatsu, Bridgewater, NJ) after a bandpass filter with a central wavelength of 520 ± 15 nm (Semrock, Rochester, NY). A 200 μm × 3 mm slit in the front of the PMT was confocal with the image plane, and provided spatial filtration of the out-of-plane fluorescence. Laser-induced acoustic waves were detected by an ultrasound transducer (2.25 MHz, V-323-SM; Olympus NTD, Waltham, MA) and further amplified with a pre-amplifier (50 kHz – 5 MHz bandwidth, 54 dB gain, model 5662, Panametrics NDT).16,17 Standard ultrasound gel was placed on the skin for acoustic coupling (Figure 2B).
Tumor palpation
To study the effect of tumor palpation, 3 tumor-bearing mice with inoculated breast cancer cells in the ear were used. Each mouse was placed under the microscope and continuously monitored before, during, and after palpation using the in vivo flow cytometer with fluorescence detection schematic. After 25 minutes of continuous monitoring, tumor palpation commenced, and consisted of squeezing the tumor with fingers for approximately 10 minutes, replicating what would occur during a physical examination. After palpation ceased, the continuous monitoring was maintained for another 55 minutes. Each procedure was performed and repeated 3 times in 3 different mice. To determine whether palpation could produce false-positive signals, a control group of 3 cancer-free mice had their ears palpated in similar fashion while being continuously monitored by in vivo flow cytometry.
Tumor pressure
To more systematically study the effect of pressure on the tumor, 5 tumor-bearing mice with inoculated melanoma tumor cells on the back were used. Each mouse was placed under the microscope and continuously monitored before, during, and after the pressure using the in vivo flow cytometer with PA and fluorescence detection schematic. After 40 minutes of continuous monitoring, pressure was applied to the tumor for 30 minutes using a 120 g weight applied to approximate the pressure of palpation during the examination of a tumor. The area of contact between the weight and the tumor was typically 0.5 cm2. The continuous monitoring was maintained for the entire 30 minute procedure, and continued for another 230 minutes after the pressure ended. Each procedure was performed and repeated 5 times in 5 different mice. To determine whether the pressure could produce false-positive signals, a control group of 5 cancer-free mice had their backs subjected to pressure in similar fashion while being continuously monitored by in vivo flow cytometry.
Incisional biopsy
Five tumor-bearing mice with inoculated melanoma tumor cells in the ear were used for this experiment. In 2 more mice, repeated incisional biopsies were conducted, and in 2 additional mice, a complete tumor resection was followed by an incisional biopsy. After 1 hour of continuous monitoring via in vivo flow cytometry, an incisional biopsy was conducted by cutting through the tumor with a scalpel. Each mouse was monitored continuously via in vivo flow cytometry for the 15-minute duration of the incisional biopsy and for an additional 260 minutes afterward. Each procedure was performed and repeated 9 times in 9 different mice.
Complete resection
Seven tumor-bearing mice with inoculated melanoma tumor cells in the ear were used for this experiment. Each mouse was placed under the microscope, where its ear vessels were continuously monitored before, during, and after resection using the in vivo flow cytometer. After 45 minutes of continuous monitoring, the skin of the mouse’s ear was washed twice with chlorihexidine and allowed to dry for 3 minutes. Complete tumor resection commenced at the 50th minute of continuous monitoring, and was conducted by cutting the tissue outside the 1- to 2-mm tumor margin. Each resection took approximately 5 minutes. The continuous monitoring was maintained through the resection period and for 135 minutes afterward. Each procedure was performed and repeated 7 times in 5 different mice. To determine whether complete resection could produce false-positive signals, a control group of 7 cancer-free mice had their ears resected in similar fashion while being continuously monitored by in vivo flow cytometry.
Laser treatment
Three tumor-bearing mice with inoculated breast cancer cells in the ear were used. The effect of laser impact was studied by irradiation of tumors with a wavelength of 488 nm for 30 minutes at 50 mW of power. Real-time monitoring of CTC dynamics was performed using the in vivo flow cytometer for 20 minutes before, 30 minutes during, and 30 minutes after laser exposure. Each procedure was performed and repeated 3 times in 3 different mice.
Histology test
To assess the metastases in various organs, tissue from lungs, brain, liver, bone, spleen, kidneys, and a small number of lymph nodes were harvested from the mice and examined using standard histopathological procedure. The tissues were fixed by formalin and made into paraffin sections. Tissue sections were stained with hematoxylineosin using standard protocols.
Data collection
In fluorescence-detection mode, signals from the PMT were continuously sampled at a rate of 4 MHz using a high-speed digitizer (PCI-5124; National Instruments, Austin, TX), and down-sampled to a 10 kHz rate using the average of 400 consecutive points. In PAFC mode, PA signals from the ultrasound transducer were sampled, and processed by a custom digitizer (AD484; 4DSP, Reno, NV). PA and fluorescence signal traces were displayed online and recorded for offline processing. In selected experiments, we used a 2-channel detection system to simultaneously monitor the PA and fluorescence signals from pigmented and fluorescent cells in blood. The continuous-monitoring results on each mouse were binned into consecutive 10-minute windows, and the number of CTCs detected in each mouse during each window was counted. Data acquisition and postprocessing operations were implemented in MATLAB (MathWorks, Natick, MA) and LabVIEW (National Instruments).
Statistical analysis
The relationship between CTC count and tumor size was assessed using Spearman’s rank-correlation coefficient. For the pressure and the biopsy experiments, the consecutive 10-minute windows were grouped into 5 time periods as follows: before manipulation, during manipulation, the first hour after manipulation, the second hour after manipulation, and >2 hours after manipulation. The CTC detection rate (CTC count per 10 minutes) during each time period, within each mouse was calculated as the total number of CTCs detected during the period divided by the period’s duration expressed as the number of 10-minute windows in the period. Detection rates were compared between time periods via mixed-models Poisson regression using the Glimmix Procedure in SAS version 9.3 (SAS Institute, Cary, NC). The response variable was the total CTC count in each time period, the offset variable was the natural logarithm of the time period’s duration, and the best-fitting autocovariance model had a heterogeneous Toeplitz structure. Detection rates from the complete resection experiment were also compared by mixed-models Poisson regression, but with the following modifications: (1) the 5-minute resection period became the beginning of the first hour after manipulation because it was too short to use as a stand-alone “during” period; (2) the period >2 hours after resection was excluded from the analysis because it was only 20 minutes long and contained no detection event for any mouse; and (3) the best-fitting autocovariance model had heterogeneous first-order autoregressive structure. The significance level was set at p < .05, despite the multiple comparisons, in order not to inflate type II errors in this small pilot study.
RESULTS
Control mice
There were 3 groups of cancer-free control mice, 1 group with 3 mice for the palpation experiment, 1 group with 5 mice for the pressure experiment, and 1 group with 7 mice for the surgery experiment. No false-positive signals were detected via in vivo flow cytometry in any cancer-free control mouse at any time before, during, or after their procedure (Figure 3A).
FIGURE 3.
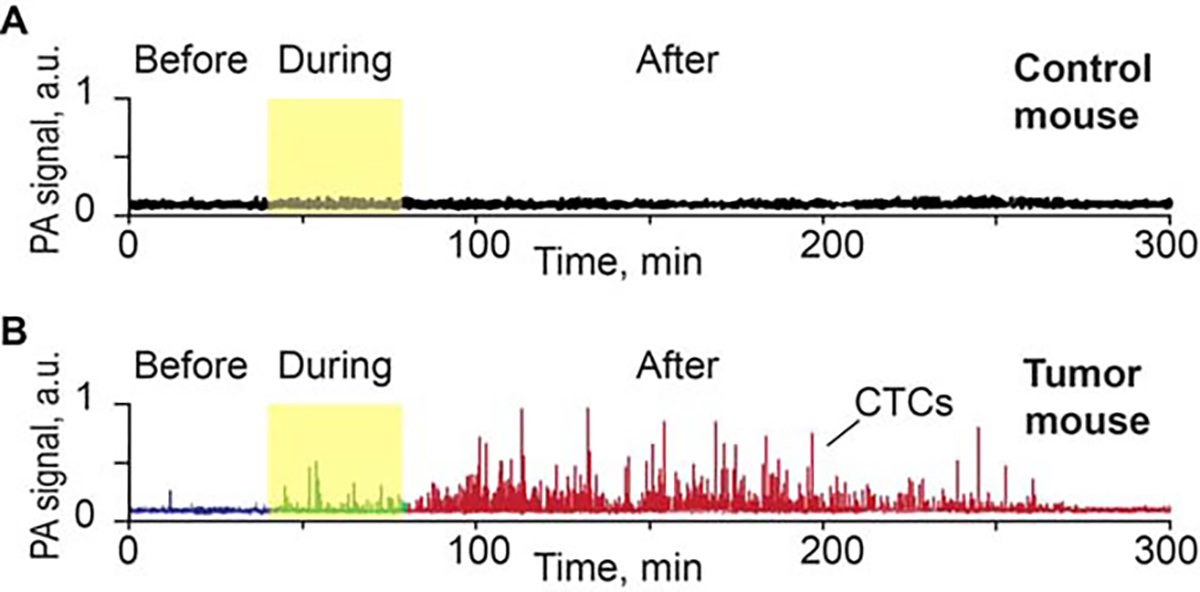
(A) Example of photoacoustic (PA) signal trace before, during, and after pressure (120 g) on back skin and muscle of a control nude mouse (no tumor). (B) Example of PA signal trace before, during, and after pressure on approximately 5-mm melanoma tumor model (B16F10-green fluorescent protein [GFP]) on the nude mouse back. CTC, circulating tumor cell.
Circulating tumor cell dynamics change after pressure and palpation
Before pressure was applied using the 120 g weight, the average CTC detection rate was 1.15 cells/10 minutes. Compared to this value, the CTC detection rate increased to 6.73 cells/10 minutes (p = .041) during the pressure procedure, and to 18.5 cells/10 minutes (p < .0001) during the first hour after pressure ended. The CTC detection rate decreased to 6.67 cells/10 minutes (p = .06) (during the second hour after pressure ended, and decreased further to 2.09 cells/10 minutes (p = .63) during the period >2 hours after pressure ended (Figures 4A and 4B). No CTC response was found at weights below 50 g. Similar effects were observed by squeezing the tumor with fingers. Specifically, the CTC count increased immediately after manipulating the tumor and the maximum CTC rates occurred 10 minutes after finishing the tumor manipulation (Figure 4C).
FIGURE 4.
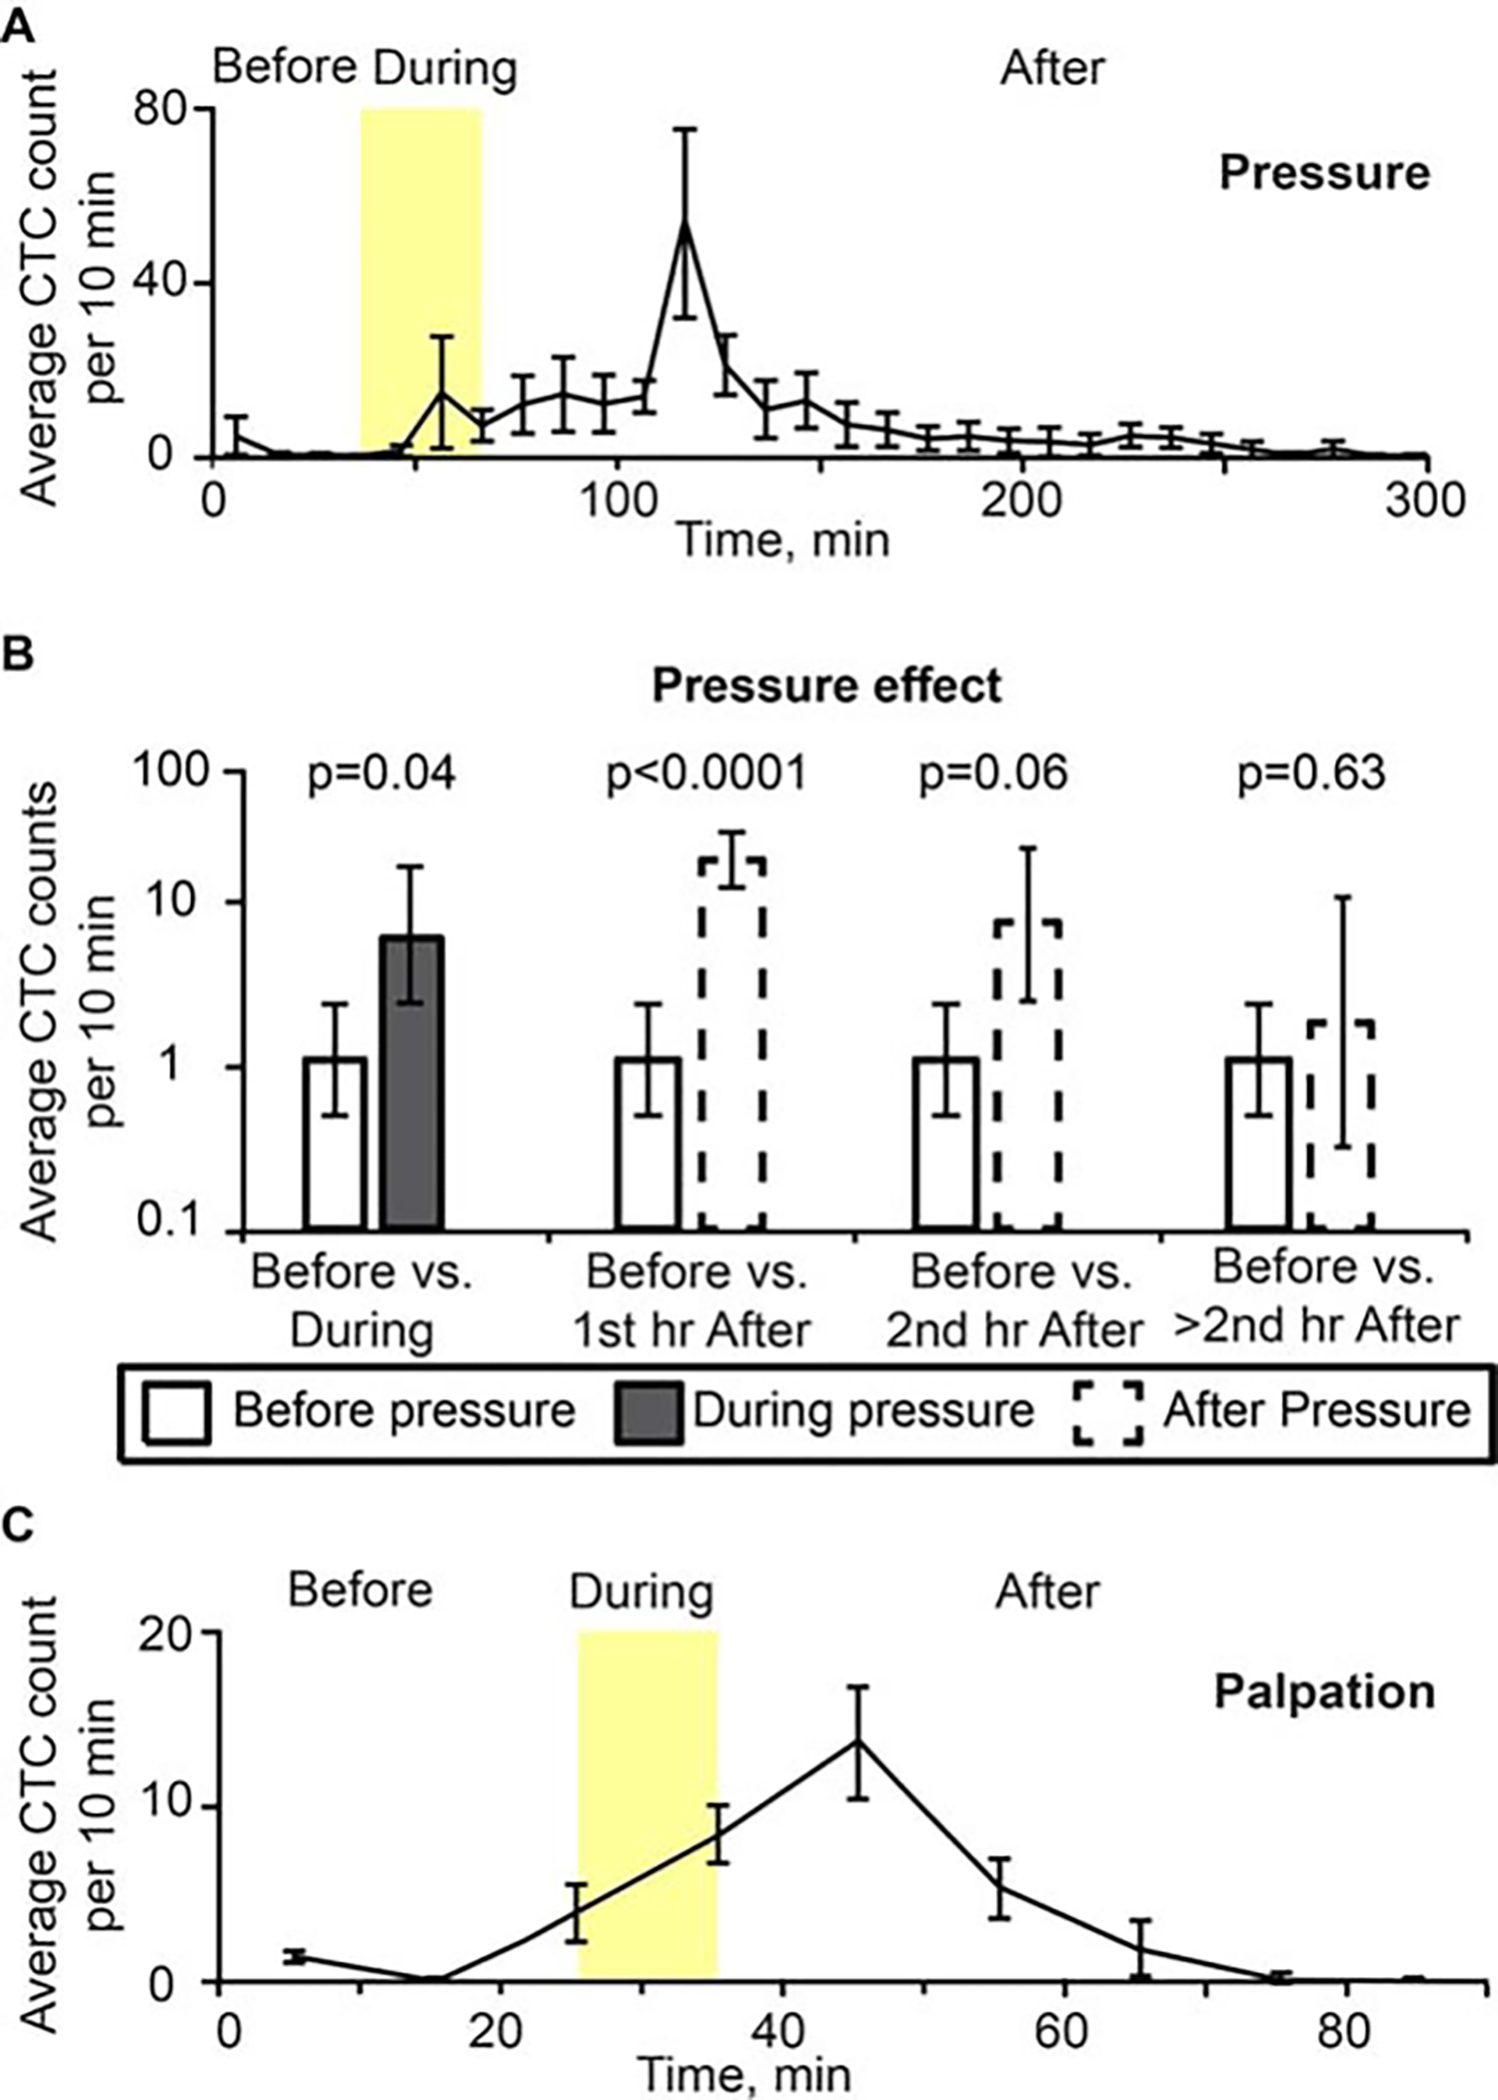
(A) Dynamic of average number of signals per 10 minutes associated with circulating melanoma cells (B16F10-green fluorescent protein [GFP] cells) for 40 minutes before, 30 minutes during (yellow region), and 230 minutes after removing pressure provided by a cylindrical 120 g weight with 10-mm diameter for 30 minutes. Count of peaks are at the midpoint between 0 and 10 minutes, and so on. Values and error bars represent the averages and SDs of CTC counts from 5 mice during each 10-minute bin. Each procedure was performed and repeated 5 times in 5 different mice. (B) Pressure effect on CTC detection rate. Values (error bars) represent the estimates (90% confidence intervals) of CTC number per 10 minutes before pressure versus during and after pressure, as determined from mixed-models Poisson-regression analysis. (C) Histogram of average CTC signal number per 10 minutes from before, during (approximately 10 minutes, yellow region), and after squeezing the tumor (MDA-MB-231-GFP). Values (error bars) represent the averages (SDs) of CTC counts from 3 mice during each 10-minute bin.
In selected experiments, we used a dual-modality detection system to simultaneously monitor the PA and fluorescence contrast of CTCs expressing both melanin and GFP. PA and fluorescence contrast were estimated by 2 lasers (pulsed, 1064 nm and continuous wave, 488 nm, respectively). The laser beams were spatially overlapped in the sample. The temporal coincidence between 2 signal types was used for verification purpose (Figure 5).
FIGURE 5.
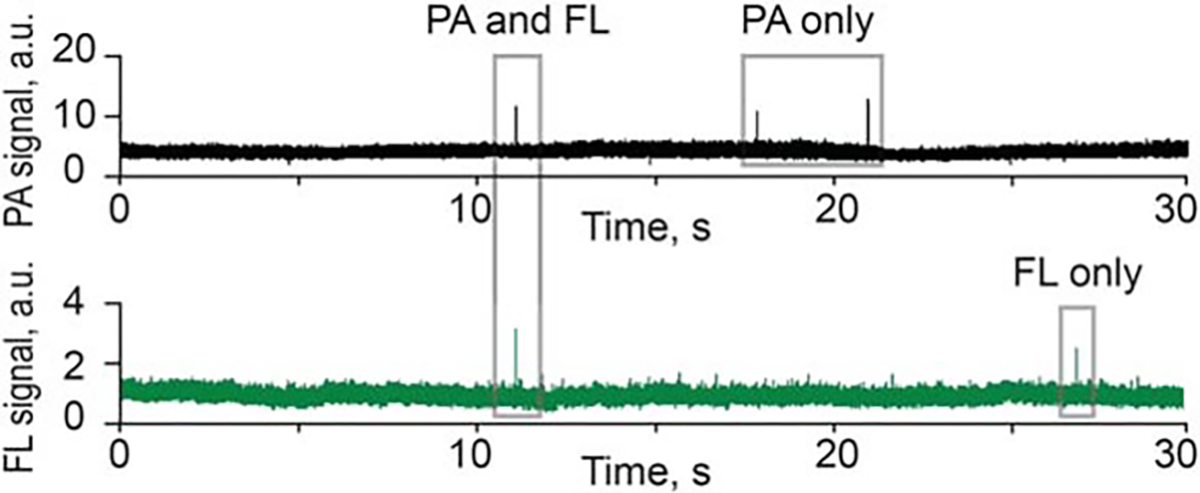
Signal traces from photoacoustic (PA) flow cytometry (PAFC; top) and fluorescent channels (FL, bottom) during detection melanoma-associated circulating tumor cells (CTCs) expressing partly green fluorescent protein (GFP).
Circulating tumor cell dynamics change after incisional biopsy
Five mice with melanoma tumors on the right ear were each monitored continuously via in vivo flow cytometry for 1 hour before, 15 minutes during, and 260 minutes after incisional biopsy (345 minutes total). The CTC detection rate was 1.29 cells per 10 minutes before biopsy began. During the 15-minute biopsy period, the CTC detection rate soared to 75.1 cells/10 minutes (p < .0001), and during the first hour after the biopsy concluded, the CTC detection rate remained high at 44.3 cells/10 minutes (p < .0001). The CTC detection rate decreased thereafter, but remained significantly elevated (p = .049) above CTC rate before biopsy at 7.70 cells/10 minutes during the second hour after the biopsy ended, and remained significantly elevated (p = .007) during the extended continuous monitoring >2 hours after the biopsy ended (Figure 6).
FIGURE 6.
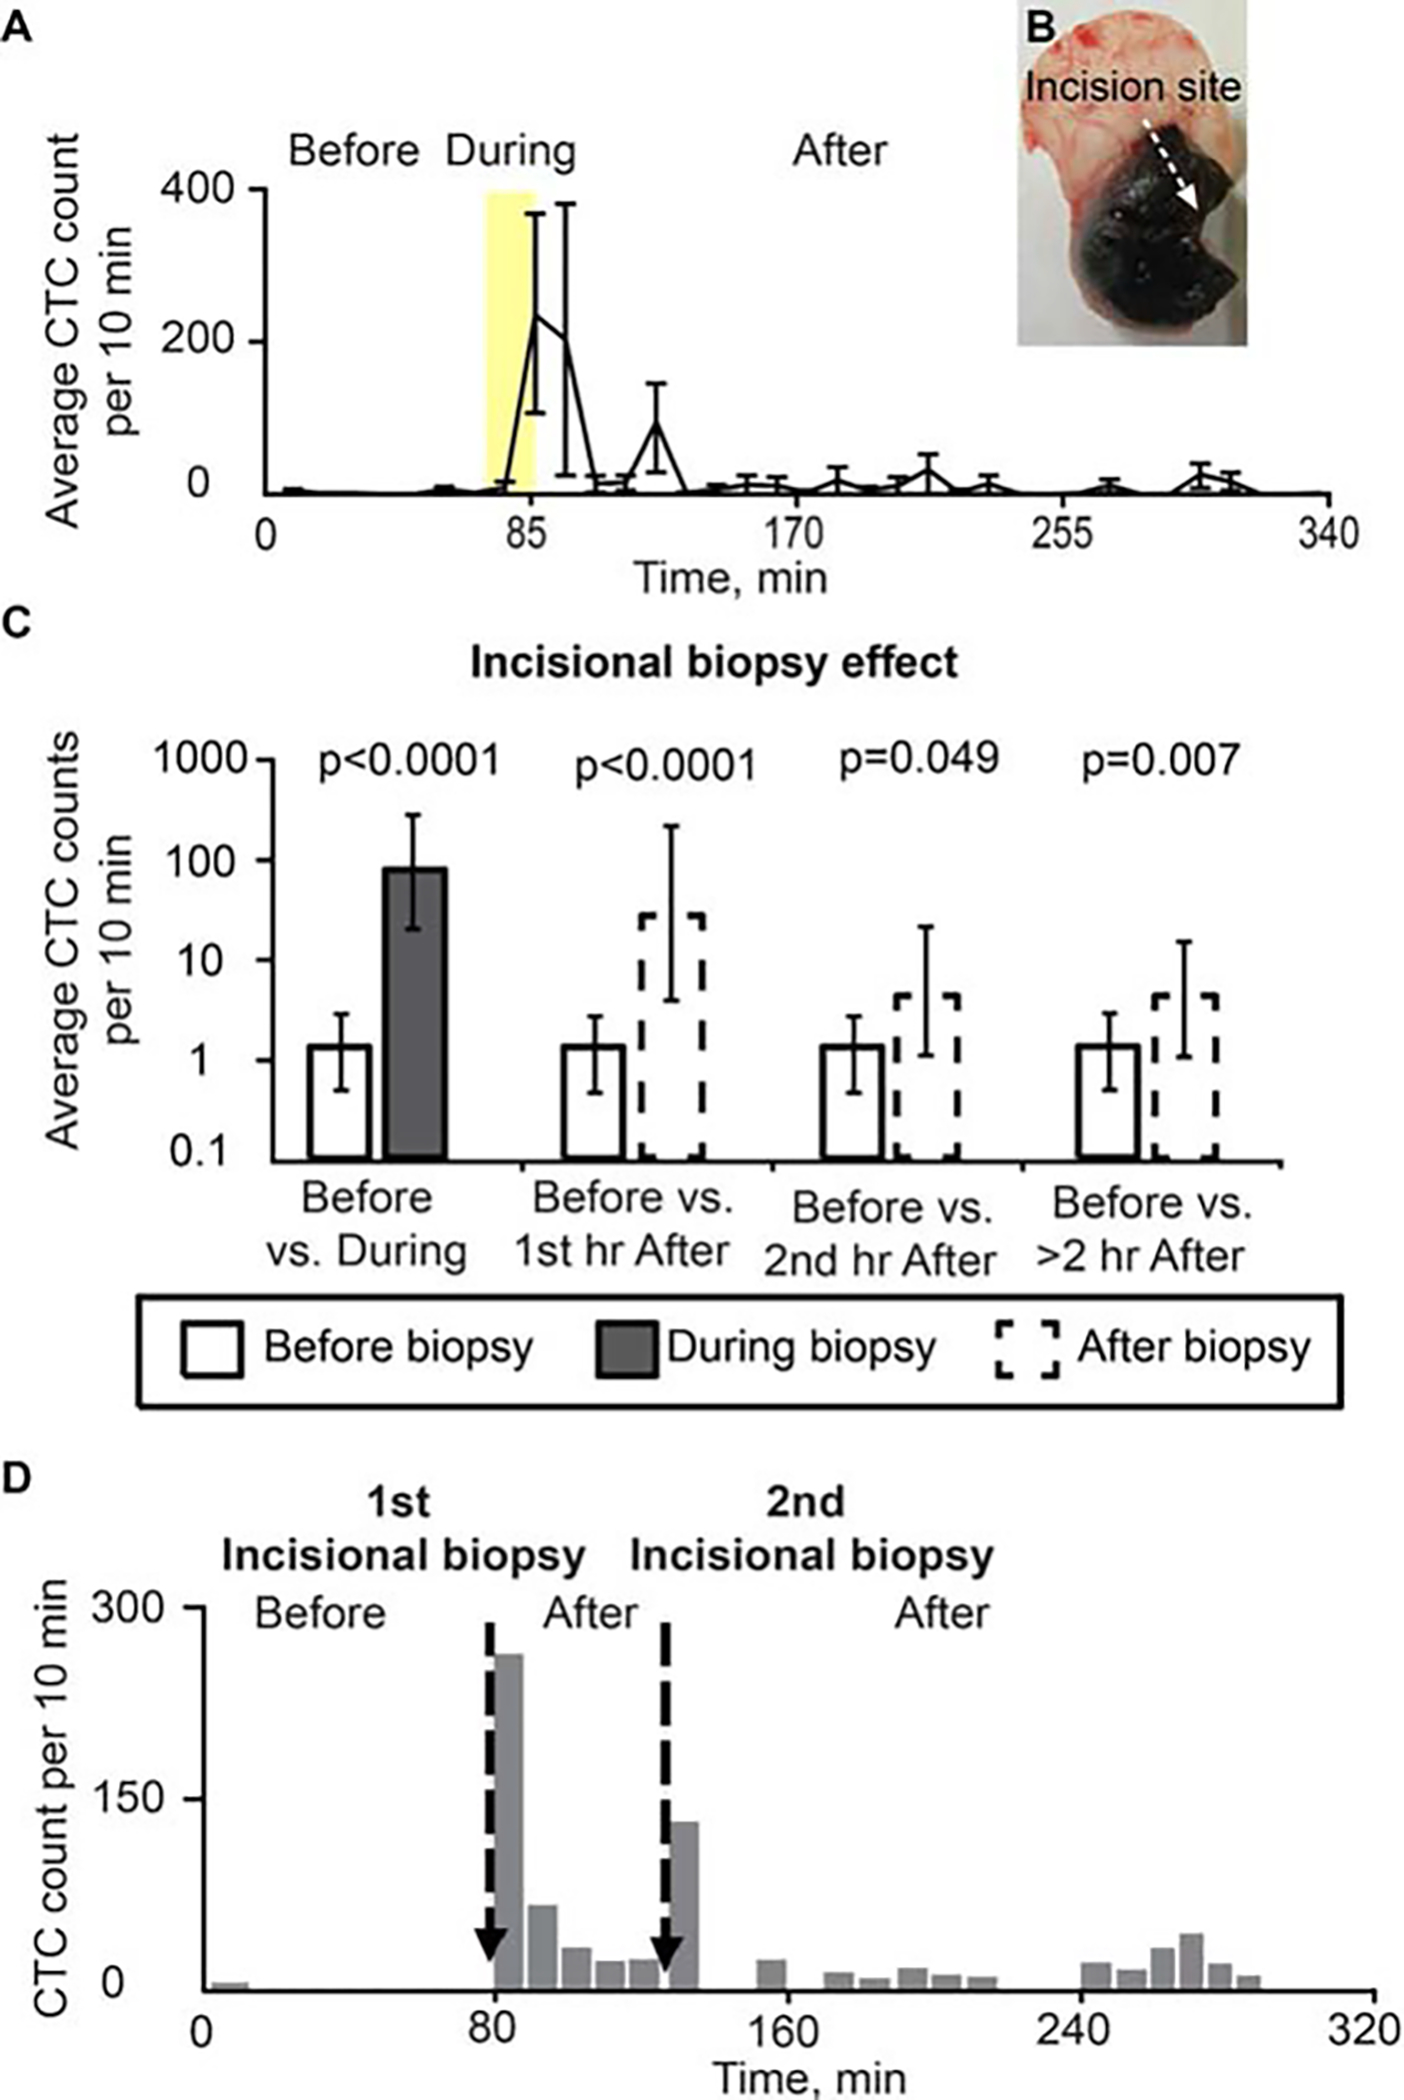
Effect of incisional biopsy on circulating tumor cell (CTC) counts (B16F10-green fluorescent protein [GFP]). (A) Dynamic of average CTC counts per 10-minute window for 70 minutes before, 15 minutes during (yellow region), and 260 minutes after incisional biopsy. Values and error bars represent the averages and SDs of CTC counts from 5 mice during each 10-minute bin. (B) Tumor after incisional biopsy. (C) CTC detection rates in counts per 10 minutes before versus during biopsy, and before versus after biopsy. Values (error bars) represent the estimates (90% confidence intervals) determined from mixed-models Poisson-regression analysis. (D) Example of CTCs release before and after 2 different incisional biopsies in the same mouse (B16F10-GFP) (duration of each incisional biopsy: approximately 1 minute).
Circulating tumor cell dynamics change after repeated incisional biopsies
In 2 mice we performed a second incisional biopsy 1 hour after the first one. We also detected a total of 200 CTCs during the first 10 minutes after the second biopsy. This number was less than the first time, in which we observed a total of 380 CTCs during the same period (Figure 6D).
Circulating tumor cell dynamics change after complete tumor resection
Seven mice with melanoma tumors on the right ear underwent tumor resection preceded and followed by real-time PA detection of CTCs in the blood vessel in the left ear. During the 50 minutes of baseline recording before tumor resection began, a total of 35 CTCs were detected among the 7 mice, yielding an average CTC detection rate of 1 cell per 10 minutes. In contrast, no CTC increases were observed during surgery, and only 1 CTC was detected among the 7 mice during the first hour after resection (detection rate = 0.023 cells/10 minutes; p = .0002), and only 2 CTCs were detected among the 7 mice during the second hour after resection (detection rate = 0.047 cells/10 minutes; p = .0005). No CTCs were detected in any mouse in the period >2 to 3 hours after tumor resection (Figure 7).
FIGURE 7.
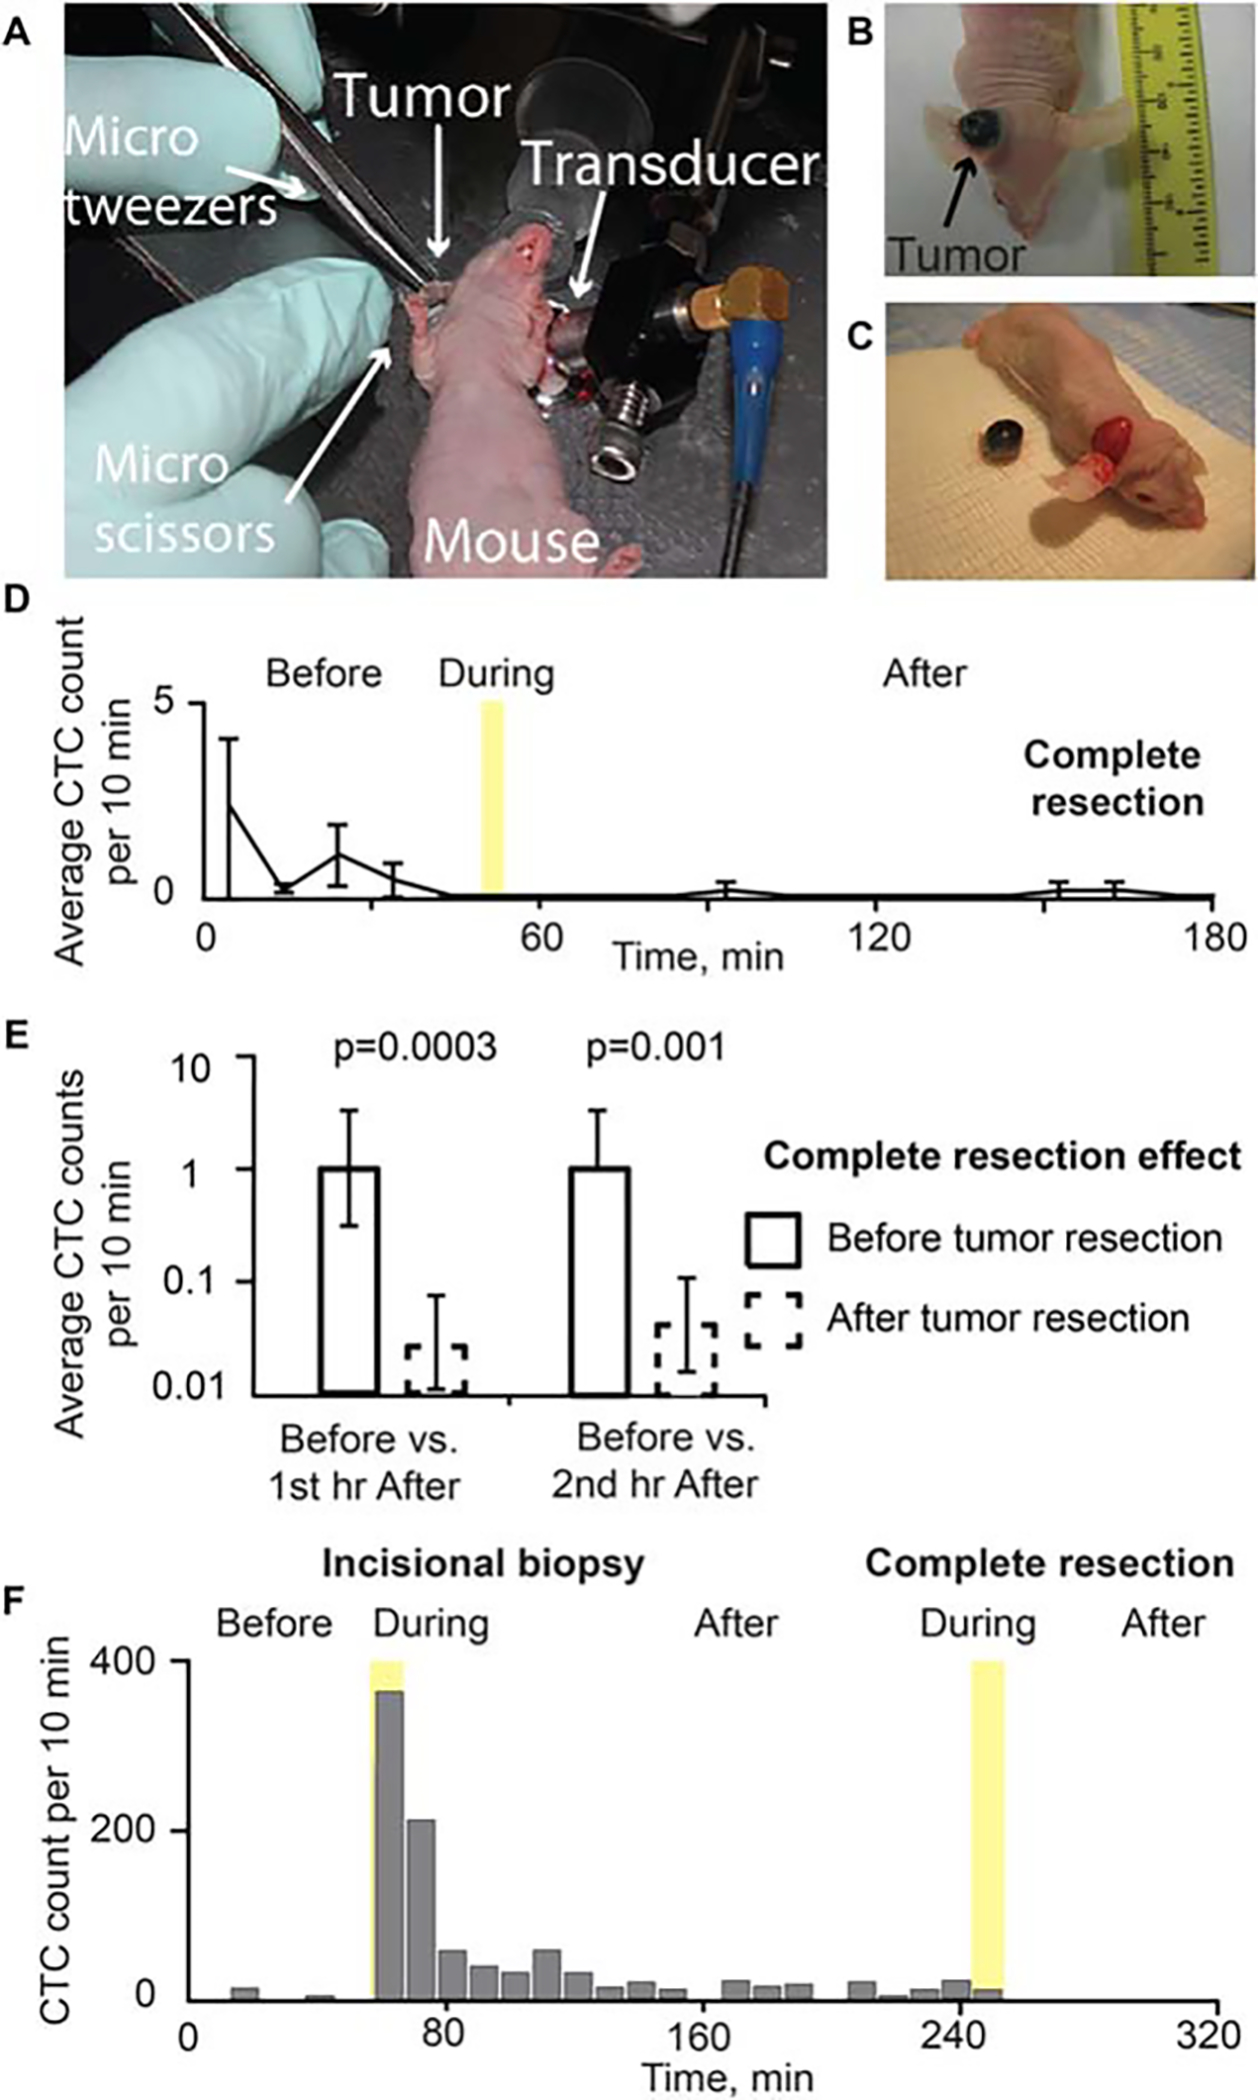
Effect of tumor excision with wide margins. (A) Complete tumor resection (B16F10-green fluorescent protein [GFP]) during monitoring using in vivo flow cytometry in real-time. Melanoma tumor in the ear (B) before and (C) after tumor excision with wide margins. (D) Dynamic of average circulating tumor cell (CTC) signal number per 10 minutes before, 5 minutes during (yellow region), and after complete tumor resection. Values and error bars represent the averages and SDs of CTC counts from 7 mice during each 10-minute bin. (E) CTC detection rates in counts per 10 minutes before versus the first hour and second hour after surgery. During complete resection, no CTCs were detected. Values (error bars) represent the estimates (90% confidence intervals) determined from mixed-models Poisson-regression analysis. (F) Example of CTCs release before and after incisional biopsy (duration of incisional biopsy: approximately 10 minutes), and tumor complete resection with tumor manipulation (duration of complete tumor resection: approximately 10 minutes; B16F10-GFP).
Circulating tumor cell dynamics change after incisional biopsy followed by complete tumor resection
In 2 cases, a complete tumor resection was conducted 2 hours after an incisional biopsy. During tumor resection, the tumor was squeezed with a surgical instrument. Approximately 20 CTCs were observed during 10 minutes of resection time and no CTCs were detected up to 1 hour after the complete resection was completed (n = 2; Figure 7F).
Circulating tumor cell dynamics change after laser treatment
In 3 mice with breast cancer, the damage to the blood vessels during the laser exposure led to the release of tumor cells into the blood vessels accompanied by a 5- to 10-fold increase in CTC rate. The CTC rate increased 20 minutes after tumor laser treatment began, and the maximum CTC rate occurred during the laser exposure. Forty minutes after the laser surgery stopped, the CTC rate fell to the same level as when the laser surgery began (Figure 8).
FIGURE 8.
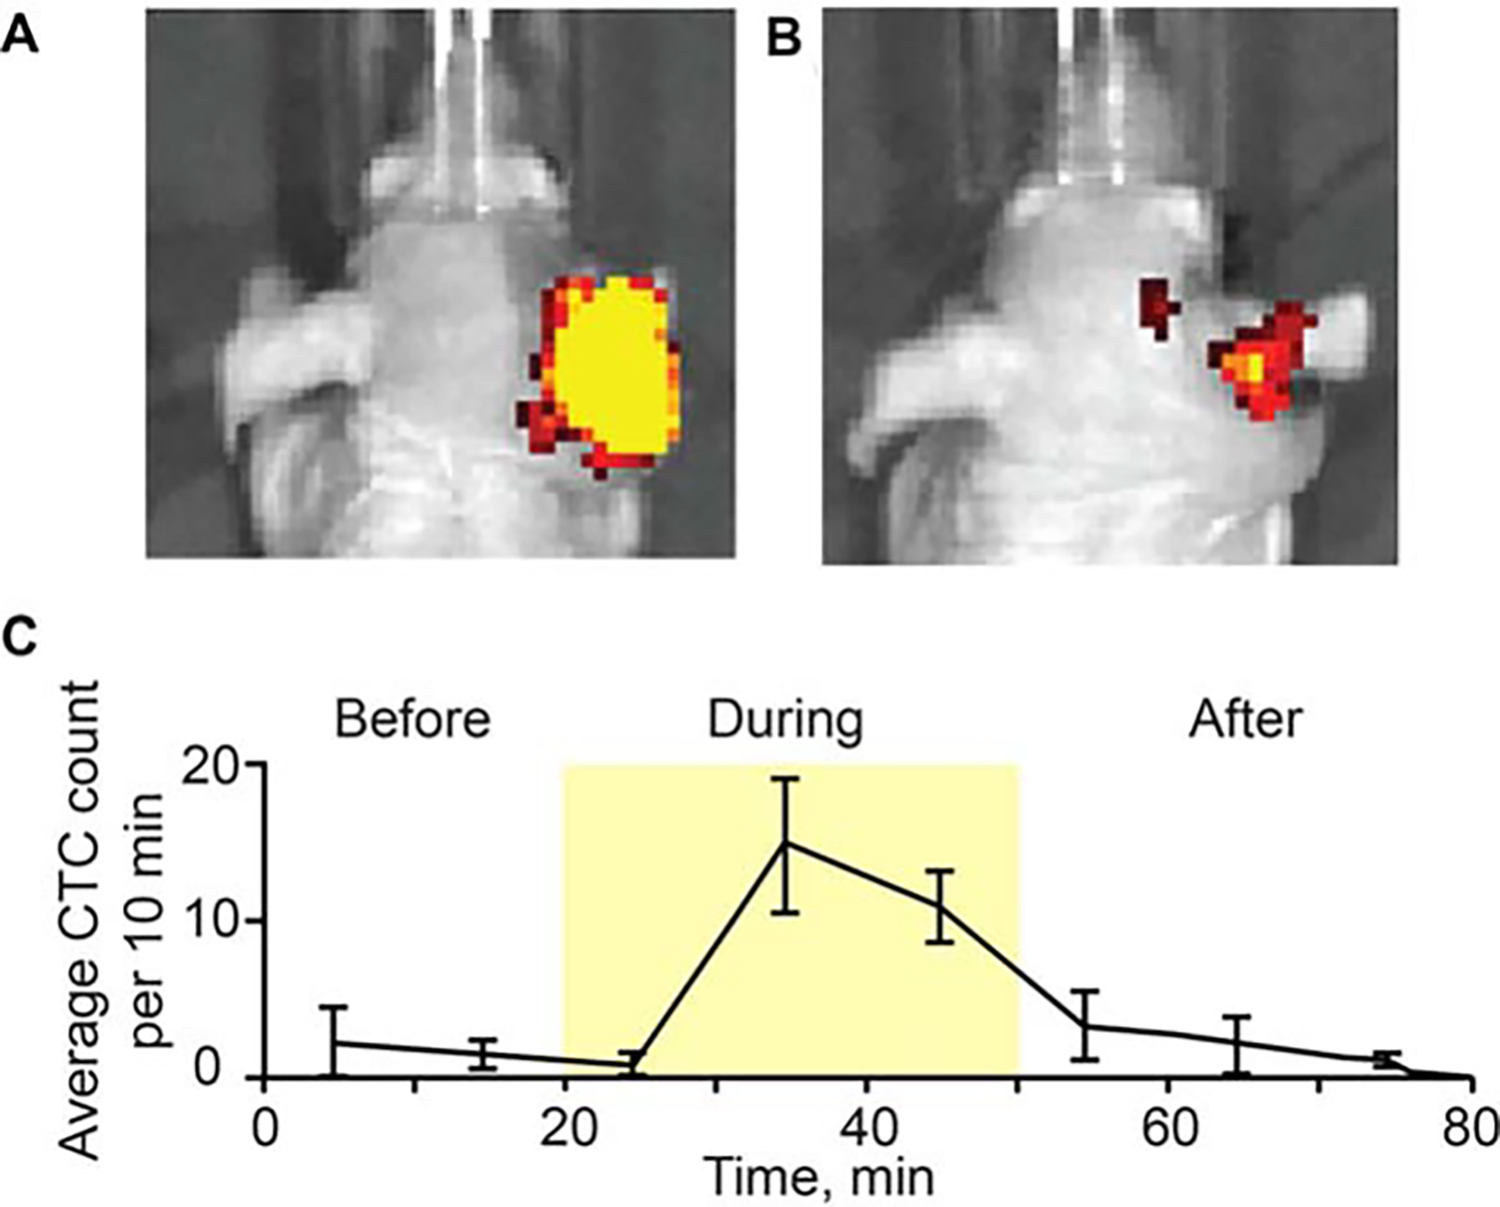
Photoacoustic (PA) monitoring of breast circulating tumor cell (CTC) release during laser exposure. Whole body mouse images were obtained using the IVIS200 Imaging System (Caliper Life Sciences) before (A) and after (B) laser exposure of primary breast tumor in the right ear (MDA-MB-231-green fluorescent protein [GFP]). (C) Dynamic of CTC counts before, during and after laser exposure. Values and error bars represent the averages and SDs of CTC counts from 3 mice during each 10-minute bin.
Correlation between circulating tumor cell dynamics and tumor growth without intervention
To determine the influence of tumor size on CTC dynamics, we compared the CTC dynamics in the control recording period before starting the tumor manipulation procedures (pressure, incisional biopsy, and surgery) in 18 mice. CTC counts were compared in tumor mice (B16F10-GFP) 1 week, 2 weeks, and 3 weeks after tumor inoculation. We have found that CTC dynamics are, to a first approximation, positively correlated with tumor growth in our subcutaneous melanoma tumor model (Spearman’s rank correlation = 0.456; p = .057). There were none or few CTCs in the peripheral blood in the early tumor stage, but the CTC dynamic tended to increase linearly with the tumor volume in the late stage (Figure 9). However, in a few animals, the CTC count decreased in large tumors.
FIGURE 9.
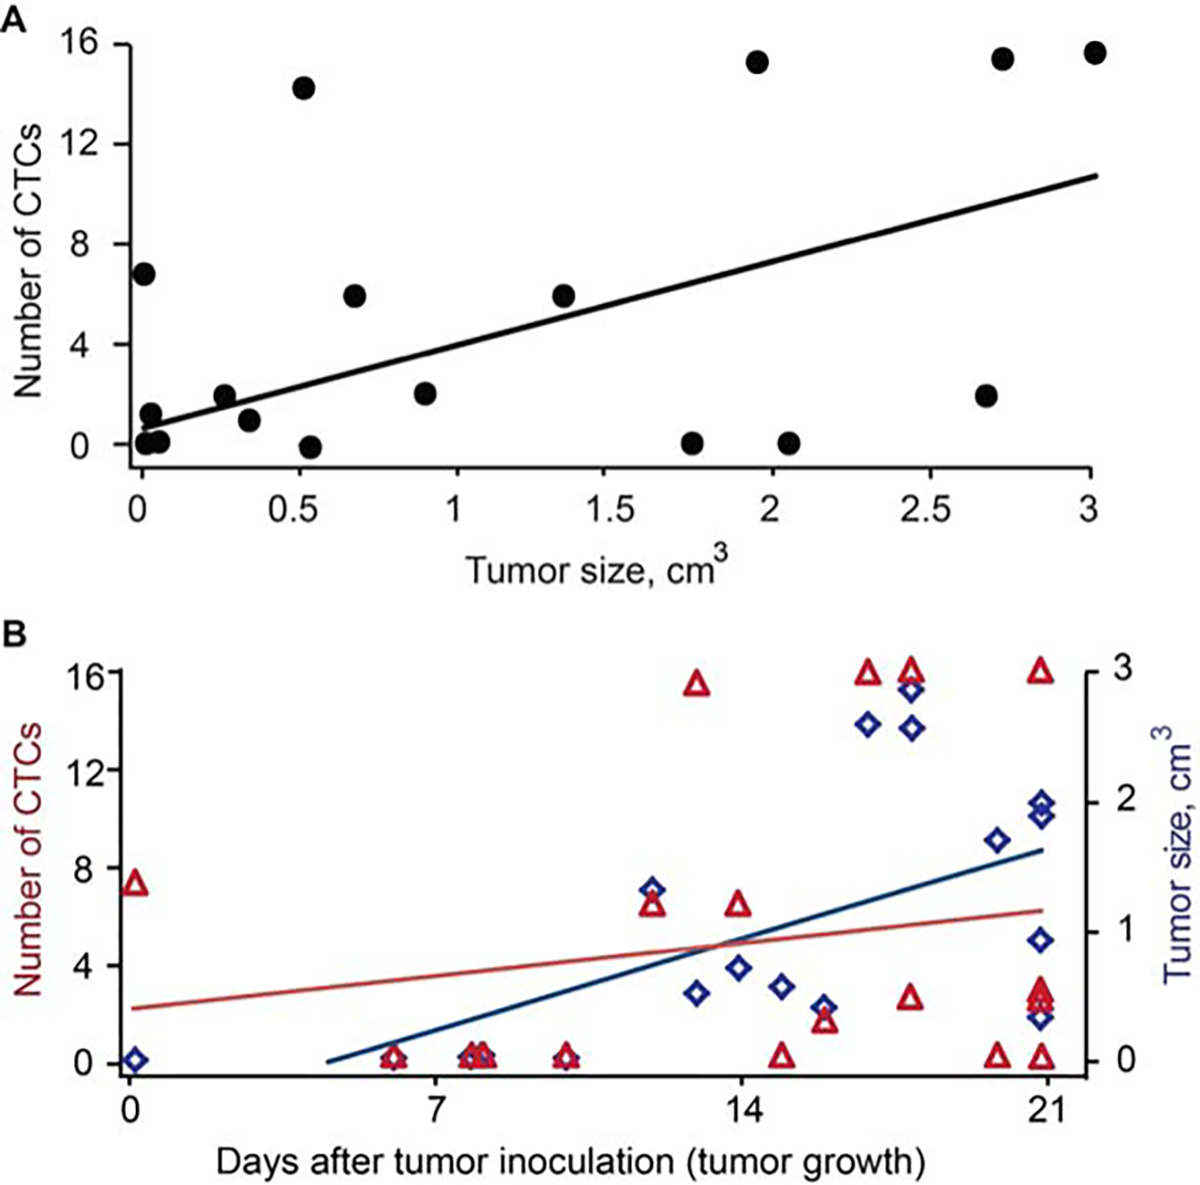
Melanoma circulating tumor cell (CTC) rate in ear blood vessel at different stages of tumor development for 18 mice with skin and ear melanoma. (A) CTC dynamic versus tumor volume of the subcutaneous melanoma tumor model measured by in vivo photoacoustic and fluorescence flow cytometry during 3 weeks after tumor implantation (Spearman correlation = 0.456; p = .057). (B) CTC dynamic and tumor size versus tumor growth in the subcutaneous melanoma model. Tumor size versus tumor growth: spearman correlation 0.705; p = .0007 and CTC dynamic versus tumor growth: spearman correlation 0.211; p = .37. The volume (size) was calculated using standard clinical method.
Excess circulating tumor cell release with treatment as compared to baseline daily circulating tumor cell release
The rate of CTC detection before application of pressure, complete resection, or incisional biopsy, respectively, was 1.15, 1.29, and 1.0 cells per 10 minutes per mouse, consistent with a CTC rate of 0.114 cells/minute. Mice subjected to the pressure were continuously monitored for 260 minutes after pressure began, during which time the CTC detection rate rose, and then fell back to the levels prior to applying pressure (Figure 4A). In the absence of pressure we expected to detect only 29.6 CTCs per mouse during this time, but we actually detected 194 CTCs per mouse. These results demonstrated that only one procedure of pressure led to the 164.4 extra CTCs released that day in the mouse. Similarly, mice subjected to incisional biopsy were continuously monitored for 280 minutes after the biopsy began, during which time the CTC detection rate rose, and then 3 fell back to the levels observed prior to their biopsy (Figure 6A). Without an incisional biopsy, we expected to detect only 32 CTCs per mouse during this time, but we actually detected 510.2 CTCs per mouse, due to the incisional biopsy. These results demonstrated that only 1 incisional biopsy led to the 478.2 extra CTCs released that day in the mouse.
DISCUSSION
The major finding of this research is that tumor manipulation can enhance the release of cancer cells from the primary tumor into the circulatory system. We have implemented a 2-channel detection system to monitor both pigmented and fluorescent CTCs directly in the blood. In the PA mode, CTCs were detected among RBCs in vivo if their light absorbance was higher than that of the surrounding RBC background, as is the case of intrinsically pigmented melanoma cells10,18 (or cells that have strongly absorbing nanoparticles bound to them).11,18 In fluorescent methods, CTCs were detected among RBCs if the GFP-related fluorescence from them was higher than the background autofluorescence from blood. Thus, no leukocytes or endothelial cells could be detected using PA and fluorescence methods because these cells are not pigmented and provide low fluorescence as compared to CTCs with GFP and autofluorescence from blood.14 The character of CTC shedding was altered when various interventions were applied to the primary tumor. We discovered that some medical procedures either initiated CTC release in the blood, which previously had not contained CTCs, or dramatically increased CTC counts above the initially recorded level by up to 60-fold. Recent studies have shown decrease in CTC count after surgery using in vivo fluorescent flow cytometry.19 However these measurements were performed several hours after tumor resection, and likely could miss the CTC increase during or immediately after surgery. Other fluorescent studies have revealed an increase in CTC counts in lymphatic vessels after applying 25 or 250 g pressure on the tumor, but no dynamics studies were performed.20 Our study revealed the influence of tumor compression in 2 different cell lines (melanoma and breast cancer cells) on CTC count. The significant increase of CTC release (a total of 1000 CTCs as compared to 23 CTCs before pressure) from the tumor tissues into the bloodstream was observed after a 120 g weight (or greater) was applied. One mouse with a 260 mm3 melanoma tumor developed 3 lung micrometastases after tumor manipulation using 120 g weight pressure. In our experiments, no CTC response was observed at weights below 50 g.
It is interesting that the in vivo PA and fluorescent flow cytometry results show that complete resection of melanoma tumors, using positive 1- to 2-mm margin, dramatically decreased the CTC detection rate down to disappearance, confirming a positive effect of the resection if CTCs originate from a primary tumor. All the mice demonstrated a decrease in CTCs after removing the tumor, and no metastasis was observed in the histology tests. On the contrary, incisional biopsy led to a marked increase in CTC release in melanoma mice, such that the cell detection rate showed a 57-fold increase from baseline during the 15-minute biopsy duration. To verify the effect of tumor resection, a complete tumor resection or second biopsy after the incisional biopsy was additionally performed. We observed CTC release during tumor resection with manipulation in 2 mice. However, no CTCs were detected after the complete resection. At the second biopsy, a wave of CTC release was observed in 2 mice, but the numbers were less than the first time. We suspect that the second biopsy had injured new vessels in the tumor tissue, which led to a renewed release of CTCs. In the mouse breast cancer model, we used a CW laser in a therapeutic dose exposure to the tumor, and after irradiation, we observed a marked increase in CTCs. The varied release of the CTC count between the mice for the same tumor manipulation procedure could be due to a difference of tumor size, their heterogeneities, and/ or various blood vasculature. The first CTC increase appeared 3 to 15 minutes after the incisional biopsy, tumor exposure with laser, or after pressure was applied. The maximum CTC rate occurred 10 minutes to 1 hour after beginning the tumor manipulation. This delay is most likely explained by the time it took for the tumor cells to penetrate the bloodstream. In addition, we assessed the correlation between CTC dynamics and tumor size and found that, in general, CTC dynamics show a positive correlation with the subcutaneous melanoma tumor size, although some of these data showed a decrease in CTCs with increased tumor volume in a few animals. Definitely, this important issue requires further study. The increased number of manipulation-induced CTCs may increase the risk of metastases. Indeed, there is growing evidence that the presence of CTCs in the blood of patients with cancer is an important indicator of metastatic disease and poor prognosis, even with tumors having a low risk of metastasis.21–23 Because of existing immune dysfunction(s) in patients with cancer, there may be a higher risk of metastasis after marked release of CTCs by tumor manipulation, such as palpation, incisional biopsy, or laser surgery.24 However, to determine the link between CTC release and metastasis, additional studies are required.
In this work, we present experimental evidence that some therapeutic interventions or associated medical procedures can cause an enhancement of CTC dissemination. Our results warrant some precaution during physical examination and incisional biopsy. Patients and doctors should be advised not to press on tumors aggressively. New preclinical studies with long-term monitoring of CTC release and metastasis development are in progress in our laboratory in order to provide insight into the risk of metastasis during various medical procedures, as well as clinical trials using patients to monitor in vivo CTCs during physical examination, biopsy, and excision.
We believe that some interventions, in particular pressure and potentially temperature or ultrasound, could be used to provoke cancer cell release in the bloodstream, and be detected using an in vivo PAFC system. According to our estimation, this CTC amplification could increase the sensitivity of early diagnosis of a small tumor, which is not detectable using conventional methods.
In conclusion, we present, for the first time, experimental evidence that some tumor manipulation, such as palpation during physical examination, incisional biopsy, or laser therapy, could enhance penetration of cancer cells from a primary tumor into the blood circulation. However, after tumor resection without manipulation, there is decreased tumor cell release into the blood flow or complete CTC disappearance. The further improvement of the described technology could be based on exploring lowtoxicity plasmonic nanoparticles (eg, gold nanospheres25 or golden carbon nanotubes11) with ultrasharp photothermal and PA spectral resonances13,25 for amplified multiplex molecular theranostics as an integration of PA detection and photothermal eradiation of CTCs10,16 targeted by functionalized nanoparticles.
Acknowledgments
We thank Drs. L. Hennings, C. Wang, S. Foster, C. Skill, S. Ferguson, and J. Ye, who assisted with cell culture, histology, and laser measurements.
Contract grant sponsor:
The Deutsche Forschungsgemeinschaft (DFG-German Research Foundation Grant, JU 2814/1-1), Arkansas Breast Cancer Research Program Grant (ABCRP-FY13), National Institutes of Health Grants R01EB009230, and R01CA131164, NSF Grant DBI-0852737, and by the DoD Grants W81XWH-11-1-0123 and W81XWH-11-1-0129.
REFERENCES
- 1.Maheswaran S, Sequist LV, Nagrath S, et al. Detection of mutations in EGFR in circulating lung-cancer cells. N Engl J Med 2008;359:366–377. [DOI] [PMC free article] [PubMed] [Google Scholar]
- 2.Yu M, Stott S, Toner M, Maheswaran S, Haber DA. Circulating tumor cells: approaches to isolation and characterization. J Cell Biol 2011;192: 373–382. [DOI] [PMC free article] [PubMed] [Google Scholar]
- 3.Park SY, Choi GS, Park JS, Kim HJ, Ryuk JP, Choi WH. Influence of surgical manipulation and surgical modality on the molecular detection of circulating tumor cells from colorectal cancer. J Korean Surg Soc 2012;82: 356–364. [DOI] [PMC free article] [PubMed] [Google Scholar]
- 4.Sawabata N, Okumura M, Utsumi T, et al. Circulating tumor cells in peripheral blood caused by surgical manipulation of non-small-cell lung cancer: pilot study using an immunocytology method. Gen Thorac Cardiovasc Surg 2007;55:189–192. [DOI] [PubMed] [Google Scholar]
- 5.Cristofanilli M, Budd GT, Ellis MJ, et al. Circulating tumor cells, disease progression, and survival in metastatic breast cancer. N Engl J Med 2004; 351:781–791. [DOI] [PubMed] [Google Scholar]
- 6.Cristofanilli M, Hayes DF, Budd GT, et al. Circulating tumor cells: a novel prognostic factor for newly diagnosed metastatic breast cancer. J Clin Oncol 2005;23:1420–1430. [DOI] [PubMed] [Google Scholar]
- 7.Andreopoulou E, Cristofanilli M. Circulating tumor cells as prognostic marker in metastatic breast cancer. Expert Rev Anticancer Ther 2010;10: 171–177. [DOI] [PubMed] [Google Scholar]
- 8.Hayes DF, Cristofanilli M, Budd GT, et al. Circulating tumor cells at each follow-up time point during therapy of metastatic breast cancer patients predict progression-free and overall survival. Clin Cancer Res 2006;12(14 Pt 1):4218–4224. [DOI] [PubMed] [Google Scholar]
- 9.Riethdorf S, Fritsche H, Müller V, et al. Detection of circulating tumor cells in peripheral blood of patients with metastatic breast cancer: a validation study of the CellSearch system. Clin Cancer Res 2007;13:920–928. [DOI] [PubMed] [Google Scholar]
- 10.Galanzha EI, Shashkov EV, Spring PM, Suen JY, Zharov VP. In vivo, noninvasive, label-free detection and eradication of circulating metastatic melanoma cells by two-color photoacoustic flow cytometry and a diode laser. Cancer Res 2009;69:7926–7934. [DOI] [PMC free article] [PubMed] [Google Scholar]
- 11.Galanzha EI, Shashkov EV, Kelly T, Kim JW, Yang L, Zharov VP. In vivo magnetic enrichment and multiplex photoacoustic detection of circulating tumour cells. Nat Nanotechnol 2009;4:855–860. [DOI] [PMC free article] [PubMed] [Google Scholar]
- 12.Galanzha EI, Sarimollaoglu M, Nedosekin DA, Keyrouz SG, Mehta JL, Zharov VP. In vivo flow cytometry of circulating clots using negative photothermal and photoacoustic contrasts. Cytometry A 2011;79:814–824. [DOI] [PMC free article] [PubMed] [Google Scholar]
- 13.Zharov VP. Ultrasharp nonlinear photothermal and photoacoustic resonances and holes beyond the spectral limit. Nat Photonics 2011;5:110–116. [DOI] [PMC free article] [PubMed] [Google Scholar]
- 14.Galanzha EI, Zharov VP. In vivo photoacoustic and photothermal cytometry for monitoring multiple blood rheology parameters. Cytometry A 2011; 79:746–757. [DOI] [PMC free article] [PubMed] [Google Scholar]
- 15.Tuchin VV, Tárnok A, Zharov VP. In vivo flow cytometry: a horizon of opportunities. Cytometry A 2011;79:737–745. [DOI] [PMC free article] [PubMed] [Google Scholar]
- 16.Galanzha EI, Zharov VP. Photoacoustic flow cytometry. Methods 2012;57: 280–296. [DOI] [PMC free article] [PubMed] [Google Scholar]
- 17.Nedosekin DA, Sarimollaoglu M, Galanzha EI, et al. Synergy of photoacoustic and fluorescence flow cytometry of circulating cells with negative and positive contrasts. J Biophotonics 2013;6:425–434. [DOI] [PMC free article] [PubMed] [Google Scholar]
- 18.Georgakoudi I, Solban N, Novak J, et al. In vivo flow cytometry: a new method for enumerating circulating cancer cells. Cancer Res 2004;64: 5044–5047. [DOI] [PubMed] [Google Scholar]
- 19.Fan ZC, Yan J, Liu GD, et al. Real-time monitoring of rare circulating hepatocellular carcinoma cells in an orthotopic model by in vivo flow cytometry assesses resection on metastasis. Cancer Res 2012;72:2683–2691. [DOI] [PubMed] [Google Scholar]
- 20.Hayashi K, Jiang P, Yamauchi K, et al. Real-time imaging of tumor-cell shedding and trafficking in lymphatic channels. Cancer Res 2007;67:8223–8228. [DOI] [PubMed] [Google Scholar]
- 21.Barbazán J, Alonso–Alconada L, Muinelo–Romay L, et al. Molecular characterization of circulating tumor cells in human metastatic colorectal cancer. PLoS One 2012;7:e40476. [DOI] [PMC free article] [PubMed] [Google Scholar]
- 22.Lucci A, Hall CS, Lodhi AK, et al. Circulating tumour cells in nonmetastatic breast cancer: a prospective study. Lancet Oncol 2012;13:688–695. [DOI] [PubMed] [Google Scholar]
- 23.Giordano A, Cristofanilli M. CTCs in metastatic breast cancer. Recent Results Cancer Res 2012;195:193–201. [DOI] [PubMed] [Google Scholar]
- 24.Whiteside TL. Immune suppression in cancer: effects on immune cells, mechanisms and future therapeutic intervention. Semin Cancer Biol 2006; 16:3–15. [DOI] [PubMed] [Google Scholar]
- 25.Shao J, Griffin RJ, Galanzha EI, et al. Photothermal nanodrugs: potential of TNF-gold nanospheres for cancer theranostics. Sci Rep 2013;3:1293. [DOI] [PMC free article] [PubMed] [Google Scholar]


