Abstract
Aims
There is a wide spectrum of diseases associated with pulmonary hypertension, pulmonary vascular remodelling, and right ventricular dysfunction. The NIH-sponsored PVDOMICS network seeks to perform comprehensive clinical phenotyping and endophenotyping across these disorders to further evaluate and define pulmonary vascular disease.
Methods and results
Echocardiography represents the primary non-invasive method to phenotype cardiac anatomy, function, and haemodynamics in these complex patients. However, comprehensive right heart evaluation requires the use of multiple echocardiographic parameters and optimized techniques to ensure optimal image acquisition. The PVDOMICS echo protocol outlines the best practice approach to echo phenotypic assessment of the right heart/pulmonary artery unit.
Conclusion
Novel workflow processes, methods for quality control, data for feasibility of measurements, and reproducibility of right heart parameters derived from this study provide a benchmark frame of reference. Lessons learned from this protocol will serve as a best practice guide for echocardiographic image acquisition and analysis across the spectrum of right heart/pulmonary vascular disease.
Keywords: pulmonary hypertension, echocardiography, right ventricle, strain, TAPSE, fractional area change
Introduction
There is a wide spectrum of diseases associated with pulmonary hypertension (PH), pulmonary vascular remodelling, and right ventricular (RV) dysfunction. The genetic, molecular, and cellular processes driving these phenomena are not well understood. There is a need to determine homologies and differences across the breadth of disease states associated with PH and RV decompensation that often complicates these conditions. PH is currently classified according to the World Symposium on Pulmonary Hypertension (WSPH) groups, which focus on clinical and haemodynamic subsets.1 Although, it is likely that there are common pathophysiologic features that span across these different clinical groups.
The goal of the NIH-sponsored PVDOMICS network is to perform comprehensive clinical phenotyping (demographic, physiologic, clinical chemistries, and imaging) and endophenotyping (genomic, proteomic, metabolomic, coagulomic, cell, and/or tissue based) across the WSPH classified PH clinical groups 1 through 5, including intermediate phenotypes and those without PH, in order to deconstruct the traditional classification and define meaningful sub classifications of patients with and at risk for developing pulmonary vascular disease (PVD).2–4 Echocardiography represents the primary non-invasive test used clinically for estimation of pulmonary pressures, assessment of RV function, and evaluation of other relevant ancillary findings such as left heart pathologies, valvular dysfunction, and intra-cardiac shunts.
To enable accurate and reproducible phenotyping of PH groups, we developed a comprehensive PVDOMICS echocardiogram acquisition and analysis protocol (Supplementary data online, Files S1 and S2), and study Manual of Procedures (Supplementary data online, File S3). This manuscript describes the techniques and measurements included within the echo methodology of the study, the rationale for the selection of these parameters, the processes used for Echo Corelab image reading, and the technical limitations encountered during image acquisition and subsequent analysis. The resultant comprehensive imaging assessment of 1197 subjects also facilitated a unique opportunity to determine the reproducibility of right heart echo parameters. In addition to providing a comprehensive overview of our PVDOMICS echo phenotyping methodology, we seek to use the lessons learned in this unique study to provide a best practice approach to echo assessment of the right heart/pulmonary artery unit for clinicians practicing in this sub-specialty area.
Echocardiographic technical factors
Subjects were recruited from six study sites. Echo equipment was validated and calibrated prior to study participation and standardized echo protocols were utilized. To remove vendor and site-specific variation in data, measurements were obtained offline by the Echo Corelab. Workflow and transfer process is described below. Assessment of echo parameters was performed using a vendor-neutral analysis program (Syngo Dynamics; Siemens), apart from strain, which was measured by a vendor-neutral strain specific platform [vector velocity imaging (VVI)].
Digital capture
Echo images were obtained in the left lateral decubitus position using harmonic imaging. A study accredited physician or sonographer performed all exams. At least 4–5 cardiac cycles of each view were captured, which increased to ≥10 in atrial fibrillation. Capturing images during end expiration (apnoea) was encouraged, to maintain quality, and reduce image translation. Gain, compression, depth, and image sector width were optimized.
Frame rate
High rates (60–90 frames/s) suitable for offline volumetric, tissue Doppler, and strain analysis were used.
Doppler and M-mode
For spectral Doppler, sweep speed was maintained between 50 mm/s and 100 mm/s with scale and baseline adjusted so the entire Doppler signal was visualized. For spectral and colour Doppler, the appropriate gain level was selected to detect flow without extraneous noise or extension of signal into adjoining tissue.
Echo/ultrasound enhancing agent
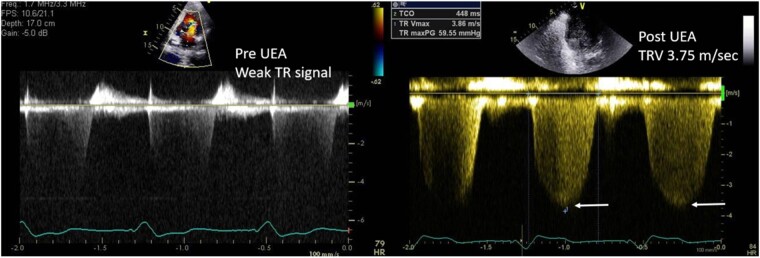
If visualization of the LV or RV endocardial border was inadequate, then an ultrasound enhancing agent (UEA) was administered following standard recommendations.5 Acquisition of tricuspid regurgitant (TR) continuous wave (CW) spectral Doppler traces was repeated in subjects given UEA. Gains were adjusted to optimize the resultant TR velocity signal (Figure 1).
Figure 1.
Optimizing tricuspid velocity spectral Doppler signal with UEA.
Echo views and RV size
Echocardiography remains the workhorse for assessment of the right heart, even in this evolving era of multi-modality imaging. RV dilation and dysfunction are known to portend poor prognosis in a wide spectrum of cardiac disorders.6,7 However, the RV can be difficult to assess due to its complex anatomy, which has a triangular vertical shape, and crescentic transverse orientation, compared to the more cylindrical LV. Although the RV is marginally larger than the LV, with respect to volume, its considerably lower stroke work means that its mass is about one-sixth by comparison.8 Hence, any increase in RV afterload, as is seen in the setting of PH, can dramatically impact the geometry and thickness of the RV. To ensure complete assessment of the RV, seven standard echocardiographic views, along with inclusion of a reversed apical four-chamber view to optimize alignment of the TR jet for Doppler interrogation were included.9–11 Standard imaging of the LV and other cardiac structures was performed.
Apical four-chamber RV-focused view
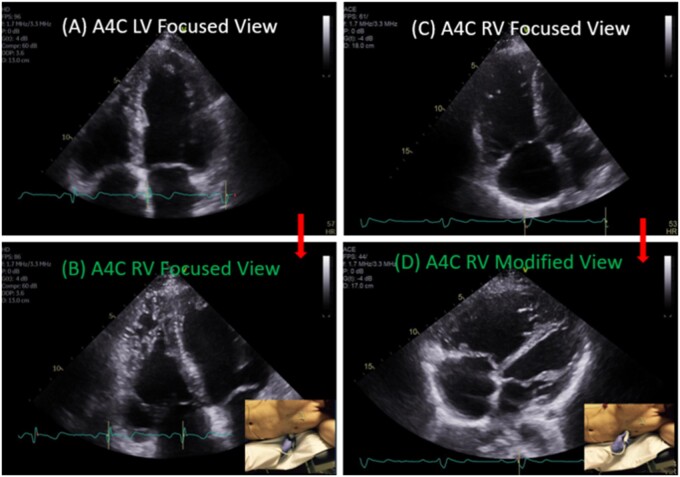
RV linear dimensions and areas (systolic and diastolic) were measured from the RV-focused apical four-chamber view. Optimized visualization of the entire RV lateral wall myocardium was ensured for accurate analysis. To ensure high frame rate for strain analysis, acquisition with the sector size narrowed to just overlie the RV was also performed (Figure 2).
Figure 2.
Conventional LV focused (A) vs. RV-focused (B) apical four-chamber (A4C) view.
Linear measurements and chamber quantification
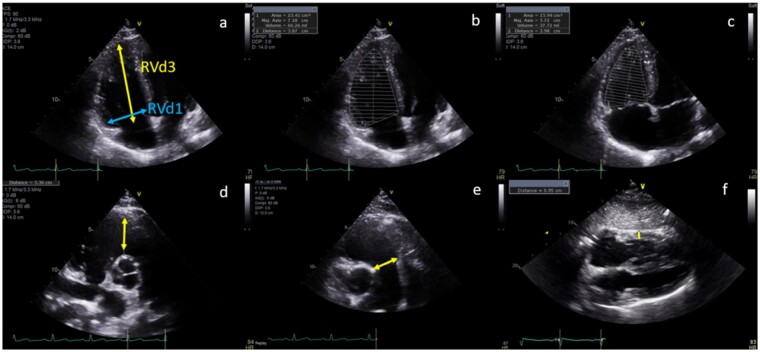
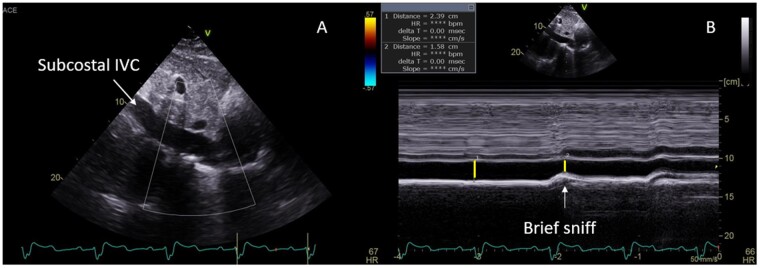
All linear, area, and volume measurements were performed offline by the Echo Corelab per guideline recommendations (Supplementary data online, Appendix S1).12 RV free wall thickness at end-diastole using M-mode or 2D images was measured from the subcostal four-chamber view at the level of the tricuspid valve chordae tendinae, with wall thickness >5 mm defined as RV hypertrophy. Adequate subcostal imaging was also important for assessment of IVC dimension and hepatic venous flow by Pulsed wave (PW) Doppler (Figures 3 and 4, Table 1).
Figure 3.
Parameters of right heart structure: (A) End-diastolic basal RV diameter (RVd1) and length (RVd3); RV diastolic (B) and systolic (C) area; proximal (D); and distal (E) RVOT linear end-diastolic diameter and RV free wall end-diastolic thickness.
Figure 4.
Inferior vena cava (IVC) size and collapsibility sniff on 2D (A) and M-mode (B) imaging.
Table 1.
Parameters of right heart structure
| Parameter | Abnormal threshold5,10,12 | Mean PVDOMICS values (n = 1197) | Feasibility (%) |
|---|---|---|---|
| n = 1077 | |||
| RV diastolic area | >24 cm2 | 24.6 ± 8.7 | 85.4 |
| RV systolic area | >15 cm2 | 16.6 ± 8.1 | 84.5 |
| RV diastolic basal dimension | >4.1 cm | 4.2 ± 0.82 | 91.4 |
| RV free wall thickness | >0.5 cm | 0.57 ± 0.16 | 89.4 |
| RVOT distal dimension | >2.7 cm | 2.6 ± 0.32 | 54.0 |
| RVOT proximal dimension | >3.6 cm | 3.5 ± 0.64 | 87.3 |
Echocardiographic techniques for assessment of RV function
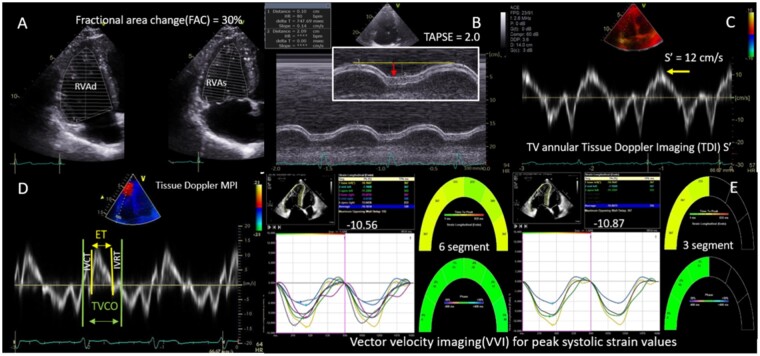
The most validated measures of RV longitudinal motion involve M-mode and tissue Doppler imaging (TDI) techniques. Hence, these were included with acknowledgement that these load-dependent parameters underestimate RV radial dysfunction and can appear overestimated due to translational motion from adjacent LV.13 Tricuspid Annular Plane Systolic Excursion (TAPSE) was derived from M-mode analysis of the lateral tricuspid annular longitudinal movement towards the apex. Resultant TAPSE was measured in cm from end-diastole to peak-systole.14 TAPSE was feasible in 83% of subjects. TDI of the lateral tricuspid valve annulus moving towards the RV apex was used to estimate the RV free wall systolic peak velocity (RV S’ in cm/s) as a measure of RV performance. S’ was feasible in 87% of subjects. Both TAPSE and S’ were performed on an RV-focused apical four-chamber view, with care taken to align the measurement parallel to the RV basal lateral wall, to avoid under-estimation (Figure 5 and Table 2).
Table 2.
Parameters of right heart function
| Parameter | Abnormality threshold5,10,12,16–25 | Mean ± SD | Feasibility (%) n = 1077 |
|---|---|---|---|
| TAPSE (cm) | <1.7 | 1.9 ± 0.49 | 82.7 |
| PW Doppler s’ (cm/s) | <9.5 | 11.7 ± 3.0 | 87.2 |
| RV FAC (%) | <35 | 34.9 ± 10.4 | 84.3 |
| PW Doppler MPI | >0.40 | 0.43 ± 0.22 | 56.7 |
| Tissue Doppler MPI | >0.55 | 0.57 ± 0.29 | 73.8 |
| 2D RV free wall strain (three-segment) (%) | >–21 | –20.7 ± 6.5 | 69.3 |
| 2D RV strain (six-segment) (%) | >–20 | –19.1 ± 5.5 | 67.7 |
| 3D RVEF (%) | <45 | 43.6 ± 11.6 | 18.5a |
3D EF performed in 46% (n = 485; 199 adequate for RV volumes and RVEF).
Figure 5.
Two-dimensional and Doppler parameters of RV function. (A) RV FAC derived using end-diastolic (RVAd) and end-systolic (RVAs) areas. (B) TAPSE measured with M-Mode (red arrow). (C) TV annular peak systolic velocity (S’) using TDI. (D) MPI derived from RV systolic ejection time, isovolumetric contraction time (IVCT), and isovolumetric relation time (IVRT) using TDI, where MPI = (IVCT + IVRT)/ET. (E) VVI derived three-segment and six-segment RV longitudinal strains.
Quantitation of global RV function can be performed by fractional area change (FAC), 3-dimensional RV ejection fraction (3D RVEF), and RV index of myocardial performance (RIMP).12 FAC is the most widely used and quantitates the fractional decrease in RV area from end-diastole to end-systole as measured on the RV-focused apical four-chamber view. Although it accounts for both longitudinal and radial RV motion, it is limited by failure to include the RV outflow tract. Performance of 2D echo RVEF similarly results in under-estimation of volumes, so is not routinely performed.15,16 Superior assessment of RV volumes and RVEF is provided by 3D echo, as inflow, outflow, and apical regions are included regardless of geometry. However, widespread adoption of 3D echo has been limited by technical difficulties in acquiring good simultaneous endocardial definition of all RV walls.12,17 RVEF is typically lower than LVEF due to larger RV diastolic volumes.
3D PVDOMICS protocol
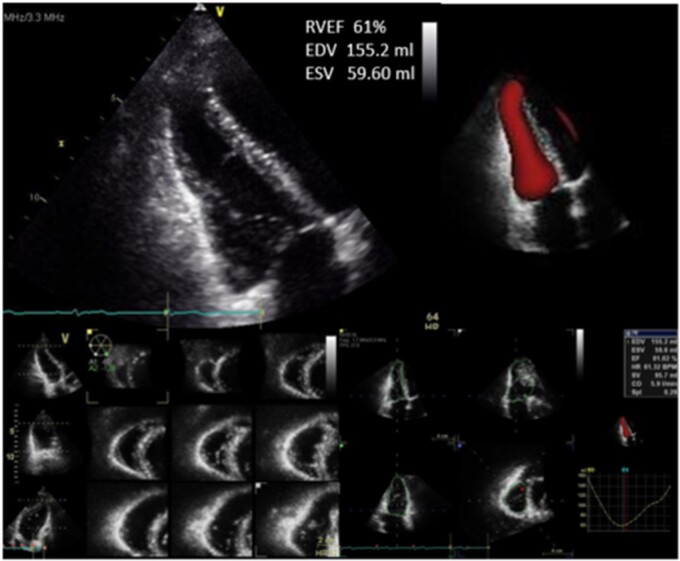
Study sites were requested to acquire 3D full volume acquisitions of the LV and RV from a focused four-chamber view and RVOT from a parasternal short-axis view acquired over four beats. Images were ideally acquired with optimized gains during a breath hold and normal sinus rhythm, to minimize stitch artefact. Optimal 3D imaging was performed with temporal resolution of at least 20–25 volumes/s and well-defined endocardium in both end-diastolic and end-systolic frames.12,18,19 3D datasets were analysed by the Echo Corelab using vendor proprietary software for post-processing (Figure 6).
Figure 6.
Multiple beat capture 3D imaging renders RV end-systolic and end-diastolic volumes to estimate RVEF.
RIMP [also known as RV myocardial performance index (MPI) or Tei index] provides a global estimate of RV systolic and diastolic function.20 It can be falsely abnormal in the setting of elevated right atrial (RA) pressure so was not used to evaluate the PH population.
Abnormal septal motion is a common finding in PH, although can also be noted with abnormal conduction, previous cardiac surgery, or constrictive physiology. In PH, systolic septal flattening causes distortion of LV geometry (quantitated as the eccentricity index), which can lead to eventual LV systolic dysfunction.21 This septal response is related to ventricular interdependence, with increased right heart afterload causing increased RV pressures. TR is commonly associated, as a consequence of RV annular dilation. This potentiates LV diastolic dysfunction via diastolic septal flattening. The presence of septal flattening was recorded for all echoes. Contribution of abnormal septal motion to global RV function is poorly defined and will be explored in this study.
Strain imaging
Deformation imaging can be used to establish 2D global longitudinal strain or strain rate for the RV.13 Longitudinal 2D strain is calculated for the RV by averaging the values of strain in the basal, mid, and apical segments of the RV lateral wall (three-segments) in isolation or together with the interventricular septum (six-segments). Several studies have suggested improved prognostic ability and reproducibility using just free wall strain, although consensus regarding the optimum method remains lacking. To minimize inter-vendor variability of strain across studies and evaluate the optimum technique in PH, the Corelab measured RV (three- and six-segments), and LV strain (two-, four-, and three-chamber views) from raw data images using VVI software (Siemens).
Diastolic function
Assessment of RV diastolic dysfunction can be performed analogous to assessment of LV diastolic function. This relies on multiple parameters, of which RA enlargement infers chronicity of elevated right heart pressures.10 The E/E’ ratio non-invasively estimated RV filling pressures.22 RV diastolic function was graded as normal or impaired (Grades 1–3) (Table 3). The presence of RV hypertrophy and RV systolic dysfunction were ancillary indicators of RV diastolic dysfunction (Table 4).
Table 3.
RV diastolic function
| Diastolic stage | Abnormality threshold | Doppler parameter | n = 1077 (%) |
|---|---|---|---|
| Normal | 320 (30%) | ||
| Grade 1 | TV E/A ratio <0.8 | PW TV inflow (any view) | 168 (15%) |
| TV E/e’ ratio <0.5 | PW TDI TV basal annulus (A4C view) | ||
| Grade 2 | E/A ratio 0.8–2.1 with E/e’ ratio >6 or | PW TV inflow (any view) | 67 (6%) |
| HV diastolic predominance (S < D) | PW TDI TV basal annulus, A4C view | ||
| PW HV, subcostal view | |||
| Grade 3 | TV E/A ratio > 2.1 with TV deceleration time <120 ms or late diastolic antegrade flow in the PA | PW TV inflow | 6 (1%) |
| PW in the pulmonary artery | |||
| Not measurable (NM) | Missing data, poor quality, or severe TR | 516 (48%) |
Table 4.
Indirect signs of diastolic dysfunction
| Indirect sign of diastolic abnormality | Technical considerations | Abnormality cut-off value10 |
|---|---|---|
| RV hypertrophy | Subcostal view, zoom preferred | >0.5 cm |
| RA volume | A4C view, largest end-systolic RA cavity dimension | >25 ± 7 mL/m2 in men |
| >21 ± 6 mL/m2 in women | ||
| Dilated non-collapsing IVC | Subcostal view | IVC > 2.1 cm, plethoric-no collapse |
| IAS bulges towards the LA | A4C view, alternate PSAX view at | >15 mm shift from midline |
| 3-valve level | ||
| HV diastolic flow predominance | Subcostal view, PW Doppler positioned 0.5–1.0 cm in the HV | Systolic blunting ± reversal with increased diastolic flow suggestive of increased right heart pressures |
Echocardiographic assessment of RV haemodynamic parameters in PH
Doppler
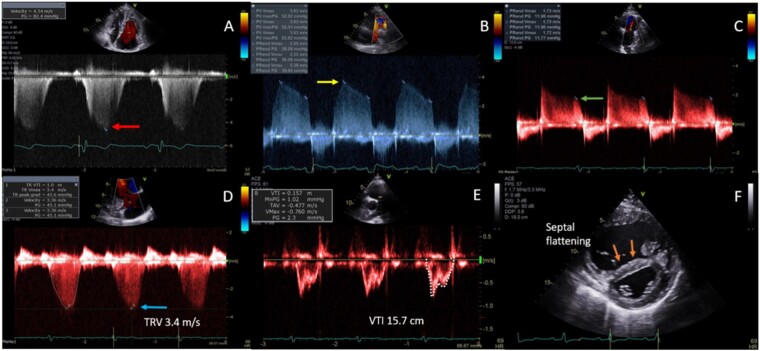
Presence and severity of valvular regurgitation or stenosis were performed with spectral and colour Doppler evaluation. PW Doppler imaging of the RVOT and tricuspid inflow, along with CW Doppler across the pulmonic, and tricuspid valves for non-invasive estimation of RV and pulmonary artery pressures (Figure 7 and Table 5).
Figure 7.
RV haemodynamic parameters. (A) Pulmonary artery pressure (PASP) estimated using CW peak TR velocity (TRV, red arrow). (RVSP = 4V2) (PASP = RVSP + RAP). (B) mPAP estimated from pulmonary insufficiency using CW Doppler (CW, yellow arrow) [mPAP = 4V2 + RAP]. (C) Pulmonary artery end-diastolic pressure (PAEDP) estimated from pulmonary insufficiency using CW Doppler (green arrow) [PAEDP = 4V2 + RAP]. (D) Estimation of pulmonary vascular resistance (PVR) from (D) the peak TRV (blue arrow) and (E) the RVOT velocity time integral (VTI, white trace). (PVR = TRV m/s ÷ RVOT VTI cm × 10 + 0.16). (F) Interventricular septal flattening (orange arrows) correlates with right-sided pressure (systolic) and/or volume (diastolic) overload.
Table 5.
Echo RV haemodynamic parameters
| Doppler parameter | Abnormality threshold10 | Mean ± SD | Feasibility (%) | Formula for estimation |
|---|---|---|---|---|
| Pulmonary artery systolic pressure (PASP) from peak TR velocity or RVSP | >40 mmHg | 51.4 ± 23.3 | 83 | RVSP = 4V2 |
| PASP = 4V2 + RAP | ||||
| (V = peak TRV) | ||||
| RVSP aided by agitated saline/enhancing agent | >40 mmHg | 52.0 ± 22.9 | 12a | RVSP = 4V2 |
| PASP = 4V2 + RAP | ||||
| (V = peak TRV) | ||||
| mPAP from peak pulmonary insufficiency(PI) jet (early) | ≥ 25 mmHg | 28.4 ± 14.1 | 25 | mPAP = 4V2 + RAP |
| (V = PI early peak) | ||||
| Pulmonary artery end-diastolic pressure (PAEDP) from peak PI jet (late) | >15 mmHg | 16.2 ± 8.8 | 43 | PAEDP = 4V2 + RAP |
| (V = PI late peak) | ||||
| Pulmonary vascular resistance (PVR) | >3.0 WU | –– | –– | PVR = TRV m/s ÷ RVOT VTI (cm) x 10 + 0.16 |
| Change in LV shape due to septal flattening | >1.2 | –– | –– | LV eccentricity index = D2/D1 |
Agitated saline/enhancing agent used in 185 subjects, 12% had increase in TR velocity achieved.
CW Doppler of the TR signal was used to estimate RV systolic pressure (RVSP) and was feasible in 83% of subjects. Standardized, off-axis, and reversed apical four-chamber views of the right heart were used to optimize the highest and most complete spectral Doppler signal. Respiratory variation of signal was alleviated by acquiring at end expiration. RVSP was calculated from the peak velocity of the TR Doppler jet by the simplified Bernoulli Equation (4 × TR peak velocity2).23 Peak systolic pulmonary artery pressure (PASP) was then estimated by adding RA pressure to RVSP, assuming absence of RVOT or pulmonic valve stenosis.10 RA pressure was estimated from properties of the inferior vena cava on subcostal imaging, with dilated calibre, and reduced collapsibility on inspiration by M-mode, suggestive of elevated pressure.7,10 RVSP was not estimated in severe TR, due to likely under-estimation of RVSP due to rapid equalization of RV and RA pressures. RVSP was only estimated from peak TR velocity when a complete TR spectral Doppler envelope could be acquired, to avoid under-estimation. CW Doppler of the pulmonic regurgitant (PR) jet was used to measure PR-end velocity, from which the pulmonary artery diastolic pressure (PADP) was derived using the simplified Bernoulli equation: 4 (PR-end velocity)2 + RA pressure. Mean pulmonary artery pressure (mPAP) was calculated from: 2/3rd of PADP + 1/3rd of PASP. The shape of the pulmonary artery PW Doppler profile was graded for systolic notching, a marker of abnormal valve motion in the setting of PH.24 While echo derived RV stroke volume can estimate cardiac output (CO), accurate measurement of the dilated RVOT often limits the utility of this technique.25
Assessment for an intra-cardiac shunt
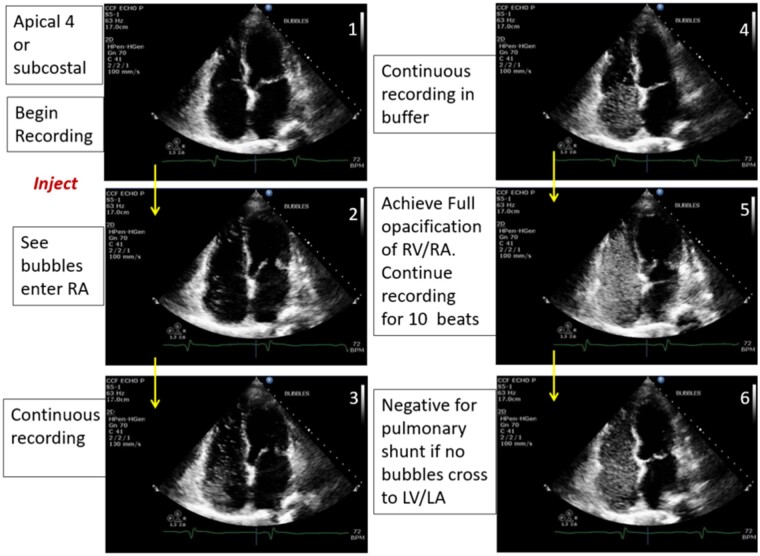
Subjects without a history of congenital heart disease underwent screening for occult intra-cardiac shunts with estimation of pulmonic to systemic flow ratio (Qp: Qs) and screening with agitated saline contrast26 (Figure 8). Qp:Qs >1.2 was defined as suggestive of a left to right intra-cardiac shunt. Passage of bubbles from the right to the left heart within five beats was defined as an intra-cardiac shunt, while left-sided bubbles noted after more than five beats were suggestive of an intra-pulmonary shunt.27 Agitated saline was used to enhance any incomplete TR jets to determine the TR peak velocity, increasing feasibility of measurement by 12%.
Figure 8.
Agitated saline bubble study assessing for a right to left intra-cardiac shunt.
PVDOMICS echo Corelab—lessons learned
The PVDOMICS multi-centre, multi-modality, and NIH-sponsored study is the largest of its kind in the field of PH. As such, the ‘lessons learned’ provide valuable insights into the processes, limitations, and challenges encountered when developing and conducting a study of this scale and scope. This manuscript seeks to expand upon these lessons as they pertain to echocardiography.
Workflow process and data transfer
The echo Corelab team consisted of an Echo Corelab PI, Lead Imaging Specialist and five research imaging specialists. Echo studies were transmitted from the six sites to the Corelab via AG MedNet, a web-based diagnostic imaging network enabling sites to send diagnostic images, and study forms electronically and securely. AG MedNet and the echo Corelab provided tools and training to study sites regarding de-identification of exams and data transmission.
Echo database
The customized echo database was developed by the Echo Corelab in conjunction with Syngo Dynamics (Siemens Healthcare) and included 119 data fields pre-specified by the PVDOMICS Echo Core Working Group. De-identified data was stored according to study subject number on a secure server. Data was periodically transferred to the PVDOMICS data coordinating centre for analysis and sharing with the PVDOMICS study group according to a data transfer agreement.
Echo adjudication
Within the Corelab, each uploaded study underwent preliminary analysis by two Corelab research specialists, who made all measurements de novo using standardized ASE referenced techniques. A third read was then performed by the Echo Corelab PI, who reviewed all images, and verified all measurements. The Echo Corelab PI also provided a qualitative assessment of RV size and function based upon cumulative assessment of data parameters and visual assessment.
Quality control and feasibility
All sites underwent initial training certification regarding standardized views, techniques, and protocol expectations. Ongoing site training was also continued throughout the study. All uploaded echocardiograms also underwent a process of quality critique by the echo Corelab. Each study was monitored for adherence to study protocol and technical quality. Image quality was also graded for each study as excellent, good, most parameters measurable, or few parameters measurable. Majority of studies (66%) were graded as having ‘most parameters measureable’ according to the database of pre-defined fields. Only 6% of studies had ‘few parameters measureable’, rendering them largely non-diagnostic for acquisition of database parameters. Within studies, individual parameters were also ranked as ‘not done’ if required image views were not obtained, or ‘not measurable’ if technical factors (including suboptimal image quality) precluded accurate analysis by the echo Corelab. Examples of ‘not done’ were if an agitated saline contrast study was not performed, or ‘not measurable’ if peak TR velocity could not be determined due to an incomplete TR spectral Doppler envelope. Overall, the echo protocol was followed completely in 82% of all studies across all sites. Of these, 95% had acquisition of all required imaging planes, from which 88% had views technically adequate to make designated measurements of RV structure. Data completeness and overall study quality grading are presented in Table 6. Feasibility of measurement of individual parameters is listed in Tables 1–3 and 5.
Table 6.
Completeness and quality of data
| Quality critique questions (n = 1174) | Yes (%) | No |
|---|---|---|
| Protocol followed completely | 959 (82) | 215 |
| PW Doppler TV inflow | 1018 (87) | 156 |
| RVOT measureable | 1059 (90) | 115 |
| RV measurable | 1032 (88) | 142 |
| All imaging planes acquired | 1120 (95) | 54 |
| Good ECG tracing | 1151 (98) | 23 |
| Raw/native data | 1008 (86) | 91 |
| IVC with sniff performed | 1139 (97) | 35 |
| TAPSE | 1104 (94) | 70 |
| Frame rates 60–80 fps | 981 (83) | 185 |
| PA properly imaged | 1084 (92) | 90 |
| RA measurable | 1032 (88) | 132 |
| Image quality, excellent | 56 (5) | –– |
| Image quality, good | 249 (21) | –– |
| Image quality, most | 799 (66) | –– |
| Image quality, few | 69 (6) | –– |
Feedback
Feedback was felt to be essential to the ongoing process of quality control. The Corelab provided an individualized quality critique to the study site and DCC for each submitted study. Cumulative data regarding these parameters were recorded separately for each site and the whole study population, which was then presented biannually at the PVDOMICS Steering Committee meeting. The process of ongoing feedback aimed to enhance echo protocol compliance and improve image quality, so that accuracy and reproducibility of Corelab measurements could be optimized.
Query notification
If any issues were identified throughout the echo workflow and quality control process, the Echo Corelab worked with the site study coordinator, and study sponsor to ensure resolution. Issues encompassed problems associated with data transfer or uploading in raw format, image de-identification, and technical factors with image acquisition.
PVDOMICS echo Corelab observations—limitations and practical pearls for assessment of the right heart
Echo measures of RV free wall longitudinal motion may overestimate RV function, so to account for radial or regional dysfunction, a qualitative experienced reader assessment of global RV function (and size) was included for each study. Future analysis with evaluate the performance of this qualitative method for discrimination of RV dysfunction, against MRI and invasive data. Qualitative assessment of right heart function can also be problematic if based upon just one image view or parameter. Typically this involves an overestimation of function, with under appreciation of radial or regional dysfunction. This is especially problematic for assessment of RVOT contractility, as this region is not visualized on standard apical views. As such, all qualitative observations in PVDOMICS were made based on reproducible findings across multiple views. Performance of longitudinal and global echo measures of RV function against CMR and invasive measures will be reported separately.
The most common problem when performing RV measurements was an inability to confidently visualize the RV or RVOT free wall due to suboptimal acoustic windows, with reduced image quality, and poor RV endocardial definition. This was particularly problematic for measurement of RV size (basal dimension) and RV area for calculation of FAC, along with RVOT diameter (feasibility 54%). Poor endocardial definition with suboptimal tissue tracking was problematic for assessment of RV 3D volumes (feasibility 19%).
Strain imaging
Strain imaging of the RV can be technically difficult to perform, due to poor visualization of the thin RV free wall. While the PVDOMICS echo Corelab used a vendor-neutral strain analysis package to facilitate comparison of strain between studies acquired on different echo platforms, this could not compensate for suboptimal baseline images. Poor acoustic windows were particularly problematic in those with WSPH Group 3 PH (those with lung disease), likely related to hyper-expanded lung volumes. To optimize tissue tracking of the RV free wall, the PVDOMICs echo protocol advocated for acquisition of a narrow sector, high frame rate, and RV-focused apical four-chamber view as described above. Acquisition of this dedicated view significantly improved visualization of the RV free wall, compared to a standard four-chamber view. This improved myocardial tissue tracking for strain analysis (feasibility 3-segment 69% and 6-segment 68%), along with a greater ability to measure more simple parameters, such as RV basal dimension (feasibility 91%) and FAC (feasibility 84%). Inclusion of this dedicated RV view should be considered in all patients with RV dysfunction or history of PH, but especially in those with suboptimal acoustic windows. Although an UEA may improve endocardial definition for RV measurements, enhanced images are not suitable for strain analysis. Determination of RV strain may also be limited in PH by dys-synchrony related to abnormal interventricular septal motion.
Assessment of both LV and RV diastolic function using current guideline-based recommendations was found to be inherently problematic for the PH population. Echo measures of diastolic function can be altered by multiple factors including: variation in preload, severe tricuspid regurgitation, beat to beat variability of heart rate (significant ectopy/atrial fibrillation), and the presence of septal defects. In these settings, the PVDOMICS Corelab deemed RV diastolic function ‘not measureable’. Abnormal septal motion in many patients, resulted in reduced diastolic septal E’, and increased E/E’ ratio, while lateral measures remained preserved. Similarly, the inclusion of RVSP as criteria for classification of diastolic dysfunction is problematic for those with PH, but no left-sided cardiac disease (non-group 2 PH). Echo assessment of diastolic function in these patients is likely flawed and hence the rate of ‘not measureable’ was increased in this context. Comparison between invasive and non-invasive parameters of diastolic function in PVDOMICs will hopefully address this uncertainty regarding grading of diastolic function in PH.
Reproducibility
As previously acknowledged, there is no single measure for accurate quantification of RV size or function and hence multiple parameters are used. However, utility of parameters is dependent on both accuracy and reproducibility, so determination of inter-observer variability is critical. This study provided a novel opportunity to determine reproducibility for right heart echo measurements in a large cohort of subjects with a spectrum of right heart dysfunction and PH. Comparison of reproducibility could then be used to determine which parameters are the most reliable. This may influence priority given to the various parameters in a busy clinical echo lab, where it may not be possible to use all techniques due to time or technology constraints.
Reproducibility for this study was determined from 10% of study subjects (n = 120). This second round of reproducibility analysis was performed on previously verified studies by different echo Corelab imaging specialists. Original exams were copied and renamed with inter-observer IDs to maintain blinding. The frames used to make the original measurements were identified and repeat measures were performed. The concordance correlation coefficient (CCC) was estimated using a variance components approach. The variance components estimates were obtained from a linear mixed model estimated by restricted maximum likelihood. The standard error of CCC was computed using a Taylor’s series expansion of first order (delta method). Confidence interval was built by applying the Fisher’s Z-transformation. The variance components were used to estimate these CCCs for the Echo data (Table 7). Related Bland–Altman Plots were generated by paired plot BA function in R (Supplementary data online, Figures S1–S11).
Table 7.
Concordance correlation coefficients
| Measurement | CCC | 95% CI | SE |
|---|---|---|---|
| LA volume | 0.845 | 0.788–0.887 | 0.025 |
| LVEF | 0.680 | 0.566–0.769 | 0.052 |
| RA, major | 0.818 | 0.748–0.870 | 0.031 |
| RA, minor | 0.869 | 0.818–0.907 | 0.022 |
| RV FAC | 0.855 | 0.798–0.897 | 0.025 |
| RV dimension | 0.939 | 0.914–0.957 | 0.011 |
| TAPSE | 0.844 | 0.779–0.892 | 0.028 |
| RA pressure | 0.718 | 0.617–0.795 | 0.045 |
| RVSP | 0.980 | 0.971–0.986 | 0.004 |
| TV S’ | 0.947 | 0.923–0.962 | 0.010 |
| RV strain | 0.781 | 0.696–0.844 | 0.037 |
Overall, reproducibility of echo parameters was high, with RVSP being the most reproducible (CCC 0.980), and biplane LVEF the least (CCC 0.680), perhaps reflecting the increased potential for discrepancy of measurement when including more than one measurement into the calculation of a single parameter. Similarly, the simple single step measures of RV function including TAPSE (CCC 0.844) and RV S’ (CCC 0.947) outperformed the more technically challenging measure of RV strain (CCC 0.781). Although reproducibility results may be magnified by the experience of the Echo Corelab, they are reassuringly robust. Based on these results, clinical echo labs with less experience in dedicated assessment of the right heart would still be expected to maintain reasonable reproducibility, especially for the simpler techniques assessing RV free wall longitudinal function, such as TAPSE or RV S’.
Assessment of the RV requires dedicated evaluation, experience, and the use of multiple echo parameters. Optimal image acquisition is key to ensure adequate views of the RV for performance of parameters like FAC and strain, which rely on adequate endocardial definition and tissue tracking, respectively. As illustrated by 82% adherence to the study protocol, technical challenges with performance of multiple study parameters, along with other practical constraints, such as time and resource allocation may impact upon adherence to a right heart focused echo workflow. Future data from the PVDOMICs study will seek to determine performance of specific echo variables, in comparison to CMR and invasive data across the spectrum of diseases associated with PH, pulmonary vascular remodelling, and RV dysfunction. This will enable better targeted echo protocols for evaluation of the right heart using the highest yield variables.
Conclusion
Echocardiographic assessment is critical in the setting of PH. While there are multiple parameters available, no single one is adequate for echo phenotyping of these often complex patients. The echo methodology of the PVDOMICS study seeks to streamline comprehensive evaluation of the right heart/pulmonary artery unit, in an accurate, dedicated, reproducible, and practical way. The lessons learned and practical pearls from this protocol will serve as a guide for researchers and clinicians alike, as we seek to improve contemporary best practice for image acquisition, and analysis using echocardiography across the spectrum of diseases manifesting with PH.
Supplementary Material
Contributor Information
Christine L Jellis, Department of Cardiovascular Medicine, Heart, Vascular and Thoracic Institute, Cleveland Clinic, 9500 Euclid Avenue, Cleveland, OH 44195, USA.
Margaret M Park, Department of Cardiovascular Medicine, Heart, Vascular and Thoracic Institute, Cleveland Clinic, 9500 Euclid Avenue, Cleveland, OH 44195, USA.
Aiden Abidov, Wayne State University, 4646 John R Street, Detroit, MI 48201, USA.
Barry A Borlaug, Department of Cardiovascular Medicine, Mayo Clinic, 200 First Street SW, Rochester, MN 55902, USA.
Evan L Brittain, Vanderbilt University Medical Center and Vanderbilt Translational and Clinical Cardiovascular Research Center, 2525 West End Avenue, Suite 300A, Nashville, TN 37203, USA.
Robert Frantz, Department of Cardiovascular Medicine, Mayo Clinic, 200 First Street SW, Rochester, MN 55902, USA.
Paul M Hassoun, Department of Medicine, Division of Pulmonary and Critical Care Medicine, Johns Hopkins University, 1830 E. Monument St, Room 540, Baltimore, MD 21205, USA.
Evelyn M Horn, Weill Cornell Medicine, Division of Cardiology, 520 East 70th Street, Starr 443, New York, NY 10021, USA.
Wael A Jaber, Department of Cardiovascular Medicine, Heart, Vascular and Thoracic Institute, Cleveland Clinic, 9500 Euclid Avenue, Cleveland, OH 44195, USA.
Kim Jiwon, Weill Cornell Medicine, Division of Cardiology, 520 East 70th Street, Starr 443, New York, NY 10021, USA.
Maria G Karas, Weill Cornell Medicine, Division of Cardiology, 520 East 70th Street, Starr 443, New York, NY 10021, USA.
Deborah Kwon, Department of Cardiovascular Medicine, Heart, Vascular and Thoracic Institute, Cleveland Clinic, 9500 Euclid Avenue, Cleveland, OH 44195, USA.
Jane A Leopold, Division of Cardiovascular Medicine, Brigham and Women’s Hospital and Department of Cardiology, VA Boston Healthcare system, 77 Ave Louis Pasteur, NRB 0630-N, Boston MA 02115, USA.
Bradley Maron, Division of Cardiovascular Medicine, Brigham and Women’s Hospital and Department of Cardiology, VA Boston Healthcare system, 77 Ave Louis Pasteur, NRB 0630-N, Boston MA 02115, USA.
Stephen C Mathai, Department of Medicine, Division of Pulmonary and Critical Care Medicine, Johns Hopkins University, 1830 E. Monument St, Room 540, Baltimore, MD 21205, USA.
Reena Mehra, Department of Pulmonary Medicine, Respiratory Institute, Cleveland Clinic, 9500 Euclid Avenue Cleveland, OH 44195, USA.
Franz Rischard, Department of Medicine, University of Arizona, 1501 N Campbell Ave, Tucson, AZ 85724.
Erika B Rosenzweig, Division of Pediatric Cardiology, Department of Pediatrics and Medicine, Columbia University Medical Center-New York Presbyterian Hospital, 3959 Broadway, New York, NY 10032, USA.
W H Wilson Tang, Department of Cardiovascular Medicine, Heart, Vascular and Thoracic Institute, Cleveland Clinic, 9500 Euclid Avenue, Cleveland, OH 44195, USA.
Rebecca Vanderpool, Department of Medicine, University of Arizona, 1501 N Campbell Ave, Tucson, AZ 85724.
James D Thomas, Bluhm Cardiovascular Institute, Northwestern University, 676 N Saint Clair, Chicago Illinois 60611, USA.
Supplementary data
Supplementary data are available at European Heart Journal–Cardiovascular Imaging online.
Data availability
At the completion of the PVDOMICS study, the data will be archived at the NHLBI Biologic Specimen and Data Repository Information Coordinating Center (BioLINCC) and thereby be available to investigators. See https://biolincc.nhlbi.nih.gov/home/
Funding
The study received grants from the National Heart, Lung and Blood Institute: U01 HL125218, U01 HL125205, U01 HL125212, U01 HL125208, U01 HL125175, U01 HL125215, and U01 HL125177, and funding from the Pulmonary Hypertension Association.
Conflict of interest: none declared.
References
- 1. Simonneau G, Gatzoulis MA, Adatia I, Celermajer D, Denton C, Ghofrani Aet al. Updated clinical classification of pulmonary hypertension. J Am Coll Cardiol 2013;62:D34–41. [DOI] [PubMed] [Google Scholar]
- 2. Tang WHW, Wilcox JD, Jacob MS, Rosenzweig EB, Borlaug BA, Frantz RPet al. Comprehensive diagnostic evaluation of cardiovascular physiology in patients with pulmonary vascular disease: insights from the PVDOMICS program. Circ Heart Fail 2020;13:e006363. [DOI] [PMC free article] [PubMed] [Google Scholar]
- 3. Hemnes AR, Beck GJ, Newman JH, Abidov A, Aldred MA, Barnard Jet al. ; PVDOMICS Study Group . PVDOMICS: a multi-center study to improve understanding of pulmonary vascular disease through phenomics. Circ Res 2017;121:1136–9. [DOI] [PMC free article] [PubMed] [Google Scholar]
- 4. Newman JH, Rich S, Abman SH, Alexander JH, Barnard J, Beck GJet al. Enhancing insights into pulmonary vascular disease through a precision medicine approach. A joint NHLBI-cardiovascular medical research and education fund workshop report. Am J Respir Crit Care Med 2017;195:1661–70. [DOI] [PMC free article] [PubMed] [Google Scholar]
- 5. Porter TR, Abdelmoneim S, Belcik JT, McCulloch ML, Mulvagh SL, Olson JJet al. Guidelines for the cardiac sonographer in the performance of contrast echocardiography: a focused update from the American Society of Echocardiography. J Am Soc Echocardiogr 2014;27:797–810. [DOI] [PubMed] [Google Scholar]
- 6. Haddad F, Doyle R, Murphy DJ, Hunt SA.. Right ventricular function in cardiovascular disease, part II: pathophysiology, clinical importance, and management of right ventricular failure. Circulation 2008;117:1717–31. [DOI] [PubMed] [Google Scholar]
- 7. Haddad F, Hunt SA, Rosenthal DN, Murphy DJ.. Right ventricular function in cardiovascular disease, part I: anatomy, physiology, aging, and functional assessment of the right ventricle. Circulation 2008;117:1436–48. [DOI] [PubMed] [Google Scholar]
- 8. Lorenz CH, Walker ES, Morgan VL, Klein SS, Graham TP Jr.. Normal human right and left ventricular mass, systolic function, and gender differences by cine magnetic resonance imaging. J Cardiovasc Magn Reson 1999;1:7–21. [DOI] [PubMed] [Google Scholar]
- 9. Mitchell C, Rahko PS, Blauwet LA, Canaday B, Finstuen JA, Foster MCet al. Guidelines for performing a comprehensive transthoracic echocardiographic examination in adults: recommendations from the American Society of Echocardiography. J Am Soc Echocardiogr 2019;32:1–64. [DOI] [PubMed] [Google Scholar]
- 10. Rudski LG, Lai WW, Afilalo J, Hua L, Handschumacher MD, Chandrasekaran Ket al. Guidelines for the echocardiographic assessment of the right heart in adults: a report from the American Society of Echocardiography endorsed by the European Association of Echocardiography, a registered branch of the European Society of Cardiology, and the Canadian Society of Echocardiography. J Am Soc Echocardiogr 2010;23:685–713; quiz 86–8. [DOI] [PubMed] [Google Scholar]
- 11. Wang TKM, Jellis C.. The role of multimodality imaging in right ventricular failure. Cardiol Clin 2020;38:203–17. [DOI] [PubMed] [Google Scholar]
- 12. Lang RM, Badano LP, Mor-Avi V, Afilalo J, Armstrong A, Ernande Let al. Recommendations for cardiac chamber quantification by echocardiography in adults: an update from the American Society of Echocardiography and the European Association of Cardiovascular Imaging. J Am Soc Echocardiogr 2015;28:1–39.e14. [DOI] [PubMed] [Google Scholar]
- 13. Giusca S, Dambrauskaite V, Scheurwegs C, D’Hooge J, Claus P, Herbots Let al. Deformation imaging describes right ventricular function better than longitudinal displacement of the tricuspid ring. Heart 2010;96:281–8. [DOI] [PubMed] [Google Scholar]
- 14. Hammarstrom E, Wranne B, Pinto FJ, Puryear J, Popp RL.. Tricuspid annular motion. J Am Soc Echocardiogr 1991;4:131–9. [DOI] [PubMed] [Google Scholar]
- 15. Kjaergaard J, Petersen CL, Kjaer A, Schaadt BK, Oh JK, Hassager C.. Evaluation of right ventricular volume and function by 2D and 3D echocardiography compared to MRI. Eur J Echocardiogr 2006;7:430–8. [DOI] [PubMed] [Google Scholar]
- 16. Nesser HJ, Tkalec W, Patel AR, Masani ND, Niel J, Markt Bet al. Quantitation of right ventricular volumes and ejection fraction by three-dimensional echocardiography in patients: comparison with magnetic resonance imaging and radionuclide ventriculography. Echocardiography 2006;23:666–80. [DOI] [PubMed] [Google Scholar]
- 17. Shimada YJ, Shiota M, Siegel RJ, Shiota T.. Accuracy of right ventricular volumes and function determined by three-dimensional echocardiography in comparison with magnetic resonance imaging: a meta-analysis study. J Am Soc Echocardiogr 2010;23:943–53. [DOI] [PubMed] [Google Scholar]
- 18. Lang RM, Badano LP, Tsang W, Adams DH, Agricola E, Buck Tet al. ; European Association of Echocardiography . EAE/ASE recommendations for image acquisition and display using three-dimensional echocardiography. J Am Soc Echocardiogr 2012;25:3–46. [DOI] [PubMed] [Google Scholar]
- 19. Leibundgut G, Rohner A, Grize L, Bernheim A, Kessel-Schaefer A, Bremerich Jet al. Dynamic assessment of right ventricular volumes and function by real-time three-dimensional echocardiography: a comparison study with magnetic resonance imaging in 100 adult patients. J Am Soc Echocardiogr 2010;23:116–26. [DOI] [PubMed] [Google Scholar]
- 20. Tei C, Dujardin KS, Hodge DO, Bailey KR, McGoon MD, Tajik AJet al. Doppler echocardiographic index for assessment of global right ventricular function. J Am Soc Echocardiogr 1996;9:838–47. [DOI] [PubMed] [Google Scholar]
- 21. Stein PD, Sabbah HN, Anbe DT, Marzilli M.. Performance of the failing and nonfailing right ventricle of patients with pulmonary hypertension. Am J Cardiol 1979;44:1050–5. [DOI] [PubMed] [Google Scholar]
- 22. Sade LE, Gulmez O, Eroglu S, Sezgin A, Muderrisoglu H.. Noninvasive estimation of right ventricular filling pressure by ratio of early tricuspid inflow to annular diastolic velocity in patients with and without recent cardiac surgery. J Am Soc Echocardiogr 2007;20:982–8. [DOI] [PubMed] [Google Scholar]
- 23. Yock PG, Popp RL.. Noninvasive estimation of right ventricular systolic pressure by Doppler ultrasound in patients with tricuspid regurgitation. Circulation 1984;70:657–62. [DOI] [PubMed] [Google Scholar]
- 24. Tahara M, Tanaka H, Nakao S, Yoshimura H, Sakurai S, Tei Cet al. Hemodynamic determinants of pulmonary valve motion during systole in experimental pulmonary hypertension. Circulation 1981;64:1249–55. [DOI] [PubMed] [Google Scholar]
- 25. Abbas AE, Fortuin FD, Schiller NB, Appleton CP, Moreno CA, Lester SJ.. A simple method for noninvasive estimation of pulmonary vascular resistance. J Am Coll Cardiol 2003;41:1021–7. [DOI] [PubMed] [Google Scholar]
- 26. Silvestry FE, Cohen MS, Armsby LB, Burkule NJ, Fleishman CE, Hijazi ZMet al. ; Society for Cardiac Angiography and Interventions . Guidelines for the echocardiographic assessment of atrial septal defect and patent foramen ovale: from the American Society of Echocardiography and Society for Cardiac Angiography and Interventions. J Am Soc Echocardiogr 2015;28:910–58. [DOI] [PubMed] [Google Scholar]
- 27. Velthuis S, Buscarini E, Gossage JR, Snijder RJ, Mager JJ, Post MC.. Clinical implications of pulmonary shunting on saline contrast echocardiography. J Am Soc Echocardiogr 2015;28:255–63. [DOI] [PubMed] [Google Scholar]
Associated Data
This section collects any data citations, data availability statements, or supplementary materials included in this article.
Supplementary Materials
Data Availability Statement
At the completion of the PVDOMICS study, the data will be archived at the NHLBI Biologic Specimen and Data Repository Information Coordinating Center (BioLINCC) and thereby be available to investigators. See https://biolincc.nhlbi.nih.gov/home/


