

Abstract
Solid-contact ion-selective electrodes (ISEs) have the inherent advantage of being miniaturized in addition to maintaining high selectivity and sensitivity of the ionophore-based ISE. The major disadvantage of ISEs is the necessity of performing a calibration curve (varying the intercept in the linear calibration curve equation) each time before running experiments, which limits their application as one-time disposable sensors or for use in remote water sample analysis. To overcome these challenges, we designed a unique back contact made of 3,4-ethylenedioxythiophene (EDOT) and 4-(2,3-dihydrothieno[3,4-b][1,4]dioxin-2-ylmethoxy)-1-butanesulfonic acid, sodium salt (EDOT-S). The calibration-free ISEs showed near Nernstian responses of 57.2 ± 0.2 mV/log [K+] and 28.5 ± 0.3 mV/log [Ca2+], while maintaining their respective selectivity against major interfering ions. The detection limits for Ca2+ and K+ ISEs were 0.45 ± 0.01 and 1.68 ± 0.18 μM, respectively. The charging cycles of the PEDOT: PEDOT-S back contact allowed us to fix the background potential at a desired fixed intercept value across different ionophores (K+, Ca2+). This protocol was used to determine the K+ and Ca2+ contents in creek water samples. The activity and concentration of [Ca2+] and [K+] in a local creek was found to be 257 ± 7.3 and 28.1 ± 1.1 μM, respectively.
Graphical Abstract

INTRODUCTION
Solid-contact ion-selective electrodes (SC-ISEs) are a widely used method of determining ion activity in environmental and clinical measurements.1–3 In SC-ISEs, the ion-selective membrane (ISM) is traditionally a plasticized poly(vinyl chloride) (PVC) membrane containing the ligand and ion exchanger applied over an ion-to-electron transducer back contact. The most common ion-to-electron transducer materials are electrochemically deposited organic semiconducting polymers, self-assembling monolayers, or high surface area carbon materials.1,4–16 The interface between the ISM and the solid contact layer has a poorly defined potential, requiring complex maintenance with the ISE calibrated before each test to determine the new intercept value from the linear calibration curve. The formation of a thin water layer between the ISM and solid contact over the lifetime of the sensor is partially responsible for the ill-defined interface and drift in the linear intercept. To prevent the formation of a water layer, recent improvements to the SC-ISE design focus on increasing the hydrophobicity of ISMs by using a plasticized Teflon membrane, fluorinated ionophores, and hydrophobic conducting polymers [i.e., poly(2-n-tetradecyl-2,3-dihydrothieno-[3,4-b][1,4]dioxine) (PEDOT-C14)].17 Increasing the hydrophobicity improves the stability of the sensor but is not sufficient to fix the interface potential.
A true calibration-free ISE needs to have overlapped calibration curves for each calibration. To be considered a calibration-free ISE, it must have a known and stable intercept along with a reproducible Nernstian response. One type of calibration-free approach has been the addition of Co(II)/Co(III) complexes of 4,4′-dinonyl-2,2′-bipyridyl redox buffer, which, in an equal molar ratio to a self-assembled monolayer of 1-hexanethiol on Au, fixes the calibration intercept value based on the ratio of Co(II)/Co(III). The Co(II)/Co(III) redox buffer fixes the intercept value for multiple electrodes for a short time. The calibration-free conditions of this type of sensor are limited by the leaching of Co(II)/Co(III) from the back contact and contamination of the sample solution.18 Electrochemical fabrication of poly(3,4-ethylenedioxythiophene) (PEDOT) polymer films doped with alkoxy sulfonate derivatives of 3,4-ethylenedioxythiophene (EDOT) have previously been reported.19,20 Another promising approach to controlling and fixing the intercept value is the application of a pA to nA current to fix a PEDOT:poly(styrene sulfonic acid) (PEDOT:PSS) semi-conductor solid contact to a known calibration intercept value.21 For regular PEDOT:PSS back contact ISEs, there is no fixed working equation with fixed intercept values. However, the calibration-free ISEs with PEDOT:PSS polymer solid contact layers are reported where the PEDOT had been oxidized or reduced by an applied current from multiple sources, including the leakage current from a traditional Ag/AgCl reference electrode while conditioning the ISE in an electrolyte solution.22
The major challenge in fabricating a calibration-free ISE is in stabilizing the potential at the interface between the ISM and back contact. Formation of a water layer and irreproducibility of electrode-to-electrode potentials require the ISE to be characterized before every experiment due to the drift in the intercept of the linear calibration curve. A true calibration-free ISE needs to have the same calibration intercept value, sensitivity, selectivity, and stability over multiple uses or calibrations.23
Here, we describe a poly(3,4-ethylenedioxythiophene):poly-[4-(2,3-dihydrothieno[3,4-b][1,4]dioxin-2-yl-methoxy)-1-butanesulfonic acid] (PEDOT:PEDOT-S)-based copolymer solid contact electrochemically prepared from a ratio of EDOT and negatively charged 4-(2,3-dihydrothieno[3,4-b][1,4]dioxin-2-yl-methoxy)-1-butanesulfonic acid, sodium salt (EDOT-S) without any supporting electrolyte to improve the stability of the calibration intercept and charging time.
MATERIALS AND METHODS
Materials.
Two-millimeter gold disk electrodes were purchased from CH instruments. Calcium ionophore II (ETH 129) was purchased from Sigma-Aldrich. Valinomycin was purchased from FLUKA. EDOT, 2-nitrophenyl octyl ether (o-NPOE), and poly(styrene sulfonic acid) sodium salt were purchased from Alfa Aesar. 3,4-Dimethoxythiophene was purchased from Matrix Scientific. Potassium tetrakis-(4-chlorophenyl) borate, sodium hydride, lithium acetate, p-toluenesulfonic acid monohydrate, and 1,4-butane sultone were purchased from TCI. Hydroxymethyl EDOT (EDOT-CH2OH) and high-molecular-weight PVC were purchased from Aldrich. Lithium tetrakis(pentafluorophenyl)borate ethyl etherate purchased from Fisher Scientific. Tetrahydrofuran (THF) was purchased from EDM Millipore. All solutions were prepared by using 18.2 MΩ deionized water.
Synthesis of EDOT-S.
The EDOT-S was synthesized by a previously published procedure by Stéphan et al.20 Sodium hydride (NaH) (200 mg, 5.0 mmol, 60% in mineral oil) was added to a stirred solution of EDOT-CH2OH (500 mg, 2.90 mmol) in dry toluene (10 mL) at room temperature under a N2 atmosphere. The solution was then purged with N2 gas for about 10 min, refluxed for 20 min, and cooled to room temperature. The reaction mixture was again purged with N2 gas for about 10 min and 1,4-butane sultone (400 mg, 0.30 mL, 2.93 mmol) was added. After purging with N2 gas for 2 min, the reaction mixture was slowly heated to reflux over a period of 30 min. After 3 h of reflux, the reaction mixture was cooled back to room temperature. Dry acetone (30 mL) was then added under vigorous stirring (Figure S1). The resulting solid precipitate was filtered and washed with acetone (3 × 10 mL) under a flow of N2 gas. The resulting solid was dried in a high vacuum for 36 h to give the desired product (700 mg, 2.12 mmol, 73% yield) as a brownish solid. 1H NMR (700 MHz, D2O): δ 6.42 (d, J = 3.5 Hz, 1H); 6.41 (d, J = 3.3 Hz, 1H); 4.38−4.32 (m, 1H); 4.19 (dd, J = 12.0, 2.1 Hz); 4.01 (dd, J = 11.7, 6.9 Hz, 1H); 3.66 (t, J = 4.2 Hz, 2H); 3.53−3.48 (m, 2H); 2.83−2.81 (m, 1H); 1.70−1.60 (m, 4H) ppm (Figure S2).
Fabrication of Solid-State ISEs.
Two-millimeter gold disk electrodes were polished and washed with deionized (DI) water before each experiment. The copolymer back contact was deposited by applying a constant 1.1 V versus a quasi-reference electrode (silver wire) for 500 s from a solution with an initial concentration of 9.5 mM EDOT and 0.5 mM EDOT-S (Na+) in DI water. The electrodeposited polymer was then washed with DI water and dried in air before drop casting the PVC-containing ionophore cocktail. The membrane composition of the Ca2+-ISEs was as follows: 5% (w/w) EHT129, 60% (w/w) o-NPOE, 33.5% (w/w) PVC, and 1.5% (w/w) potassium tetrakis-(4-chlorophenyl) borate. The composition of the potassium ISM was as follows: 5% (w/w) valinomycin, 60.65% (w/w) o-NPOE, 33.5% (w/w) PVC, and 0.85% (w/w) Lithium tetrakis(pentafluorophenyl)borate ethyl etherate. In each case, 50 mg of each composition was dissolved in 300 μL of THF and then 2 μL of the cocktail was drop cast on the PEDOT:PEDOT-S copolymer layer. After drying, the ISEs were conditioned overnight in a relevant matrix containing 1 mM primary analyte solution.
Potentiometric Measurements.
Potentials were measured with an electromotive force (emf) 6 potentiometer (input impedance 10 TΩ) controlled with EMF Suite 1.03 software (Lawson Labs, Malvern, PA). A double junction Ag/AgCl external reference with a 1 M KCl inner filling solution and a 1 M lithium acetate bridge electrolyte was used for all experiments. All activity coefficients were calculated according to the Debye–Hückel theory.24
Electrochemical Characterization of Solid-State ISEs.
Electrochemical Treatment of the PEDOT:PEDOT-S Back Contact.
First, the ISEs were fabricated and cured as described in the Fabrication of Solid-State ISEs section. The electrodes were then dipped in a relevant primary analyte solution. For example, the Ca2+-ISEs were dipped in a 1 mM Ca2+ solution in acetate buffer and then a constant anodic current of 10 nA and subsequently 1 nA was applied to the electrodes until the potential of 52 mV is reached. We then electrochemically treated the electrode by pulsing 1 nA cathodic/anodic currents for 30 s each for a total of 3 min to further stabilize the fixed potential at 52 mV. The potential was recorded on the Lawson Labs software to avoid any offset between the potentiostat and the emf 6 potentiometer. The Ca2+-ISEs were then dipped in calibration solution to perform calibration to determine the slope, intercept, and detection limit. We denoted mV as the fixed potential in 1 mM Ca2+ solution, which ideally should overlap with the same Ca2+ concentration in the calibration curve. For K+-ISEs, similar electrochemical treatments were performed in the presence of 1 mM K+ solution to fix a desired potential of mV. To fix desired potentials in the presence of 1 mM primary analyte solutions, we followed a similar electrochemical treatment (Table S1). The potential is fixed at 1 mM, and the charging solution needs to be selected on the basis of the matrix used for the experiment, as the offset between the potentiostat and the Lawson Labs emf 6 potentiometer can vary with matrix effects. It is worthwhile to mention that potentials such as 52 mV or −22 mV for Ca2+ and K+-ISEs have been fixed in presence of 1 mM primary ions to attain the common intercept value of 150 mV for the monovalent and divalent ions calibration curves. The range of available intercept potentials for monovalent and divalent ions calibration curves was determined based on the stability of the PEDOT:PEDOT-S back contact and ion-selective membrane.
Determination of the Selectivity Coefficient of ISEs.
Selectivity coefficients were determined by the fixed interference method. A solution with a fixed background of primary interfering ions was prepared, and the activity of the primary ion in the solution was incrementally increased from 1 nM to 100 mM. The selectivity coefficients were calculated as follows25,26
Water Layer Test.
Electrochemical impedance spectroscopy (EIS) was performed on an SP 200 Biologic potentiostat in 100 mM K+ (K+ ISEs) versus Pt wire at the open circuit potential in the frequency range of 3–10 mHz. The spectra were collected before charging and after charging (t = 0, 6, 12, 18, and 24 h).
Reversibility Test.
Calibration-free Ca2+ ISEs were dipped into a 1 mM acetate buffer pH 6.5 containing 100 μM Ca2+. The concentration of Ca2+ ions was decreased to 10 μM Ca2+ by spiking the solution with ethylenediaminetetraacetic acid. The concentration was then brought back to 100 μM Ca2+ by the addition of the Ca2+ standard.
Application of Sensors in a Complex Matrix Sample.
Calibration-free Ca2+ and K+ ISEs were prepared according to the protocol described earlier. The activity of potassium and calcium in a local creek was analyzed after an acidification pretreatment step to adjust the creek water to a pH of 6.5. The measurements were taken using an emf 6 potentiometer and a double junction Ag/AgCl external reference electrode. To measure the amount of calcium in the creek water, the Ca2+ calibration-free ISEs were emersed in a background solution of pH 6.5 [1 mM] acetate buffer with 5 μM Ca2+. 5 μM primary ions were added as the one-point calibration to confirm our readings. The potential is monitored continuously and spiked with creek water for a 1:2 dilution of creek water. The potential of the Ca2+ calibration-free ISEs was sampled t = 60–95 s after the addition of the creek water. For K+, the electrodes were dipped in a beaker containing creek water, and the potential of the K+ calibration-free ISE was sampled after t = 10 s. Calcium activity in the creek water was confirmed by using a commercial calcium colorimetric assay purchased from BioVision. Samples and standards were prepared according to the assay manufacturer’s recommendations. The assay was run on a Shimadzu UV 1800 double-beam spectrometer. The K+ ion concentration in the creek water samples was confirmed using inductively coupled plasma optical emission spectrometry (ICP-OES) (SPECTROS ARCOS). The creek water was pretreated by filtration through a 0.2 μm syringe filter prior to running ICP-OES and the potassium emission was measured at 766.491 nm.
RESULTS AND DISCUSSION
Characterization of PEDOT:PEDOT-S Copolymer as a Back Contact.
Optimization of the Deposition Parameter of the PEDOT:PEDOT-S Copolymer.
PEDOT films doped with perchlorate or polystyrene are common solid contact materials because of their robustness, ease of deposition, and emf stability. The potential of the solid contact layer is dependent on anion doping. Over time, the anions in the solid contact become hydrated due to the formation of a water layer, and they leach from the polymer backbone into the hydrated layer between the ISM and the solid contact, or through the ISM. The PEDOT:PEDOT-S copolymer was fabricated with no unbound anion from a ratio of EDOT and EDOT-S monomers (Figure 1A,B). The potential of the PEDOT:PEDOT-S polymer layer depends on the ratio of EDOT to EDOT-S and the thickness. The molar ratios of EDOT and EDOT-S were varied in the deposition solution from 50:50 to 99:1 to optimize the time and thickness of deposition. The open-circuit potential of 98:2 and 95:5 PEDOT:PEDOT-S polymers were tested against different cations, anions, and changes in ionic strength. A ratio of 95:5 of PEDOT:PEDOT-S was selected as the better solid contact for the calibration-free ISE because of the insensitivity to changes in the potential to different cations, anions, and changes in ionic strength. The 95:5 PEDOT:PEDOT-S conducting polymer electrodes showed 0 and 2 mV potential differences when switched from 1 mM of KCl solution to 1 mM NO3−-or 1 mM Br−-containing solutions respectively.
Figure 1.
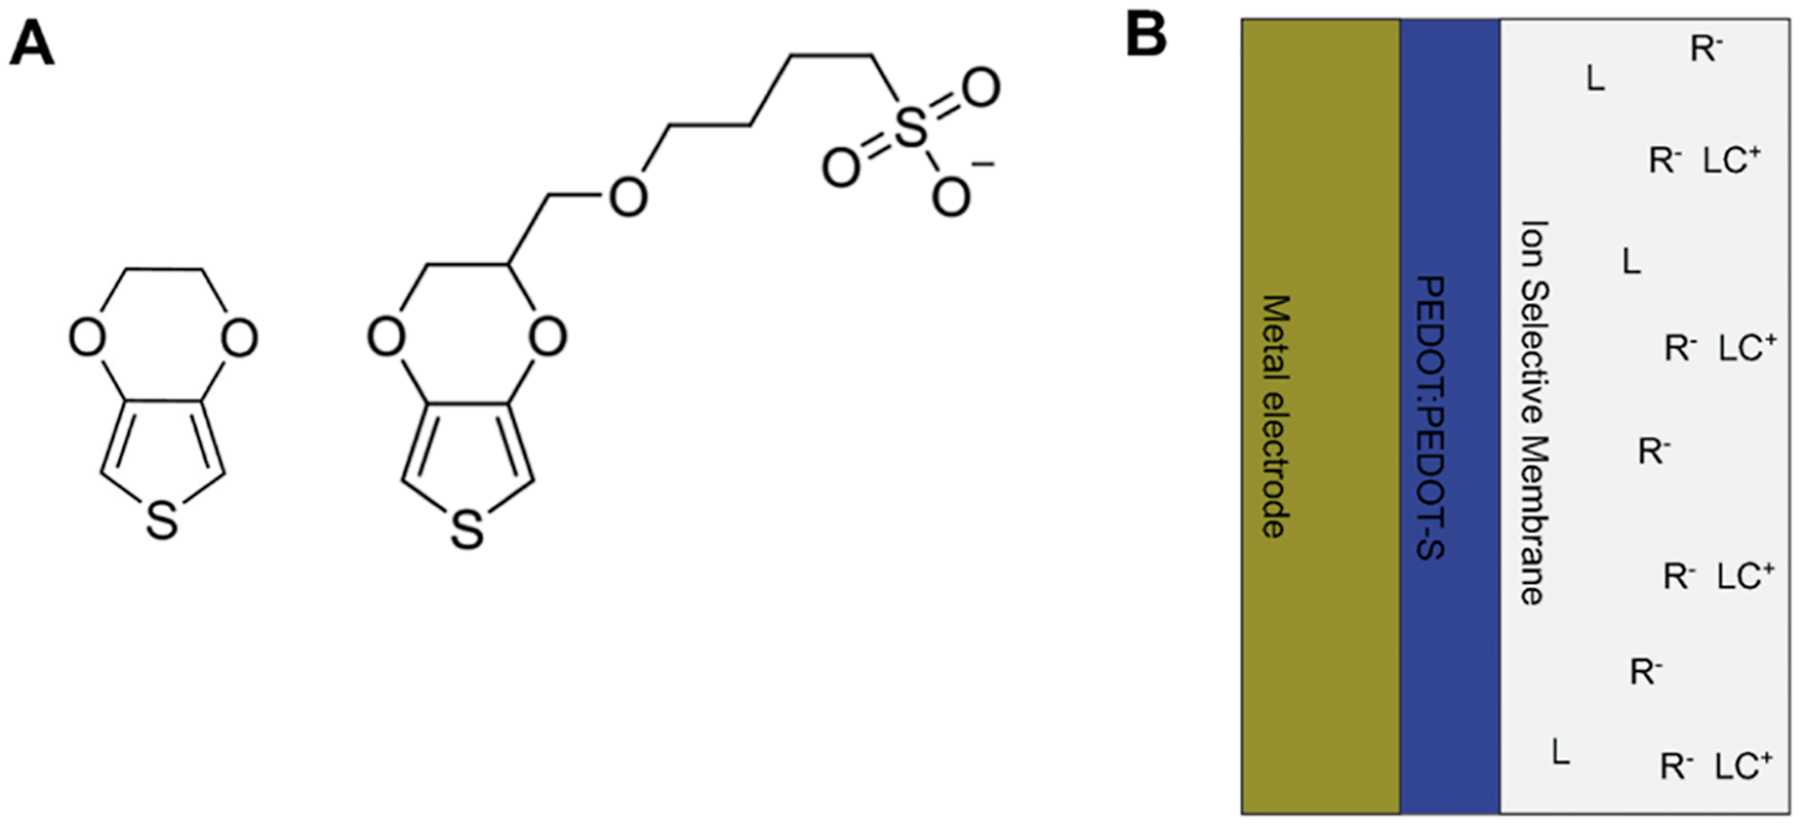
Schematic diagram of calibration-free ISE. (A) Structure of EDOT and EDOT-S, a sulfonate derivative of EDOT. (B) Schematic diagram of the calibration-free ISE with our copolymer PEDOT:PEDOT-S solid contact fabricated without any unbound anion for more stable and controlled doping.
Calibration-free Ca2+ and K+ ISEs.
The overlapping calibration curves of the newly developed calibration-free Ca2+ and K+ ISEs are shown in Figure 2A,B, respectively. The Ca2+ ISEs showed a near Nernstian slope of 28.9 ± 0.2 mV/log [Ca2+], and the K+ ISEs showed a near Nernstian slope of 57.2 ± 0.2 mV/log [K+], with excellent intercept reproducibility for the same sensor over multiple calibrations (n = 3).
Figure 2.

Calibration curves of Ca2+ and K+ ISEs. Replicate calibration curves for monovalent and divalent calibration-free ISEs. (A) Calibration curves (N = 3) for a single Ca2+ calibration-free ISE in pH 5.0 acetate buffer (0.1 M) with an adjusted calibration-free intercept of 150 mV; error bars are shown on the graph. Unified working equation: y = 28.9 ± 0.2 mV/dec(x) + 150.7 ± 0.8 mV. (B) Calibration curves (N = 3) for a single K+ calibration-free ISE; unified working equation: y = 57.2 ± 0.2 mV/dec(x) + 150.0 ± 0.4 mV. (C,D) calibration curves of Ca2+ and K+ ISEs to show the reproducibility of ISEs across different batches of electrode fabrication; error bars are shown on the graph.
The calibration-free ISEs also showed excellent response times below 500 ms (Figure S3). We demonstrated the reproducibility of producing multiple electrodes with the same intercept potential, as shown in Figure 2C,D. The detection limit for Ca2+ and K+ was recorded as 0.45 ± 0.01 and 1.68 ± 0.18 μM, respectively (Table 1). The selectivity of the calibration-free ISEs was unaffected by the application of constant current and gave excellent selectivity after electrochemical treatment versus primary interfering ions: and It is worth mentioning the K+-ISE showed a selectivity coefficient of −3.90 against Na+ when NPOE and Potassium tetrakis-(4-chlorophenyl) borate were used as the membrane composition. However, we chose not to use this composition to avoid leaching from the ISE membrane. After electrochemical treatment, the stability and reversibility of the calcium calibration-free ISEs were tested to ensure the treatment did not adversely affect the performance of the sensors. The calcium calibration-free ISE had a drift of 300 μV/h in presence of 1 mM Ca2+, which is less than the drifts reported for calcium ISEs with SWCNT contact layers (Figure S4).27 The sensors also exhibited excellent 95% reversibility when the concentration was varied from high to low (Figure S5). The sensors were also tested in the presence of 5% CO2. It is observed that the sensor’s potentials only drift by 0.9 mV, which contributes to <1% error (Figure S6). The ISE membrane was estimated to be 25 μm thick (Figure S7).
Table 1.
Calibration-free ISEs Based on the PEDOT:PEDOT-S Back Contacta
| electrode type: charged | K+ ISE | Ca2+ ISE |
| slope (mV/dec) | 57.2 ± 0.2 | 28.5 ± 0.3 |
| detection limit (μM) | 1.68 ± 0.18 | 0.45 ± 0.01 |
| −3.53 ± 0.02 vs Na+ | −3.82 ± 0.01 vs Mg2+ | |
| −4.13 ± 0.21 vs Ca2+ | −5.26 ± 0.12 vs K+ |
Characterization of a batch of three calibration-free ISEs over three replicate calibrations. The Ca2+ ISE (n = 9) and the K+ ISE (n = 9) were calibrated versus an Ag/AgCl reference electrode under optimized solution conditions.
As shown in Figure 2A,B, the working equations for Ca2+ and K+ ISEs were as follows: y = (150.7 ± 0.8) + (28.9 ± 0.2) log [Ca2+] and y = (150.0 ± 0.4) + (57.2 ± 0.2) log [K+], (n = 3) respectively. As discussed in the Materials and Methods section, we fixed one point on the calibration curve by electrochemical treatment. In our experiments, 1 mM of primary analyte was chosen to fix the potential to 52 mV for Ca2+ ISEs and −22 mV for K+ ISEs. In each case, the slope and detection limit remained reproducible and fixed; hence, the intercept also became a fixed value for Ca2+ and K+ ISEs (Figure 2). Notably, although the intercept for Ca2+ and K+ ISEs is the same, the reported background potentials are different at −33.0 ± 2.6 and −160.3 ± 5.9 mV, respectively (due to difference in slope values). In addition, the selectivity coefficients against major interfering ions after electrochemical treatment for both types of ISEs were comparable to other reported selectivity coefficients for these commercially available ionophores: , .28,29
During electrochemical treatment, the potential at the PEDOT:PEDOT-S/Au interface might have been fixed, which might indirectly fix the equilibrium potential at the membrane–solution interface.30,31 Because the exact ratio of the PEDOT:PEDOT-S conducting polymer back contact is unknown, a different amount of current might be needed to attain the desired potential of 52 mV for Ca2+ ISEs. However, it takes only 5 min for both types of ISEs to achieve equilibrium potential in the presence of a very low concentration of the analyte (see calibration curves for Ca2+ and K+ ISEs in Figures 2 and 3), even after repeated changing of solutions during repeated calibration curve experiments. One can speculate that passing a small current through the ISE might polarize the membrane, and thus it may take longer to establish such an equilibrium. That is why the ISEs were conditioned after constant-current electrochemical treatments with further second steps of pulsing (anodic and cathodic) electrochemical treatment to establish the membrane to its previous form and make it suitable for zero-current potentiometric measurements.32 Reestablishment of the zero-current condition is evident from the EIS experiments, which showed no change in impedance in the higher frequency range as a result of fixing the potential (Figure 4).
Figure 3.

Replicate calibration curves for calibration-free ISEs at multiple fixed points. (A) Calibration-free Ca2+-ISE with working equation of y = 29.9 ± 0.7(x) + 124.3 ± 1.8 in 1 mM acetate buffer at pH 6.5. (B) Calibration-free Ca2+-ISE with working equation of y = 28.6 ± 0.1 mV(x) + 185.9 ± 0.9 in 0.1 M acetate buffer at pH 5.0. (C) Calibration-free K+ ISE with working equation of y = 56.6 ± 0.6 mV/dec(x) + 127.0 ± 0.6. (D) Calibration-free K+ ISE with working equation of y = 56.5 ± 0.6 mV/dec(x) + 184.2 ± 1.4 mV.
Figure 4.

Impedance on K+ SC-ISEs with PEDOT:PEDOT-S solid contacts. EIS for K+ calibration-free ISE at open circle potential in 100 mM KCl before and after adjusting the intercept with constant current, t = 6, 12, 18, and 24 h.
We have further explored the possibilities of varying the final potential of the ISEs in the presence of 1 mM of primary analyte by electrochemical treatment. For example, 52, 29, or 89 mV potentials were fixed in the presence of 1 mM Ca2+ in three separate experiments for Ca2+ ISEs (Figures 2A,C and 3A,B). The same has been observed for K+ ISEs, where −22, −44, or 13 mV potentials have been fixed in 1 mM K+ solution (Figures 2B,D and 3C,D). In all cases, the ISEs have demonstrated calibration-free properties, though with different working equations, as the intercepts are different (Table S1). The detection limit remained the same for both Ca2+ and K+, as reported in Table 1. This electrochemical treatment showed us that it is possible to fix the intercept at the desired potential as long as the integrity of the PEDOT layer is maintained, that is, not overoxidizing or over-reducing the conducting polymer. We suspect that the bound negative charge of the PEDOT-S monomer might help stabilize the conducting polymer as a whole and, thus, maintain a constant potential in all of these cases, even in the presence of a water layer, as evident from our EIS measurements. Spectra collected at 12, 18, and 24 h after electrochemical treatment show a slight decrease in the capacitance in the higher frequency range, indicating the presence of a water layer forming between the PEDOT:PEDOT-S back contact and the ISM (Figure 4). The ability of the sensors to hold a fixed potential at 1 mM activity for 24 h is consistent with water formation occurring within 48 h of fabrication. Beyond 24 h, the sensors are still usable because the slope is still good, with a standard deviation of 0.2 mV over 6 days. However, the sensors are not calibration-free, or the working equation is not valid anymore as the conducting polymer back contact PEDOT:PEDOT-S might not be able to hold the constant potential.
Determination of Ca2+ and K+ Ions in Creek Water Samples.
Calibration-free Ca2+ and K+ ISEs were used to determine the activity and concentration of Ca2+ and K+ in creek water samples to demonstrate the application of calibration-free ISEs in a real-world solution, where there is no control of other ions and an unknown ionic strength. Ca2+ and K+ ISEs were prepared according to the protocol described in the “Materials and Methods” section. The activity of Ca2+ in a local creek measured with the calibration-free Ca2+-ISEs was found to be 256 to 264 μM (95% confidence interval, CI, t = 75 s after spike). The amount of K+ in creek water was from 27.7 to 28.4 μM (95%CI). The amount of unbound calcium in creek water was confirmed by UV–vis colorimetric assay to be 260 to 264 μM (95%CI). The assay was selected to confirm our calcium measurement over ICP-OES, so we were comparing the total unbound calcium amount between the two methods. The calibration-free ISE concentration of K+ in creek water was confirmed by ICP-OES to be ranging from 27.3 to 28.7 μM (95%CI) (Table 2).
Table 2.
Quantification of K+ and Ca2+ in Creek Water Samples by Calibration-free K+ and Ca2+ ISEsa
| K+ (μM) | Ca2+ (μM) | |||
|---|---|---|---|---|
| ICP-OES (N = 3) | ISEs (N = 3) | colorimetric assays (N = 3) | ISEs (N = 6) | |
| creek water sample | 28.0 ± 0.71 | 28.1 ± 1.05 | 262 ± 1.5 | 257 ± 7.27 |
ICP-OES and colorimetric methods also validated the corresponding K+ and Ca2+ concentrations.
CONCLUSIONS
We have developed solid-state calibration-free ISEs with a PEDOT:PEDOT-S back contact. The calibration-free ISEs showed near Nernstian responses of 57.2 ± 0.2 mV/log [K+] and 28.5 ± 0.3 mV/log [Ca2+] while maintaining their respective selectivity against major interfering ions. The unique PEDOT:PEDOT-S back contact allowed us to fix the intercept at a common value across different ionophores. The calibration-free ISEs give comparable results to those of other laboratory techniques such as ICP-OES and colorimetric UV–vis assays. Our lab’s current works are underway to improve the long-term stability of these calibration-free ISEs and expand their applicability.
Supplementary Material
ACKNOWLEDGMENTS
We greatly acknowledge the National Institute of Dental and Craniofacial Research (grant #R01DE027999) for their financial support of this research.
Footnotes
Supporting Information
The Supporting Information is available free of charge at https://pubs.acs.org/doi/10.1021/acs.analchem.2c00748.
Experimental details of the synthesis of EDOT-S, 1H NMR (700 MHz, D2O) of EDOT-S, calibration-free ISEs based on PEDOT:PEDOT-S back contact, response time of calibration-free Ca2+ ISE, long term stability of calibration-free Ca2+ ISE, reversibility of calibration-free Ca2+ ISE, CO2 water layer test, Cross section of the ISM on the PEDOT:PEDOT-S layer (PDF)
Complete contact information is available at: https://pubs.acs.org/10.1021/acs.analchem.2c00748
The authors declare no competing financial interest.
Contributor Information
Christopher Bahro, Department of Chemistry, Oregon State University, Corvallis 97330 Oregon, United States.
Subir Goswami, Department of Chemistry, Oregon State University, Corvallis 97330 Oregon, United States.
Sarah Gernhart, Department of Chemistry, Oregon State University, Corvallis 97330 Oregon, United States.
Dipankar Koley, Department of Chemistry, Oregon State University, Corvallis 97330 Oregon, United States.
REFERENCES
- (1).Bakker E; Bühlmann P; Pretsch E Chem. Rev 1997, 97, 3083–3132. [DOI] [PubMed] [Google Scholar]
- (2).Bühlmann P; Pretsch E; Bakker E Chem. Rev 1998, 98, 1593–1688. [DOI] [PubMed] [Google Scholar]
- (3).Johnson RD; Bachas LG Anal. Bioanal. Chem 2003, 376, 328–341. [DOI] [PubMed] [Google Scholar]
- (4).Lindfors T; Ivaska A Anal. Chem 2004, 76, 4387–4394. [DOI] [PubMed] [Google Scholar]
- (5).Michalska A; Dumańska J; Maksymiuk K Anal. Chem 2003, 75, 4964–4974. [Google Scholar]
- (6).Bobacka J Electroanalysis 2006, 18, 7–18. [Google Scholar]
- (7).Veder J-P; de Marco R; Clarke G; Chester R; Nelson A; Prince K; Pretsch E; Bakker E Anal. Chem 2008, 80, 6731–6740. [DOI] [PMC free article] [PubMed] [Google Scholar]
- (8).Ishige Y; Klink S; Schuhmann W Angew. Chem., Int. Ed 2016, 55, 4831–4835. [DOI] [PubMed] [Google Scholar]
- (9).Zou XU; Cheong JH; Taitt BJ; Bühlmann P Anal. Chem 2013, 85, 9350–9355. [DOI] [PubMed] [Google Scholar]
- (10).Hu J; Stein A; Bühlmann P TrAC, Trends Anal. Chem 2016, 76, 102–114. [Google Scholar]
- (11).Michalska A; Skompska M; Mieczkowski J; Zagórska M; Maksymiuk K Electroanalysis 2006, 18, 763–771. [Google Scholar]
- (12).Zhang T; Lai C-Z; Fierke MA; Stein A; Bühlmann P Anal. Chem 2012, 84, 7771–7778. [DOI] [PubMed] [Google Scholar]
- (13).Park S; Maier CS; Koley D Electrochim. Acta 2021, 390, 138855. [DOI] [PMC free article] [PubMed] [Google Scholar]
- (14).Aponso S; Ummadi JG; Davis H; Ferracane J; Koley D J. Dent. Res 2019, 98, 194–199. [DOI] [PMC free article] [PubMed] [Google Scholar]
- (15).Ummadi JG; Downs CJ; Joshi VS; Ferracane JL; Koley D Anal. Chem 2016, 88, 3218–3226. [DOI] [PMC free article] [PubMed] [Google Scholar]
- (16).Joshi VS; Sheet PS; Cullin N; Kreth J; Koley D Anal. Chem 2017, 89, 11044–11052. [DOI] [PMC free article] [PubMed] [Google Scholar]
- (17).Papp S; Bojtár M; Gyurcsányi RE; Lindfors T Anal. Chem 2019, 91, 9111–9118. [DOI] [PMC free article] [PubMed] [Google Scholar]
- (18).Zou XU; Zhen X. v.; Cheong JH; Bühlmann P Anal. Chem 2014, 86, 8687–8692. [DOI] [PubMed] [Google Scholar]
- (19).Xiao Y; Cui X; Martin DC J. Electroanal. Chem 2004, 573, 43–48. [Google Scholar]
- (20).Stéphan O; Schottland P; le Gall P-Y; Chevrot C; Mariet C; Carrier MJ Electroanal. Chem 1998, 443, 217–226. [Google Scholar]
- (21).Vanamo U; Bobacka J Electrochim. Acta 2014, 122, 316–321. [Google Scholar]
- (22).Vanamo U; Bobacka J Anal. Chem 2014, 86, 10540–10545. [DOI] [PubMed] [Google Scholar]
- (23).Rousseau CR; Bühlmann P TrAC, Trends Anal. Chem 2021, 140, 116277. [Google Scholar]
- (24).Kielland J J. Am. Chem. Soc 1937, 59, 1675. [Google Scholar]
- (25).Union I; Pure OF; Chemistry A; Division AC; On C; Chemistry E; Umezawa Y; Umezawa K; Tohda K; Amemiya S Pure Appl. Chem 1974, 37, 439–444. [Google Scholar]
- (26).Bakker E Anal. Chem 1997, 69, 1061–1069. [Google Scholar]
- (27).Hernández R; Riu J; Rius FX Analyst 2010, 135, 1979–1985. [DOI] [PubMed] [Google Scholar]
- (28).Ma Y; Rao X; Zhong S; Ren S; Yu T; Zhen Q J. Tongji Med. Univ 1992, 12, 98. [DOI] [PubMed] [Google Scholar]
- (29).Cosofret V; Erdösy M; Johnson TA; Buck RP; Ash RB; Neuman MR Anal. Chem 1995, 67, 1647. [Google Scholar]
- (30).Makarychev-Mikhailov S; Shvarev A; Bakker E Anal. Chem 2006, 78, 2744–2751. [DOI] [PubMed] [Google Scholar]
- (31).Xu Y; Ngeontae W; Pretsch E; Bakker E Anal. Chem 2008, 80, 7516–7523. [DOI] [PMC free article] [PubMed] [Google Scholar]
- (32).Zook JM; Lindner E Anal. Chem 2009, 81, 5146–5154. [DOI] [PMC free article] [PubMed] [Google Scholar]
Associated Data
This section collects any data citations, data availability statements, or supplementary materials included in this article.