

Abstract
Many diffusion magnetic resonance imaging (dMRI) studies document associations between reading skills and fractional anisotropy (FA) within brain white matter, suggesting that efficient transfer of information across the brain contributes to individual differences in reading. Use of complementary imaging methods can determine if these associations relate to myelin content of white matter tracts. Compared to children born at term (FT), children born preterm (PT) are at risk for reading deficits. We used two MRI methods to calculate associations of reading and white matter properties in FT and PT children. Participants (N=79: 36 FT and 43 PT) were administered the Gray’s Oral Reading Test at age 8. We segmented three dorsal (left arcuate and bilateral superior longitudinal fasciculus) and four ventral (bilateral inferior longitudinal fasciculus and bilateral uncinate) tracts and quantified (1) FA from dMRI and (2) R1 from quantitative T1 relaxometry. We examined correlations between reading scores and these metrics along the trajectories of the tracts. Reading positively correlated with FA in segments of left arcuate and bilateral superior longitudinal fasciculi in FT children; no FA associations were found in PT children. Reading positively correlated with R1 in segments of the left superior longitudinal, right uncinate, and left inferior longitudinal fasciculi in PT children; no R1 associations were found in FT children. Birth group significantly moderated the associations of reading and white matter metrics. Myelin content of white matter may contribute to individual differences in PT but not FT children.
Keywords: reading, fractional anisotropy, myelination, relaxometry, children, preterm
1. Introduction
Children typically begin learning to read at approximately age 6 years and begin reading to learn by approximately age 9 years. Reading abilities vary widely across the population (Berninger, 1986); distinctive subpopulations, such as children born preterm (PT), tend to perform below other normative groups, such as children born at term (FT)(Aarnoudse-Moens et al., 2009; Kovachy et al., 2015). Children who are poor readers in the early primary grades rarely catch up with good readers (Ozernov-Palchik et al., 2017). and ultimately experience lower academic and occupational attainment and reduced physical and mental health (Arnold et al., 2005; Snowling et al., 2007). Understanding the neurobiology of individual differences in reading during childhood may suggest strategies for early detection and effective remediation of children with reading difficulties. Since a landmark study in children in 2005 (Deutsch et al., 2005), many studies have found that individual differences in reading during childhood correlate with microstructural features of white matter circuitry in the brain, assessed using advanced magnetic resonance imaging (MRI) methods. Taken together, these studies strongly suggest that individual differences in reading skill relate to the efficiency of information transfer across the brain. Most of these association studies use a single imaging modality to obtain the relevant white matter metric. In this present study, we present the results of a multi-modal MRI imaging study, designed to assess associations of individual differences in reading with two distinctive measures of white matter microstructure. The sample included FT and PT children across a range of reading abilities because of potential variation in the neurobiology of reading in the two subgroups (Bruckert et al., 2019; Dodson et al., 2018; Travis et al., 2016)
A large body of literature has used diffusion MRI (dMRI) to investigate associations between individual differences in reading abilities in children and microstructural characteristics of white matter pathways in the brain (Beaulieu et al., 2005; Meisler & Gabrieli, 2022; Vandermosten, Boets, Wouters, et al., 2012a; Wandell & Yeatman, 2013). Many studies have found significant associations between reading and related abilities and fractional anisotropy (FA) in left hemisphere dorsal white matter pathways, specifically the arcuate fasciculus (Arc) and superior longitudinal fasciculus (SLF)(Gullick & Booth, 2014; Myers et al., 2014; Saur et al., 2008; Y. Wang et al., 2017; Yeatman et al., 2011), pathways implicated in the transmission of phonological information for converting visual forms to spoken words (Hickok & Poeppel, 2007). The results of these studies are consistent with findings from studies of children with or at risk for reading disability or dyslexia, which generally find lower FA in dorsal pathways in the children with dyslexia than in the comparison group, even prior to the onset of reading (Langer et al., 2017; Lebel et al., 2019; Vanderauwera et al., 2017; Vandermosten, Boets, Wouters, et al., 2012a; Vandermosten et al., 2015). Moreover, developmental studies find that the degree of reading improvement is associated with the amount of FA increase in these dorsal pathways (Gullick & Booth, 2015; Yeatman, Dougherty, Ben-Shachar, et al., 2012). Many studies have also found associations between reading and FA in ventral pathways, including the inferior longitudinal fasciculus (ILF) and uncinate fasciculus (UF) (Andrews et al., 2010; Bruckert et al., 2019; Dodson et al., 2018b; Ozernov-Palchik et al., 2019; Vanderauwera et al., 2018; Yeatman, Dougherty, Ben-Shachar, et al., 2012). These tracts have been implicated in transmission of semantic and orthographic information, used for understanding meaning (Yeatman, Dougherty, Ben-Shachar, et al., 2012). However, results contradictory to these patterns of association have also been found. For example, a recent large-scale investigation (N=686) of children over a wide age range (5-18 years), found no significant correlations between overall reading ability and FA and no differences in FA between children with and without reading disability in any white matter tracts. This study did find positive associations of FA only with non-word (pseudoword) reading in unexpected white matter tracts—the right SLF and left inferior cerebellar peduncle—and only in the children who were assessed over the age of 9 years rather than at all ages or among younger children (Meisler & Gabrieli, 2022).
It is tempting to assume that the main microstructural white matter feature underlying individual differences in reading is myelin content. Myelination is extremely important in human brain development (Miller et al., 2012), and is associated with the maturation of cognitive functions (Casey et al., 2005; Nagy et al., 2004; Toga et al., 2006). However, dMRI studies in isolation cannot determine the specific features of white matter microstructure driving the associations with reading. Metrics derived from dMRI, such as FA or mean diffusivity, are sensitive to multiple, interacting microstructural factors in addition to the degree of myelination, including axonal packing, axon diameter, number of crossing fibers, and fiber coherence (Jones et al., 2013; Pierpaoli & Basser, 1996). Challenging any assumptions about the critical role of myelin in reading is that both positive and negative associations of reading and FA have been reported. For example, positive associations of reading and FA have been found in the corpus callosum (Lebel et al., 2013; N. Y.-H. Wang et al., 2021). However, negative associations between reading abilities and FA of the corpus callosum (Dougherty et al., 2007; Odegard et al., 2009) have also been reported. Negative associations of reading and FA have also been found in the cerebellum (Bruckert et al., 2020; Travis, Leitner, et al., 2015) and even in dorsal and ventral pathways in a modest sample of children (N=19) across a wide age range (9-17 years) (Travis et al., 2016). If we assume that rapid or efficient information transfer characterizes competent reading performance, then negative associations implicate properties other than myelin or axonal packing as the main drivers of the associations. Other possibilities might be increased axonal diameter or increased number of crossing fibers leading to increasing signal propagation. Variations, of course, might also be related to other differences across samples, such as socioeconomic status (Ozernov-Palchik et al., 2019; Vanderauwera et al., 2019) or age and reading skill (Travis et al., 2016).
Given the limitations of dMRI, further interrogation the role of myelin in reading-white matter associations requires the use of complementary MRI methods that are sensitive to myelin content (Mancini et al., 2020). The literature linking reading and myelin-sensitive metrics is comparatively sparse and results are contradictory. Beaulieu and colleagues (Beaulieu et al., 2020) evaluated the association between reading and myelin water fraction (MWF), a calculation of myelin water or the proportion of short T2 echoes from a multi-echo T2 relaxation analysis. In a study of 20 participants, ages 10-18, they found lower MWF in poor than good readers in left hemisphere pathways and in the splenium of the corpus callosum and positive associations of reading abilities and MWF. Economou and colleagues (Economou et al., 2021) also evaluated MWF in relation to reading in a larger sample (N=69) of 10-year-olds. By contrast, they found a limited number of negative correlations between word reading and MWF in left reading-related white matter tracts. Another recent study (Geeraert et al., 2020) applied principal component analysis (PCA) to combine 10 white matter metrics, including multiple myelin-sensitive measures, across 9 white matter tracts associated with reading with the goal of identifying major features of white matter microstructure linked to reading abilities. Their sample (N=46) ranged in age from 6 to 16 years. Their results showed that the three principal components explained nearly 80% of the variance in white matter characteristics, including one component that was associated with myelin content. None of these principal components, including the component associated with myelin content, correlated with reading abilities, though the myelin component did correlate with age. A fourth study (Kraft et al., 2016) evaluated myelin content through quantitative T1 measures in relation to risk for dyslexia and longitudinal change from pre-reading to reading in a sample of 53 children. They found that T1 intensities in the anterior segment of the Arc differed in children at family risk of dyslexia compared to controls and predicted later reading scores. Variations in the associations of reading and myelin-sensitive measures may be related to the different myelin sensitive measures, but also to the ages and/or age ranges of participants, the measures used to assess reading skills, or other factors, such as socioeconomic status.
Our team used a method of quantitative T1 relaxometry (qR), similar the method used by Kraft and colleagues (Kraft et al., 2016) to estimate the T1 longitudinal relaxation rate of water protons in a magnetic field. R1, the inverse of the time constant (R1 = 1/T1), is considered a proxy for myelin content within white matter areas of the brain (Stüber et al., 2014a). Multiple lines of evidence support the claim that the metric can be used to reflect myelin content within white matter pathways, including histological studies (Mancini et al., 2020; Schmierer et al., 2004; Stüber et al., 2014b), metric changes in patients with multiple sclerosis (Hagiwara et al., 2019; O’Muircheartaigh et al., 2019), hypothesis-generated combined anatomical and functional studies (Dick et al., 2012) and age-related developmental changes in R1 (Yeatman et al., 2014). In a sample of 8- year old FT children (N=23), we found negative associations of reading and FA in the superior cerebellar peduncles and, as predicted, no association of reading and R1 (Bruckert et al., 2020). We concluded that properties other than myelin content appear to be relevant to the information flow between the cerebellum and the cerebrum for individual differences in reading skills in children. The study did not evaluate reading and R1 in cortical tracts.
Children born PT are at risk of reading deficits (Aarnoudse-Moens et al., 2009; Kovachy et al., 2015). Their deficits have been attributed to white matter injury and dysmaturity, part of a complex of encephalopathic changes incurred at birth (Back, 2017; Volpe, 2009). Resultant injuries can be identified on neonatal dMRI scans as altered FA (Li et al., 2015). Birth group differences in FA persist throughout childhood to adulthood (Eikenes et al., 2011; Groeschel et al., 2014). White matter changes in PT children are thought to impact neurocognitive function by altering structural and functional connectivity (Lubsen et al., 2011). Associations of reading and white matter properties differ in very PT children compared to FT children. Our team found different patterns of associations between reading and FA in two different cohorts of FT and PT children (Bruckert et al., 2019; Dodson et al., 2018; Travis et al., 2016). These findings suggest that a different balance of white matter microstructural properties may lead to individual differences in reading in the two birth groups. A gap in the literature is whether reading abilities in FT and PT children would show similar or different patterns of associations with metrics sensitive to myelin content in cerebral white matter pathways, as they do with diffusion metrics.
The present study assessed a sample of FT and PT children, who were part of a longitudinal study of reading development from ages 6 to 8 years (Bruckert et al., 2019; Dodson et al., 2018). When these children turned 8-year-old, new methods for quantitative T1 relaxometry were developed at our center that reduced scan time and made it feasible to use this method with children. We collected both dMRI and quantitative T1 relaxometry in children whose reading abilities were assessed at the same age. The study had two aims.
First, we sought to assess the associations between reading abilities and FA of white matter pathways in the two birth groups (FT and PT) at age 8 years. We evaluated three dorsal pathways (left Arc and bilateral SLF) and four ventral pathways (bilateral UF and the bilateral ILF) based on evidence implicating these tracts in reading (Duffau, 2015a; Herbet et al., 2018a; Saur et al., 2008; Vandermosten, Boets, Poelmans, et al., 2012). For maximizing sensitivity to find associations if they were indeed present, we decided to analyze FA along the trajectory of the tracts rather than rely on mean tract values. We hypothesized that, consistent with previously reported results at age 6 in this sample of FT and PT children, we would observe positive associations between reading abilities and FA in these tracts in FT children at age 8, but not in the PT children (Bruckert et al., 2019; Dodson et al., 2018). We then planned to assess whether birth group moderated the association in regions of the white matter tracts where associations of reading abilities and FA were identified in either group.
Second, we sought to assess a novel association between reading abilities and R1 of the same pathways. We hypothesized that we would not observe associations between reading and R1 in the FT group based on previous findings from children of a single age similar to the age of our participants (Economou et al., 2021; Geeraert et al., 2020). However, we recognized that associations might be found based on 2 studies, one of children with a wide age range and range of reading abilities and dyslexia (Beaulieu et al., 2020) and one in a sample of children at risk for dyslexia (Kraft et al., 2016). Given that the encephalopathy of prematurity (white matter injury and dysmaturity) seen in PT children results from injury to the myelin-producing oligodendrocyte precursor cells (Back, 2017; Volpe, 2009), we hypothesized that the association between reading and the myelin-sensitive metric (R1) would be positive in the PT group. Again, we planned to directly test whether the birth group moderated the association of reading and R1 in regions of the white matter tracts where associations were identified in either group.
2. Materials and Methods
2.1. Participants
A sample (N=95) of children born FT (n=45) or PT (n=50) were recruited at age 6 years between 2012 to 2015 as part of a longitudinal study (Bruckert et al., 2019; Dodson et al., 2018). The participants reported here had to have complete reading measures and useable dMRI data at age 8 years. Of the 36 FT participants with complete reading and dMRI data at age 8 years, n=24 had usable qR data. Missing qR data were not collected (n=4) or were excluded due to motion determined from visual inspection (n=8). Of the 43 PT participants with complete reading and dMRI data at age 8 years, n=29 had useable qR data. Missing qR data were not collected (n=10), or were excluded due to motion determined from visual inspection (n=4). MRI and reading measures were collected at the same study time point, separated at most by 4 weeks.
Inclusion in the PT group required a gestational age (GA) < 32 weeks, the GA below which neonates are at greatest risk for white matter injury (Back, 2017). Children were recruited from the Lucile Packard Children’s Hospital Stanford High-Risk Infant Follow-Up Clinic, local parent groups, and the surrounding San Francisco Bay Area. Exclusion criteria included neurological, sensory, or cognitive factors unrelated to prematurity that could account for white matter differences or could impact learning to read English, including congenital anomalies, active seizure disorder, hydrocephalus, sensorineural hearing loss, visual impairment, intelligence quotient <80, and non-English speakers. Socioeconomic status was measured using a modified 4-Factor Hollingshead Index (Hollingshead, 1975). A neuroradiologist assessed T1-weighted scans for evidence of white matter injury.
The Stanford University Institutional Review Board approved the experimental protocol (#IRB-22233). A parent or legal guardian provided informed written consent. Children provided assent. Participants were compensated for participation.
2.2. Reading Measure
For the current study, we analyzed the Oral Reading Index (ORI) generated from the Gray’s Oral Reading Tests, 5th Edition (Wiederholt & Bryant, 2012) as the measure of reading. The ORI asks children to read short paragraphs aloud and then answer questions about what they read. A composite score, composed of fluency (rate and accuracy) and comprehension is reported as a standard score (mean=100, standard deviation=15). Study assessments were completed in English.
2.3. MRI Data Acquisition and Processing
MRI data were acquired on a 3T Discovery MR750 scanner (General Electric Healthcare, Milwaukee, WI, USA) equipped with a 32-channel head coil (Nova Medical, Wilmington, MA, USA) at the Center for Cognitive and Neurobiological Imaging at Stanford University (www.cni.stanford.edu). Participants were scanned without sedation. High-resolution T1-weighted anatomical images were collected using an inversion recovery-prep 3D fast-spoiled gradient (FSPGR) sequence collected in the sagittal plane (0.9 x 0.9 x 0. 9 mm3 voxel size) with a scan time of 4 min 49 s. The T1-weighted volume was used as an anatomical reference for the alignment of the dMRI images.
dMRI data were acquired with a diffusion-weighted, dual-spin echo, echo-planar imaging sequence with full brain coverage. Diffusion weighted gradients were applied at 30 non-collinear directions with a b-value=1,000 s/mm2. Three volumes were acquired at b=0 at the beginning of the scan. We collected 70, 2mm-thick, axial slices in each participant (TR=8300 ms; TE=83.1 ms; FOV=220 mm; matrix size of 256 x 256; 0.8594 x 0.8594 x 2 mm3 voxel size) over the course of 4 min 18 s.
R1 maps were acquired with spoiled gradient echo (SPGR) images at a four flip angles (α = 4°, 10°, 20°, and 30° ; TR=14 ms; TE=2 ms) (Fram et al., 1987). SPGR scans were acquired sequentially, without breaks to ensure that scan parameters were similar across flip angles. A 0.9375 x 0.9375 x 1.5 mm3 voxel size was chosen to acquire the four SPGR scans in a reasonably short time frame (2 min 38 s), appropriate for a pediatric clinical sample. To obtain an unbiased R1 map, we acquired a spin-echo inversion-recovery (SEIR) sequence with echo-planar imaging (EPI) read-out, measured at lower resolution (1.875 x 1.875 x 4 mm3 voxel size). Four inversion times were measured (2400, 1200, 400 and 50 ms; TR = 3 s; TE = 47 ms). Unbiased R1 maps obtained from SEIR-EPI scans were used to correct for Radio Frequency (RF) transmit bias in the higher-resolution SPGR scans as described and validated by others (Mezer et al., 2013a, 2016a). R1 maps were directly aligned to the dMRI.
2.3.1. Image Preprocessing
The T1w images were first aligned to the canonical ac-pc orientation. Diffusion weighted images were pre-processed with Vistasoft (http://github.com/vistalab/vistasoft/mrDiffusion), an open-source software package implemented in MATLAB R2012a (Mathworks, Natick, MA). The dual-spin echo dMRI sequence used here greatly reduces eddy-current distortions obviating the need for eddy-current correction (Reese et al., 2003). Subject motion during the diffusion weighted scan was corrected using a rigid body alignment algorithm (Rohde et al., 2004). Relative head motion in each participant was quantified by calculating the magnitude of motion correction (in voxels) in the x-y-z plane of each volume relative to the prior volume. For each diffusion scan, we counted the number of volumes with translational motion of 1 voxel or more. We then calculated the mean number of volumes with ≥1 voxel of relative motion across the entire sample. Participants who deviated from this mean by more than three standard deviations were excluded from analyses. Based on these criteria, no subjects were excluded from analyses and thus balanced across both PT and FT groups(Bruckert et al., 2019). Each diffusion weighted image was registered to the mean of the b=0 images and the mean b=0 image was registered automatically to the participant’s T1w image, using a rigid body transformation (implemented in SPM8, http://www.fil.ion.ucl.ac.uk/spm/; no warping was applied). The combined transform that resulted from motion correction and alignment to the T1w anatomy was applied to the raw data once, and the transformed images were resampled to 2 x 2 x 2mm3 isotropic voxels. This step was performed because non-isotropic voxels may bias the tensor fit and distort both tracking and measurements of diffusion properties (Oouchi et al., 2007). Diffusion gradient directions were then adjusted to fit the resampled diffusion data (Leemans & Jones, 2009).
For each voxel in the aligned and resampled volume, tensors were fit to the diffusion measurements using a robust least-squares algorithm, Robust Estimation of Tensors by Outlier Rejection (RESTORE), which is designed to remove outliers at the tensor estimation step (Chang et al., 2005). A continuous tensor field was estimated using trilinear interpolation of the tensor elements. The eigenvalue decomposition of the diffusion tensor was calculated and the resulting three eigenvalues (λ1, λ2, λ3) were used to compute fractional anisotropy (FA), mean diffusivity (MD; i.e., the mean of λ1, λ2, and λ3), radial diffusivity (RD, i.e., the mean of λ2 and λ3) and axial diffusivity (AD, i.e., λ1) (Basser & Pierpaoli, 1996).
Quantitative T1 (relaxation time, seconds) maps were calculated using mrQ, (https://github.com/mezera/mrQ), an open-source software package implemented in MATLAB R2012a (Mathworks, Natick, MA). T1 fitting and bias correction was calculated using methods described in (Mezer et al., 2013b, 2016b). These procedures involve measuring the local transmit-coil inhomogeneities which are calculated by minimizing the difference between the unbiased T1 map calculated from the low-resolution SEIR-EPI images (Barral et al., 2010) and the T1 map fit from the high-resolution multiple flip angle SPGR images. Minimization was achieved using a nonlinear least-squares (NLS) solution that assumes transmit-coil inhomogeneities to be smooth in space (Chang et al., 2008).
To co-register a subject’s quantitative relaxometry (qR) images to their dMRI data, we used the Advanced Normalization Tools (ANTs) software package (Avants et al., 2011). This tool was used to warp the qR images to the non-diffusion weighted b=0 images, as these images have relatively similar contrast (Berman et al., 2017). This warping procedure is used to minimize mis-registration errors due to EPI distortions in the dMRI data. EPI distortions were minimal due to the 2x ASSET acceleration used for the readout of the diffusion-weighted images. After applying the diffeomorphic warp, image registration was manually inspected using the mrView software (Tournier et al., 2012). Manual inspection of the aligned images confirmed that the registration was accurate in all subjects. From the qR maps, we then derived R1, the inverse of T1 (R1 = 1/T1).
2.3.2. Quantification of White Matter Tissue Properties
Automated Fiber Quantification (AFQ; https://github.jyeatman/AFQ; (Yeatman, Dougherty, Myall, et al., 2012)), a software package implemented in MATLAB R2012a (Mathworks, Natick, MA), was used to isolate and characterize white matter metrics from three dorsal tracts (Arc-L and bilateral SLF) and four ventral white matter tracts (bilateral ILF and bilateral UF). We selected these pathways a priori based on evidence implicating their involvement in phonological and semantic processes (Duffau, 2015b; Herbet et al., 2018b; Saur et al., 2008; Vandermosten, Boets, Wouters, et al., 2012b). Due to previously described limitations of deterministic tractography for segmenting the right Arc (Catani et al., 2007; Lebel & Beaulieu, 2009; Mishra et al., 2010; Travis, Adams, et al., 2015; Yeatman et al., 2011), we excluded it from analysis a priori. Using AFQ software, we generated an FA or R1 tract profile that described the variations in either tissue parameter (FA and R1) along the central portion of the tract. Specifically, tract FA or tract R1 profiles each were calculated at 30 equidistant locations along the central portion of each fiber tract bounded by the same two ROIs used for tract segmentation. The core of the tract was calculated by defining 30 sample-points along the tract and computing the robust mean position of the corresponding sample points. The robust mean for all tracts except the SLF was computed by estimating the 3-dimensional Gaussian covariance of the sample points and removing fibers that are either located more than 5 standard deviations away from the mean position of the tract, or that differed more than 4 standard deviations in length from the mean length of the tract. In the SLF, these parameters resulted in the inclusion of many fibers not consistent with the known anatomy of the SLF. Therefore, for the SLF, fibers that were 4 standard deviations away from the mean position of the tract, or that differed more than 1 standard deviation in length from the mean length of the tract were removed. This computation constituted the final automatic cleaning stage of the segmented tracts. Tract profiles were then averaged to produce a single mean FA or R1 value for each tract. Importantly, the FA and R1 measurements were obtained for the same tract regions.
Figure 1 shows the left hemisphere tracts in a representative participant. We generated FA and R1 tract profiles to describe variations in each of the white matter tissue parameters at 30 equidistant locations along the central portion of each fiber tract, bounded by the same regions of interest used for tract segmentation. For greater sensitivity, relative to mean values, we calculated and analyzed the association of reading (ORI) with values of the relevant metric (FA or R1) along the trajectory of the tract.
Figure 1. Left hemisphere tract renderings are displayed on a mid-sagittal T1 image from a representative PT participant.

Right hemisphere tract renderings not shown. (A) The arcuate fasciculus is shown in blue, (B) the superior longitudinal fasciculus is shown in green, (C) the uncinate fasciculus is shown in yellow, (D) the inferior longitudinal fasciculus is shown in orange. Dashed lines represent the location of the regions of interest (ROIs) used to segment each pathway from the whole-brain tractogram.
2.4. Statistical Approach
Statistical analyses were conducted using the Statistical Package for the Social Sciences (SPSS version 25.0 and 26.0, IBM Corp., 2018). Statistical significance was set at p<0.05. Adherence to the normal distribution of clinical and neurobiological data was assessed using the Shapiro–Wilk test. Based on normality, we used parametric tests for all associations. A False Discovery Rate (FDR) of 5% was set for zero-order associations to account for multiple comparisons across seven tracts (Benjamini & Hochberg, 1995).
We used descriptive statistics, including t-tests for mean differences and Chi-square analyses for proportions to compare the FT and PT groups. We repeated the descriptive analyses for the subset of children who had the R1 measure. We compared boys and girls on mean tract FA and mean tract R1 for all tracts, correcting for the number of tracts analyzed for each metric, and on the outcome, ORI. We evaluated the association of socioeconomic status to tract metrics by conducting a Pearson correlation between Hollingshead Index and mean tract FA or R1, correcting for the number of tracts, and on the outcome, ORI. We analyzed whether abnormal neonatal ultrasound or MRI scan related to FA or RI by dividing the group into a normal or abnormal subgroup and comparing means.
2.4.1. Associations between reading and white matter microstructure metrics
First, to identify associations between reading abilities and white matter microstructural properties, we computed Pearson’s correlations between ORI and FA, and between ORI and R1, for 30 equidistant nodes along each of the four tracts within the FT and the PT groups separately. We calculated the associations separately because previous studies found differences in the patterns of associations in FT and PT children, which could obscure associations if they existed (Bruckert et al., 2019; Dodson et al., 2018b; Travis et al., 2016). The tract profile analysis utilized a nonparametric permutation-based method to control for 30 along-tract comparisons, producing a family-wise error corrected cluster size and a critical r-value for each tract (Nichols & Holmes, 2002). Within each tract, along-tract correlations were considered significant if (1) correlations at an uncorrected level of p<0.05 occurred in adjacent nodes ≥ the critical cluster size (range 6-9 nodes) or (2) correlations ≥ the critical r-value occurred within a minimum cluster size ≥ 3 nodes. For each set of analyses within FA or R1, we used False Discovery FDR to correct significance for multiple comparisons across the number of tracts for the peak node in the segment where along-tract correlations were identified, with FDR α < 0.05.
2.4.2. Group differences in along-tract associations between reading and white matter microstructure metrics.
We conducted a series of hierarchical linear regression models to assess whether associations between reading ability and white matter microstructural properties were moderated by birth group (FT vs PT) in the segments of the tracts in which significant along-tract correlations were identified. We calculated the mean FA or mean R1 of the adjacent nodes in the longest region of the tract with significant correlations with ORI. Because of sex differences in prematurity (Peelen et al., 2016), reading, and white matter (Krafnick & Evans, 2019), we entered sex into each model. Similarly, because of SES associations with prematurity (Parker et al., 1994), reading (Buckingham et al., 2013; Hart & Risley, 1995; Sirin, 2005), and white matter (Ozernov-Palchik et al., 2019; Vanderauwera et al., 2019), we entered SES into each model to ensure results were related to birth group or white matter. We next assessed the main effects of the white matter metrics and birth group. To determine if birth group moderated the prediction of reading outcomes based on white matter metric, we then entered birth group as an interaction term within the model. The variance inflation factor (VIF) was calculated to assess multicollinearity of each model. We considered VIF values less than 10 to indicate that there was no concern for multicollinearity (Field, 2013). Given the modest sample size, we chose not to correct for multiple comparisons for these secondary analyses.
The rationale for performing moderation analyses in the subset of segments with significant associations in at least one of the two groups was to identify whether these modest associations in one group were in fact significantly different from the absence of significant associations in the other group. In other words, we sought to determine if the relationships identified between the two groups were significantly different from each other. In tracts where no significant associations were identified in either group, we would not expect to be able to identify any differences in the associations between the groups, whereas in tracts we found a relationship, comparing that relationship to the other group assesses whether the correlation in one group is significantly different from correlation in the other group (where we found no significant association).
3. Results
3.1. Participant Characteristics
Participant characteristics are shown in Table 1. The entire sample was available for assessment of reading and FA from dMRI. By study design, within the total sample, birth groups differed in GA (FT = 39.6 ± 1.6 weeks, PT = 29.3 ± 2.1 weeks, t=24.61, p<0.001) and birthweight (FT = 3325 ± 431 grams, PT = 1310 ± 429 grams, t=20.73, p<0.001). There were no statistically significant differences in mean-tract FA, mean-tract R1, or proportion of female/male participants between the two groups. FT participants were, on average, 1 month younger than PT participants at the time of testing (FT = 8.1 ± 0.2 years, PT = 8.2 ± 0.2 years, t=−2.13, p=0.04). Standard scores, which account for age at testing, for reading (ORI) are reported. A subset of children contributed R1 data. Participant characteristics for this subsample can be found in Supplemental Table 1.
Table 1.
Sample characteristics.
| Full term | Preterm | X2 or t | p | |
|---|---|---|---|---|
|
n (%) or M (SD) N=36 |
n (%) or M (SD) N=43 |
|||
|
| ||||
| Demographic measures | ||||
| Sex: Female | 20 (56) | 15 (35) | 3.39 | 0.065 |
| Age at Testing, years | 8.1 (0.2) | 8.2 (0.2) | −2.13 | 0.028 |
| Birthweight, grams | 3325 (431) | 1310 (429) | 20.73 | <0.001 |
| Gestational Age at birth, weeks | 39.6 (1.5) | 29.3 (2.1) | 24.61 | <0.001 |
| Hollingshead Indexa | 57.2 (11.0) | 51.7 (12.7) | 2.05 | 0.044 |
| Neonatal Head Ultrasound or MRI | N=36 | |||
| Grade I IVHb | - | 8 (22) | - | - |
| Grade II IVH | - | 1 (3) | - | - |
| Grade III IVH | - | 1 (3) | - | - |
| Small Periventricular Lesions | - | 1 (3) | - | - |
| Mild White Matter Injury | - | 5 (14) | - | - |
| Enlarged Ventricles | - | 3 (8) | - | - |
| Other | 1 (3) | |||
| Neurocognitive Measures | - | - | ||
| Oral Reading Indexc | 102.0 (SD 12.6) | 95.8 (SD 10.8) | 2.34 | 0.022 |
| Oral Reading Index, range | 78 – 142 | 76 – 126 | - | - |
Modified Hollingshead Index, socioeconomic status.
Intraventricular Hemorrahge (IVH)
Oral Reading Index Scaled Score, Gray Oral Reading Tests, 5th Edition.
We examined sex differences in FA and R within the FT and PT groups. After correction for multiple comparisons, there were no sex differences in mean FA or mean R1 in any tract in either the FT or PT groups. Hollingshead Index differed in the larger sample (FT = 57.2 ± 11.0, PT = 51.7 ± 12.7, t=2.1, p=0.04), but not in the R1 subsample (FT = 57.1 ± 11.8, PT 54.3 ± 12.6, t=0.9, p=0.37). After correction for multiple comparisons, there were no significant correlations between Hollingshead Index and mean FA in either birth group. After correction for multiple comparisons, Hollingshead Index remained significantly correlated with mean R1 only in the UF-L in the PT group (r = 0.56, p = 0.002). We probed whether the FA and R1 values related to evidence of abnormalities on neonatal head ultrasounds or MRI scans. We found no differences between children with and without neonatal abnormalities for FA or R1, after correction for multiple comparisons. See Supplemental Table 2.
The mean ORI scores were significantly higher in the FT compared to the PT group (FT = 102.0 ± 12.6, PT = 95.8 ± 10.8, t=2.3, p=0.02). Within the FT group, two participants had ORI < 85 (scores = 78 and 84). Within the PT group, five participants had scores below 85 (range 76-84). Within the FT group, girls had higher reading scores than boys (girls 106.0, boys 97.0, t=2.26, p=.03), but no sex differences were found in the PT group (girls 97.5, boys 94.9, t=.731, p=.47). The participants with abnormal neonatal imaging did not have lower reading scores (Supplemental Table 2).
3.2. Associations between reading abilities and FA
3.2.1. Correlations between ORI and FA
As hypothesized, significant positive correlations between ORI and FA were identified in large segments of the Arc-L (nodes 2-10), SLF-L (nodes 13-20), and SLF-R (nodes 1-22) in the FT group (Table 2, Figure 2). These associations remained significant after FDR correction for multiple comparisons. We found no significant correlations between ORI and FA in the PT group, as predicted.
Table 2.
Associations of Oral Reading Index (ORI) and FA metrics in regions of significant associations in along-tract analyses in at least one group, demonstrating the range of Pearson’s correlations between ORI and mean FA or mean R1 of the segment of the tract and p value of the node of highest correlation in which significant associations were found, after family-wise correction.
| ORI-FA | ORI-R1 | |||||||
|---|---|---|---|---|---|---|---|---|
| FT | PT | FT | PT | |||||
|
| ||||||||
| Tract Dorsal | r-range | p-peak | r-range | p-peak | r-range | p-peak | r-range | p-peak |
| Arc-L (nodes 2-10) |
0.36-0.49 | 0.003 * | −0.14–0.14 | 0.36 | - | - | - | - |
| SLF-L (nodes 13-20) |
0.37-0.52 | 0.001 * | −0.08–0.09 | 0.56 | - | - | - | - |
| SLF-L (nodes 1-5) |
- | - | - | - | −0.05–0.04 | 0.81 | 0.41-0.43 | 0.021 * |
| SLF-R (nodes 1-22) |
0.36-0.55 | <0.001 * | −0.26–0.16 | 0.09 | - | - | - | - |
| Ventral | ||||||||
| UF-R (nodes 13-19) |
- | - | - | - | −0.17–0.14 | 0.41 | 0.37–0.49 | 0.007 * |
| ILF-L (nodes 20-23) |
- | - | - | - | −0.05–0.09 | 0.68 | 0.39–0.56 | 0.001 * |
Abbreviations: FT = full-term; PT = preterm; FA = fractional anisotropy; R1 = myelin-derived metric; ORI = Oral Reading Index; Arc = Arcuate; SLF = Superior longitudinal; UF = Uncinate; ILF = Inferior longitudinal; L = left; R = right; r range = range of correlation coefficients for the nodes meeting the threshold for within tract significance; ppeak = p value for the largest correlation coefficient within the significant nodes; bold = significant;
= False Discovery Rate-corrected for multiple comparisons.
Figure 2. Associations between along-tract FA and ORI in FT children and along-tract R1 and ORI in PT children at age 8 years.
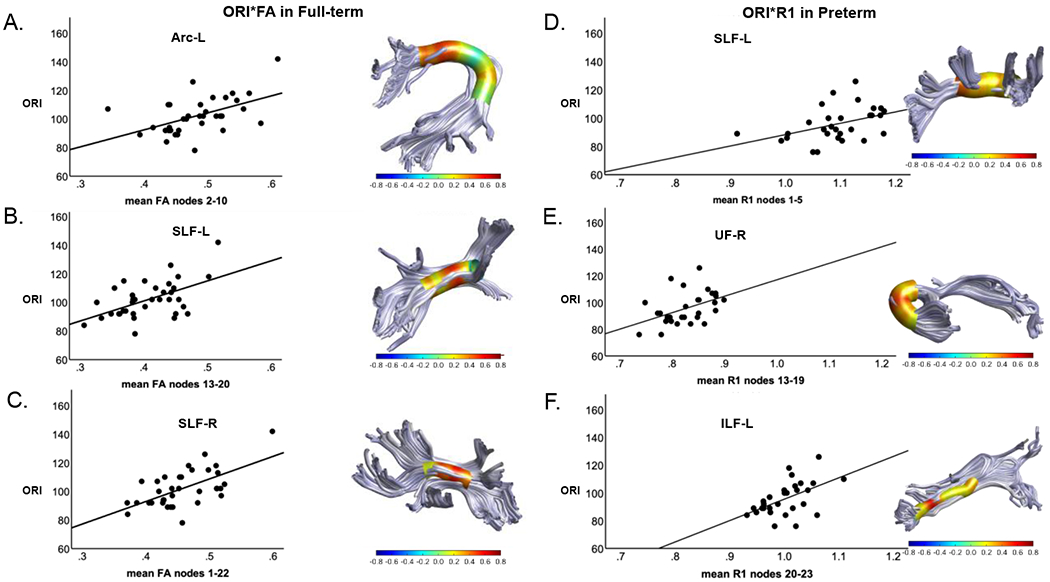
Each panel includes a rendering of a specific tract with the strength of the Pearson’s correlation (r) between the white matter metric (FA or R1) and ORI at 30 equidistant nodes along the tract represented as a heat-map cylinder surrounding the tract. Each panel also includes a scatter plot representing the strength of the association between ORI and the mean of FA or R1 of the adjacent nodes in the longest region of the tract with significant correlations. Panels show the results for ORI-FA correlations in the FT participants in the AF-L (A), SLF-L (B), SLF-R (C), and for ORI-R1 correlations in the PT participants in the SLF-L (D), UF-L (E), and ILF-L (F). Only tracts in which statistically significant correlations were identified are shown. Abbreviations: R1 = Relaxation rate (s−1); ORI = Oral Reading Index; AF-L = Left Arcuate Fasciculus; SLF-L = Left Superior Longitudinal Fasciculus; SLF-R = Right Superior Longitudinal Fasciculus; UF-R = Right Uncinate Fasciculus; ILF-L = Left Inferior Longitudinal Fasciculus.
3.3. Associations between reading abilities and R1
3.3.1. Correlations between ORI and R1
We found no significant correlations between ORI and R1 in the FT group, as expected. In PT children, as predicted, significant positive correlations between ORI and R1 were identified in the SLF-L (nodes 1-5), UF-R (nodes 13-19), and ILF-L (nodes 20-23) (Table 2, Figure 2). These associations remained significant after FDR correction for multiple comparisons.
3.4. Group differences in along-tract associations between reading and white matter microstructure metrics
Moderation analyses demonstrated significant interactions between FA and birth group in all three segments of tracts with significant FT FA – ORI correlations, covarying for sex and SES (Table 3 and Figure 3). The models showed significant differences between the slopes of the associations between reading skills and FA for FT and PT groups. SES was not significant in any model. Sex remained significantly associated with reading outcome in the Arc-L and SLF-R models. Analyses demonstrated that in the FT group, increasing FA in specific tract segments was associated with increasing reading scores, while in the PT group, increasing FA was not associated with reading scores. Moderation analyses demonstrated significant interactions between R1 and birth group in the UF-R and ILF-L (Table 3 and Figure 3). The interaction did not meet the specified criteria for significance in the SLF-L (p = 0.076). SES remained significantly associated with reading outcome in the SLF-L model. Analyses demonstrated that in the PT group, increasing R1 in specific tract segments as associated with increasing reading scores, while in the FT group, increasing R1 was not associated with reading scores.
Table 3.
Birth Group moderates the relations between white matter and reading
| A. FA | Arc-L nodes 2-10 | SLF-L nodes 13-20 | SLF-R nodes 1-22 |
|---|---|---|---|
|
| |||
| Sex | 4.91 (2.67) * | 3.60 (2.66) | 5.26 (2.46) * |
| SES | 0.18 (1.65) | .17 (0.10) | 0.14 (0.10) |
| FA | 101.48 (33.89) ** | 115.85 (38.96) ** | 140.64 (36.30) *** |
| Birth Group | 55.51 (21.95) * | 48.35 (18.58) * | 72.82 (21.58) ** |
| FAxBirth Group | −123.72 (44.74) ** | −129.12 (44.90) ** | −167.48 (46.02) *** |
|
| |||
| R2 | 0.27 | 0.26 | 0.32 |
| p | 0.004 | 0.0004 | <0.0001 |
|
| |||
| B. R1 | SLF-L nodes 1-5 | UF-R nodes 13-19 | ILF-L nodes 20-23 |
|
| |||
| Sex | 3.98 (3.01) | 4.54 (2.92) | 2.90 (3.01) |
| SES | 0.25 (0.14) † | 0.28 (0.13) * | 0.20 (0.15) |
| FA | −5.33 (26.10) | −9.34 (42.53) | −12.15 (46.44) |
| Birth Group | −84.70 (45.36) † | −110.6 (51.91) * | −140.1 (66.49) * |
| FAxBirth Group | 75.25 (41.46) † | 130.60 (62.18) * | 137.37 (66.78) * |
|
| |||
| R2 | 0.21 | 0.24 | 0.23 |
| p | 0.046 | 0.018 | 0.028 |
Data are coefficients (SE).
p < 0.1
p < 0.05
p < 0.005
≤ 0.0005
Figure 3.

Birth group moderates the associations between reading and FA and R1. A. Moderation analyses demonstrated significant interactions between birth group and FA for all tract segments in which significant correlations between ORI and FA were found. FA predicts reading in FT, but not preterm children. B. Moderation analyses demonstrated significant interactions between birth group and R1 in the UF-R and ILF-L. R1 predicts reading in preterm, but not full term children. Full term group is shown in blue with filled circles. Preterm group is shown in red with filled squares. Points represent values predicted by the models at the 16th, 50th, and 84th percentile FA or R1 values. All analyses are adjusted for sex and SES.
3.5. Associations between FA and R1
To further understand the variation in the patterns of association, we assessed the degree of association between FA and R1 in the tracts of interest, using their mean-tract value. We found no statistically significant associations within the FT group (Supplemental Table 3). In the PT group, however, associations between R1 and FA were positive and statistically significant in the SLF-R, UF-L, UF-R, and ILF-R (Supplemental Table 3).
4. Discussion
In this investigation of 8-year-old FT and PT children with a wide range of reading abilities, we evaluated correlations between reading abilities and two concurrent white matter microstructure metrics, FA from dMRI and R1 from quantitative T1 relaxometry. We found positive associations between reading abilities and FA within dorsal pathways (Arc-L, SLF-L, SLF-R) in FT children, but not in PT children. Birth group moderation analyses confirmed that the association was present only in the FT group. In contrast, we found positive associations between reading abilities and R1 in segments of one dorsal (SLF-L) and two ventral (UF-R, ILF-L) pathways in PT children, but not in FT children. Again, birth group moderation analyses confirmed that the associations were present only in the PT group.
4.1. Correlations between reading abilities and white matter metrics
We observed significant positive associations between reading abilities and FA within dorsal tracts in FT children. These results are consistent with those of many other studies. However, these findings contradict other reports that either fail to find associations (Meisler & Gabrieli, 2022) or that find negative associations (Frye et al., 2011; Odegard et al., 2009; Travis et al., 2016). It is possible that the study design, including the age or age range of the participants, may impact the results. Yeatman et al found variations in developmental patterns as a function of age and reading level (Yeatman, Dougherty, Ben-Shachar, et al., 2012), which may obscure patterns of associations in large studies at a single age. In addition, socioeconomic status of participants has been shown to change associations of function and brain structure (Ozernov-Palchik et al., 2019; Vanderauwera et al., 2019). Our results were robust to the inclusion of a measure of socioeconomic status in the models. Finally, the nature of the reading metrics likely contributes to the ability to find associations. Here we use an assessment of text reading that integrates reading speed, accuracy, and comprehension. Studies that focus on decoding abilities may find different patterns of association, particularly associations limited to dorsal regions (Arrington et al., 2017).
We did not find positive correlations of reading ability and FA in the PT children. This finding is consistent with previous studies of this same sample of children at a younger age. We previously reported that FA at age 6 was related to reading abilities at age 6 and at age 8 years in FT children, but not in PT children (Bruckert et al., 2019; Dodson et al., 2018). We think that efficient information transfer is likely important for individual differences in reading in PT as well as FT children. However, the balance of microstructural features that contribute may vary given that these children likely had microscopic changes to white matter beginning in the neonatal period (Back, 2017; Volpe, 2009).
As we hypothesized, we did not observe associations of reading and R1 for the FT group. R1 within white matter tracts is considered a proxy for myelin content of the tract (Stüber et al., 2014a). The literature assessing associations of reading with myelin-sensitive measures from MRI has contradictory results (Beaulieu et al., 2020; Economou et al., 2021; Geeraert et al., 2020; Kraft et al., 2016). While myelin content may be associated with maturity and transmission efficiency, it may not to be the principal factor associated with individual differences in reading in FT born individuals, especially when children are assessed at a single age and variation in the relevant metric may not show sufficient variation (Economou et al., 2021; Geeraert et al., 2020). A recent study that obtained dMRI at several points during an intensive reading intervention for poor readers found widespread increases in FA after the initial phase of intervention, associated with improvements in reading (Huber et al., 2018, 2021). This time frame of improvement and of FA increase made it unlikely that the intervention could stimulate major increases in myelination. Absent or negative associations of FA and reading in other pathways or at over a range of ages (Dougherty et al., 2007; Frye et al., 2011; Meisler & Gabrieli, 2022; Odegard et al., 2009; Travis et al., 2016) suggest that microstructural features of white matter circuitry other than the degree of myelination, axon density and axonal packing can play a role in individual differences in reading across different white matter tracts or samples. Alternative MRI sequences or analyses may be useful for assessing the strength of the association between reading and other white matter or glial metrics.
We found that individual differences in reading among PT children were not associated with FA at age 8. These findings are interesting because the PT group had mean reading scores in the expected range, though the mean scores were lower than that of the FT group. Positive associations between reading abilities and FA in the same pathways have been found at older ages in PT children (Mullen et al., 2011; Travis et al., 2016).
In this sample of PT children, individual variation in reading abilities were associated with R1 in four of the seven tracts examined in this study. PT birth leads to encephalopathic changes that include perinatal injury to oligodendrocyte precursors, the cell line that later myelinates axons, and/or to aberrant regeneration and repair of the oligodendrocytes and, consequently, to white matter tracts (Back, 2017; Volpe, 2009). Long-term neurodevelopmental outcomes in PT children are currently thought to result from these processes. R1 may be associated with the severity of the initial injury and/or the degree of recovery and compensation of white matter after the initial injury. Such factors would explain why associations between reading and R1 were found in the PT group only. Moreover, we also found that FA and R1 did not differ across the birth groups. However, the association of FA and R1 did differ. FA and R1 were correlated in the SLF-R, bilateral UF, and the ILF-R in PT but no associations were found in the FT group. This finding supports the importance of myelin content to white matter circuitry for reading after preterm birth. However, that association did not lead to a positive association of FA and reading. To understand the drivers of associations between reading and R1 fully in the PT group would require a longitudinal study from the neonatal periods forward. While myelin content would contribute to FA, R1 is also sensitive to other factors, such as iron content and lipid composition, that also may contribute to FA (Stüber et al., 2014a). Other properties contributing to FA, but not to R1, including axonal diameter, fiber coherence, and proportion of crossing fibers, may reduce the association between reading and FA in the PT group. These factors may have been negatively impacted by preterm birth and its aftermath.
4.2. Tracts in which associations were found
We observed ORI-FA associations in dorsal pathways in the FT group and ORI-R1 associations in both dorsal and ventral pathways in the PT group. The variation in location of significant associations could be explained by differences related to behavior, or to developmental differences resulting from injury or recovery from PT birth. Associations between reading abilities and dorsal tract FA in the FT group may be due to the age of the participants, the modest sample size, and/or different measurement properties of the dorsal and ventral tracts in this study. Our identification of associations between reading abilities and R1 in some dorsal and some ventral tracts in PT children suggests that the ventral tracts are also important for reading abilities in this birth group. The variation of the identity of the tracts in which associations between reading abilities and white matter microstructural properties were found in FT and PT children is further evidence for variation in the neurobiology of reading in these two birth groups.
4.3. Limitations
Limitations include a modest sample size. Future studies in larger samples with greater diversity in reading abilities could confirm the findings described here and explore whether associations exist in other white matter pathways. An additional limitation was the use of only two MRI modalities. As new modalities become available, they could be integrated with the methods here to gain further insights into the factors associated with reading.
5. Conclusions
In summary, by combining complementary structural neuroimaging approaches, we identified relations between reading abilities and concurrent white matter properties that differed in two birth groups — FT and PT children. The associations between reading and FA but not R1 in the FT group implicate axonal features, such as axonal diameter and packing, in individual variations of reading abilities. The associations between reading and R1 but not FA in the PT group implicate myelin content as the primary factor associated with reading abilities. Further exploration of white matter pathways using multiple imaging techniques will contribute to understanding reading-brain associations in different birth groups.
Supplementary Material
Acknowledgments:
The authors received funding support from the National Institute of Child Health and Human Development (Grant # R01HD069162 and 2RO1- HD069150 [Feldman], 5K99HD084749 [Travis]), a Young Investigator Award to Dr. Travis, from the Society of Developmental and Behavioral Pediatrics (2014), a Tashia and John Morgridge endowed fellowship through the Stanford Maternal Child Health Research Institute Clinical Trainee Grant to Dr. Dubner, and a Postdoctoral Research Training in Child Psychiatry and Neurodevelopment fellowship to Dr. Brignoni-Pérez from the National Institute of Mental Health (A. Reiss, PI: T32 MH019908). Funders were not involved in study design, data collection, data analysis, manuscript preparation or publication decisions. We thank the children and their families for their gracious participation.
Abbreviations:
- Arc
Arcuate fasciculus
- dMRI
Diffusion magnetic resonance imaging
- FA
fractional anisotropy
- FDR
False Discovery Rate
- FT
full term
- GA
gestational age
- ILF
Inferior Longitudinal Fasciculus
- IVH
intraventricular hemorrhage
- ORI
Gray’s Oral Reading Tests, 5th editio Oral Reading Index
- PT
preterm
- qR
quantitative MRI T1 relaxometry
- R1
T1 relaxation rate
- SES
Socioeconomic status
- SLF
Superior Longitudinal Fasciculus
- UF
Uncinate Fasciculus
REFERENCES
- Aarnoudse-Moens CSH, Weisglas-Kuperus N, van Goudoever JB, & Oosterlaan J (2009). Meta-analysis of neurobehavioral outcomes in very preterm and/or very low birth weight children. Pediatrics, 124(2), 717–728. [DOI] [PubMed] [Google Scholar]
- Andrews JS, Ben-Shachar M, Yeatman JD, Flom LL, Luna B, & Feldman HM (2010). Reading performance correlates with white-matter properties in preterm and term children. Dev Med Child Neurol, 52(6), e94–100. 10.1111/j.1469-8749.2009.03456.x [DOI] [PMC free article] [PubMed] [Google Scholar]
- Arnold EM, Goldston DB, Walsh AK, Reboussin BA, Daniel SS, Hickman E, & Wood FB (2005). Severity of emotional and behavioral problems among poor and typical readers. Journal of Abnormal Child Psychology, 33(2), 205–217. [DOI] [PubMed] [Google Scholar]
- Arrington CN, Kulesz PA, Juranek J, Cirino PT, & Fletcher JM (2017). White matter microstructure integrity in relation to reading proficiency ☆. Brain and Language, 174, 103–111. 10.1016/j.bandl.2017.08.002 [DOI] [PMC free article] [PubMed] [Google Scholar]
- Avants BB, Tustison N, & Song G (2011). Advanced Normalization Tools (ANTS). Insight Journal. [Google Scholar]
- Back SA (2017). White matter injury in the preterm infant: Pathology and mechanisms. Acta Neuropathologica, 134(3), 331–349. 10.1007/s00401-017-1718-6 [DOI] [PMC free article] [PubMed] [Google Scholar]
- Barral JK, Gudmundson E, Stikov N, Etezadi-Amoli M, Stoica P, & Nishimura DG (2010). A robust methodology for in vivo T1 mapping. Magnetic Resonance in Medicine. 10.1002/mrm.22497 [DOI] [PMC free article] [PubMed] [Google Scholar]
- Basser PJ, & Pierpaoli C (1996). Microstructural and physiological features of tissues elucidated by quantitative-diffusion-tensor MRI. Journal of Magnetic Resonance - Series B, 111(3), 209–219. 10.1006/jmrb.1996.0086 [DOI] [PubMed] [Google Scholar]
- Beaulieu C, Plewes C, Paulson LA, Roy D, Snook L, Concha L, & Phillips L (2005). Imaging brain connectivity in children with diverse reading ability. NeuroImage, 25(4), 1266–1271. 10.1016/j.neuroimage.2004.12.053 [DOI] [PubMed] [Google Scholar]
- Beaulieu C, Yip E, Low PB, Mädler B, Lebel CA, Siegel L, Mackay AL, & Laule C (2020). Myelin Water Imaging Demonstrates Lower Brain Myelination in Children and Adolescents With Poor Reading Ability. Frontiers in Human Neuroscience, 14, 568395. 10.3389/fnhum.2020.568395 [DOI] [PMC free article] [PubMed] [Google Scholar]
- Benjamini Y, & Hochberg Y (1995). Controlling the False Discovery Rate: A Practical and Powerful Approach to Multiple Testing. Journal of the Royal Statistical Society. Series B (Methodological), 57(1), 289–300. JSTOR. [Google Scholar]
- Berman S, West KL, Does MD, Yeatman JD, & Mezer AA (2017). Evaluating g-ratio weighted changes in the corpus callosum as a function of age and sex. NeuroImage. 10.1016/j.neuroimage.2017.06.076 [DOI] [PMC free article] [PubMed] [Google Scholar]
- Berninger VW (1986). Normal Variation in Reading Acquisition. Perceptual and Motor Skills, 62(3), 691–716. 10.2466/pms.1986.62.3.691 [DOI] [Google Scholar]
- Bruckert L, Borchers LR, Dodson CK, Marchman VA, Travis KE, Ben-Shachar M, & Feldman HM (2019). White Matter Plasticity in Reading-Related Pathways Differs in Children Born Preterm and at Term: A Longitudinal Analysis. Frontiers in Human Neuroscience, 13, 139. 10.3389/fnhum.2019.00139 [DOI] [PMC free article] [PubMed] [Google Scholar]
- Bruckert L, Travis KE, Mezer AA, Ben-Shachar M, & Feldman HM (2020). Associations of Reading Efficiency with White Matter Properties of the Cerebellar Peduncles in Children. Cerebellum (London, England), 19(6), 771–777. 10.1007/s12311-020-01162-2 [DOI] [PMC free article] [PubMed] [Google Scholar]
- Buckingham J, Wheldall K, & Beaman-Wheldall R (2013). Why poor children are more likely to become poor readers: The school years. Australian Journal of Education, 57(3), 190–213. 10.1177/0004944113495500 [DOI] [Google Scholar]
- Casey BJ, Tottenham N, Liston C, & Durston S (2005). Imaging the developing brain: What have we learned about cognitive development? Trends in Cognitive Sciences, 9(3), 104–110. 10.1016/j.tics.2005.01.011 [DOI] [PubMed] [Google Scholar]
- Catani M, Allin MPG, Husain M, Pugliese L, Mesulam MM, Murray RM, & Jones DK (2007). Symmetries in human brain language pathways correlate with verbal recall. Proceedings of the National Academy of Sciences of the United States of America, 104(43), 17163–17168. 10.1073/pnas.0702116104 [DOI] [PMC free article] [PubMed] [Google Scholar]
- Chang LC, Cheng GK, Basser PJ, & Pierpaoli C (2008). Linear least-squares method for unbiased estimation of T1 from SPGR signals. Magnetic Resonance in Medicine. 10.1002/mrm.21669 [DOI] [PMC free article] [PubMed] [Google Scholar]
- Chang LC, Jones DK, & Pierpaoli C (2005). RESTORE: Robust estimation of tensors by outlier rejection. Magnetic Resonance in Medicine, 53(5), 1088–1095. 10.1002/mrm.20426 [DOI] [PubMed] [Google Scholar]
- Deutsch GK, Dougherty RF, Bammer R, Siok WT, Gabrieli JDE, & Wandell B (2005). Children’s reading performance is correlated with white matter structure measured by diffusion tensor imaging. Cortex; a Journal Devoted to the Study of the Nervous System and Behavior, 41(3), 354–363. 10.1016/s0010-9452(08)70272-7 [DOI] [PubMed] [Google Scholar]
- Dick F, Tierney AT, Lutti A, Josephs O, Sereno MI, & Weiskopf N (2012). In Vivo Functional and Myeloarchitectonic Mapping of Human Primary Auditory Areas. Journal of Neuroscience, 32(46), 16095–16105. 10.1523/JNEUROSCI.1712-12.2012 [DOI] [PMC free article] [PubMed] [Google Scholar]
- Dodson CK, Travis KE, Borchers LR, Marchman VA, Ben-Shachar M, & Feldman HM (2018a). White matter properties associated with pre-reading skills in 6-year-old children born preterm and at term. Developmental Medicine and Child Neurology, 60(7), 695–702. 10.1111/dmcn.13783 [DOI] [PMC free article] [PubMed] [Google Scholar]
- Dodson CK, Travis KE, Borchers LR, Marchman VA, Ben-Shachar M, & Feldman HM (2018b). White matter properties associated with pre-reading skills in 6-year-old children born preterm and at term. Developmental Medicine and Child Neurology, 60(7), 695–702. 10.1111/dmcn.13783 [DOI] [PMC free article] [PubMed] [Google Scholar]
- Dougherty RF, Ben-Shachar M, Deutsch GK, Hernandez A, Fox GR, & Wandell BA (2007). Temporal-callosal pathway diffusivity predicts phonological skills in children. Proceedings of the National Academy of Sciences, 104(20), 8556–8561. 10.1073/pnas.0608961104 [DOI] [PMC free article] [PubMed] [Google Scholar]
- Duffau H (2015a). Stimulation mapping of white matter tracts to study brain functional connectivity. Nature Reviews. Neurology, 11(5), 255–265. 10.1038/nrneurol.2015.51 [DOI] [PubMed] [Google Scholar]
- Duffau H (2015b). Stimulation mapping of white matter tracts to study brain functional connectivity. Nature Reviews. Neurology, 11(5), 255–265. 10.1038/nrneurol.2015.51 [DOI] [PubMed] [Google Scholar]
- Economou M, Billiet T, Wouters J, Ghesquière P, Vanderauwera J, & Vandermosten M (2021). Myelin Water Fraction in Relation To Fractional Anisotropy and Reading in 10-Year-Old Children [Preprint]. In Review. 10.21203/rs.3.rs-1123584/v1 [DOI] [PubMed] [Google Scholar]
- Eikenes L, Løhaugen GC, Brubakk A-M, Skranes J, & Håberg AK (2011). Young adults born preterm with very low birth weight demonstrate widespread white matter alterations on brain DTI. NeuroImage, 54(3), 1774–1785. 10.1016/j.neuroimage.2010.10.037 [DOI] [PubMed] [Google Scholar]
- Field A (2013). Discovering Statistics Using IBM SPSS Statistics, 4th Edition (4th edition). SAGE Publications Ltd. [Google Scholar]
- Fram EK, Herfkens RJ, Johnson GA, Glover GH, Karis JP, Shimakawa A, Perkins TG, & Pelc NJ (1987). Rapid calculation of T1 using variable flip angle gradient refocused imaging. Magnetic Resonance Imaging. 10.1016/0730-725X(87)90021-X [DOI] [PubMed] [Google Scholar]
- Frye RE, Liederman J, Hasan KM, Lincoln A, Malmberg B, McLean J, & Papanicolaou A (2011). Diffusion tensor quantification of the relations between microstructural and macrostructural indices of white matter and reading. Hum Brain Mapp, 32(8), 1220–1235. 10.1002/hbm.21103 [DOI] [PMC free article] [PubMed] [Google Scholar]
- Geeraert BL, Chamberland M, Lebel RM, & Lebel C (2020). Multimodal principal component analysis to identify major features of white matter structure and links to reading. PloS One, 15(8), e0233244. 10.1371/journal.pone.0233244 [DOI] [PMC free article] [PubMed] [Google Scholar]
- Groeschel S, Tournier J-D, Northam GB, Baldeweg T, Wyatt J, Vollmer B, & Connelly A (2014). Identification and interpretation of microstructural abnormalities in motor pathways in adolescents born preterm. NeuroImage, 87, 209–219. [DOI] [PubMed] [Google Scholar]
- Gullick MM, & Booth JR (2014). Individual differences in crossmodal brain activity predict arcuate fasciculus connectivity in developing readers. Journal of Cognitive Neuroscience, 26(7), 1331–1346. 10.1162/jocn_a_00581 [DOI] [PMC free article] [PubMed] [Google Scholar]
- Gullick MM, & Booth JR (2015). The direct segment of the arcuate fasciculus is predictive of longitudinal reading change. Developmental Cognitive Neuroscience, 13, 68–74. 10.1016/j.dcn.2015.05.002 [DOI] [PMC free article] [PubMed] [Google Scholar]
- Hagiwara A, Kamagata K, Shimoji K, Yokoyama K, Andica C, Hori M, Fujita S, Maekawa T, Irie R, Akashi T, Wada A, Suzuki M, Abe O, Hattori N, & Aoki S (2019). White Matter Abnormalities in Multiple Sclerosis Evaluated by Quantitative Synthetic MRI, Diffusion Tensor Imaging, and Neurite Orientation Dispersion and Density Imaging. American Journal of Neuroradiology, 40(10), 1642–1648. 10.3174/ajnr.A6209 [DOI] [PMC free article] [PubMed] [Google Scholar]
- Hart B, & Risley TR (1995). Meaningful differences in the everyday experience of young American children. Paul H Brookes Publishing. [Google Scholar]
- Herbet G, Zemmoura I, & Duffau H (2018a). Functional Anatomy of the Inferior Longitudinal Fasciculus: From Historical Reports to Current Hypotheses. Frontiers in Neuroanatomy, 12, 77. 10.3389/fnana.2018.00077 [DOI] [PMC free article] [PubMed] [Google Scholar]
- Herbet G, Zemmoura I, & Duffau H (2018b). Functional Anatomy of the Inferior Longitudinal Fasciculus: From Historical Reports to Current Hypotheses. Frontiers in Neuroanatomy, 12, 77. 10.3389/fnana.2018.00077 [DOI] [PMC free article] [PubMed] [Google Scholar]
- Hickok G, & Poeppel D (2007). The cortical organization of speech processing. Nature Reviews Neuroscience, 8(5), 393–402. [DOI] [PubMed] [Google Scholar]
- Hollingshead A (1975). Four Factor Index of Social Status. Yale University Department of Psychology. [Google Scholar]
- Huber E, Donnelly PM, Rokem A, & Yeatman JD (2018). Rapid and widespread white matter plasticity during an intensive reading intervention. Nature Communications, 9(1), 2260. 10.1038/s41467-018-04627-5 [DOI] [PMC free article] [PubMed] [Google Scholar]
- Huber E, Mezer A, & Yeatman JD (2021). Neurobiological underpinnings of rapid white matter plasticity during intensive reading instruction. NeuroImage, 243, 118453. 10.1016/j.neuroimage.2021.118453 [DOI] [PMC free article] [PubMed] [Google Scholar]
- Jones DK, Knösche TR, & Turner R (2013). White matter integrity, fiber count, and other fallacies: The do’s and don’ts of diffusion MRI. NeuroImage, 73, 239–254. 10.1016/j.neuroimage.2012.06.081 [DOI] [PubMed] [Google Scholar]
- Kovachy VN, Adams JN, Tamaresis JS, & Feldman HM (2015). Reading abilities in school-aged preterm children: A review and meta-analysis. Developmental Medicine and Child Neurology, 57(5), 410–419. 10.1111/dmcn.12652 [DOI] [PMC free article] [PubMed] [Google Scholar]
- Krafnick AJ, & Evans TM (2019). Neurobiological Sex Differences in Developmental Dyslexia. Frontiers in Psychology, 9. https://www.frontiersin.org/article/10.3389/fpsyg.2018.02669 [DOI] [PMC free article] [PubMed] [Google Scholar]
- Kraft I, Schreiber J, Cafiero R, Metere R, Schaadt G, Brauer J, Neef NE, Müller B, Kirsten H, Wilcke A, Boltze J, Friederici AD, & Skeide MA (2016). Predicting early signs of dyslexia at a preliterate age by combining behavioral assessment with structural MRI. NeuroImage, 143, 378–386. 10.1016/j.neuroimage.2016.09.004 [DOI] [PubMed] [Google Scholar]
- Langer N, Peysakhovich B, Zuk J, Drottar M, Sliva DD, Smith S, Becker BL, Grant PE, & Gaab N (2017). White Matter Alterations in Infants at Risk for Developmental Dyslexia. Cereb Cortex, 27(2), 1027–1036. 10.1093/cercor/bhv281 [DOI] [PMC free article] [PubMed] [Google Scholar]
- Lebel C, & Beaulieu C (2009). Lateralization of the arcuate fasciculus from childhood to adulthood and its relation to cognitive abilities in children. Human Brain Mapping, 30(11), 3563–3573. 10.1002/hbm.20779 [DOI] [PMC free article] [PubMed] [Google Scholar]
- Lebel C, Benischek A, Geeraert B, Holahan J, Shaywitz S, Bakhshi K, & Shaywitz B (2019). Developmental trajectories of white matter structure in children with and without reading impairments. Developmental Cognitive Neuroscience, 36, 100633. 10.1016/j.dcn.2019.100633 [DOI] [PMC free article] [PubMed] [Google Scholar]
- Lebel C, Shaywitz B, Holahan J, Shaywitz S, Marchione K, & Beaulieu C (2013). Diffusion tensor imaging correlates of reading ability in dysfluent and non-impaired readers. Brain and Language, 125(2), 215–222. 10.1016/j.bandl.2012.10.009 [DOI] [PubMed] [Google Scholar]
- Leemans A, & Jones DK (2009). The B-matrix must be rotated when correcting for subject motion in DTI data. Magnetic Resonance in Medicine, 61(6), 1336–1349. 10.1002/mrm.21890 [DOI] [PubMed] [Google Scholar]
- Li K, Sun Z, Han Y, Gao L, Yuan L, & Zeng D (2015). Fractional anisotropy alterations in individuals born preterm: A diffusion tensor imaging meta-analysis. Developmental Medicine & Child Neurology, 57(4), 328–338. 10.1111/dmcn.12618 [DOI] [PubMed] [Google Scholar]
- Lubsen J, Vohr B, Myers E, Hampson M, Lacadie C, Schneider KC, Katz KH, Constable RT, & Ment LR (2011). Microstructural and Functional Connectivity in the Developing Preterm Brain. Seminars in Perinatology, 35(1), 34–43. 10.1053/j.semperi.2010.10.006 [DOI] [PMC free article] [PubMed] [Google Scholar]
- Mancini M, Karakuzu A, Cohen-Adad J, Cercignani M, Nichols TE, & Stikov N (2020). An interactive meta-analysis of MRI biomarkers of myelin. ELife, 9, e61523. 10.7554/eLife.61523 [DOI] [PMC free article] [PubMed] [Google Scholar]
- Meisler SL, & Gabrieli JDE (2022). A large-scale investigation of white matter microstructural associations with reading ability. NeuroImage, 249, 118909. 10.1016/j.neuroimage.2022.118909 [DOI] [PMC free article] [PubMed] [Google Scholar]
- Mezer A, Rokem A, Berman S, Hastie T, & Wandell BA (2016a). Evaluating quantitative proton-density-mapping methods. Human Brain Mapping. 10.1002/hbm.23264 [DOI] [PMC free article] [PubMed] [Google Scholar]
- Mezer A, Rokem A, Berman S, Hastie T, & Wandell BA (2016b). Evaluating quantitative proton-density-mapping methods. Human Brain Mapping. 10.1002/hbm.23264 [DOI] [PMC free article] [PubMed] [Google Scholar]
- Mezer A, Yeatman JD, Stikov N, Kay KN, Cho N, Dougherty RF, Perry ML, Parvizi J, Hua LH, Butts-Pauly K, & Wandell B (2013a). Quantifying the local tissue volume and composition in individual brains with MRI. Nature Medicine, 19(12), 1667–1672. 10.1038/nm.3390 [DOI] [PMC free article] [PubMed] [Google Scholar]
- Mezer A, Yeatman JD, Stikov N, Kay KN, Cho NJ, Dougherty RF, Perry ML, Parvizi J, Hua LH, Butts-Pauly K, & Wandell BA (2013b). Quantifying the local tissue volume and composition in individual brains with magnetic resonance imaging. Nature Medicine, 19(12), 1667–1672. 10.1038/nm.3390 [DOI] [PMC free article] [PubMed] [Google Scholar]
- Miller DJ, Duka T, Stimpson CD, Schapiro SJ, Baze WB, McArthur MJ, Fobbs AJ, Sousa AMM, Sestan N, Wildman DE, Lipovich L, Kuzawa CW, Hof PR, & Sherwood CC (2012). Prolonged myelination in human neocortical evolution. Proceedings of the National Academy of Sciences of the United States of America, 109(41), 16480–16485. 10.1073/pnas.1117943109 [DOI] [PMC free article] [PubMed] [Google Scholar]
- Mishra A, Anderson AW, Wu X, Gore JC, & Ding Z (2010). An improved Bayesian tensor regularization and sampling algorithm to track neuronal fiber pathways in the language circuit. Medical Physics, 37(8), 4274–4287. 10.1118/1.3456113 [DOI] [PMC free article] [PubMed] [Google Scholar]
- Mullen KM, Vohr BR, Katz KH, Schneider KC, Lacadie C, Hampson M, Makuch RW, Reiss AL, Constable RT, & Ment LR (2011). Preterm birth results in alterations in neural connectivity at age 16 years. Neuroimage, 54(4), 2563–2570. 10.1016/j.neuroimage.2010.11.019 [DOI] [PMC free article] [PubMed] [Google Scholar]
- Myers CA, Vandermosten M, Farris EA, Hancock R, Gimenez P, Black JM, Casto B, Drahos M, Tumber M, Hendren RL, Hulme C, & Hoeft F (2014). White matter morphometric changes uniquely predict children’s reading acquisition. Psychological Science, 25(10), 1870–1883. 10.1177/0956797614544511 [DOI] [PMC free article] [PubMed] [Google Scholar]
- Nagy Z, Westerberg H, & Klingberg T (2004). Maturation of White Matter is Associated with the Development of Cognitive Functions during Childhood. Journal of Cognitive Neuroscience, 16(7), 1227–1233. 10.1162/0898929041920441 [DOI] [PubMed] [Google Scholar]
- Nichols TE, & Holmes AP (2002). Nonparametric permutation tests for functional neuroimaging: A primer with examples. Human Brain Mapping, 15(1), 1–25. 10.1002/hbm.1058 [DOI] [PMC free article] [PubMed] [Google Scholar]
- Odegard TN, Farris EA, Ring J, McColl R, & Black J (2009). Brain connectivity in non-reading impaired children and children diagnosed with developmental dyslexia. Neuropsychologia, 47(8–9), 1972–1977. 10.1016/j.neuropsychologia.2009.03.009 [DOI] [PubMed] [Google Scholar]
- O’Muircheartaigh J, Vavasour I, Ljungberg E, Li DKB, Rauscher A, Levesque V, Garren H, Clayton D, Tam R, Traboulsee A, & Kolind S (2019). Quantitative neuroimaging measures of myelin in the healthy brain and in multiple sclerosis. Human Brain Mapping, 40(7), 2104–2116. 10.1002/hbm.24510 [DOI] [PMC free article] [PubMed] [Google Scholar]
- Oouchi H, Yamada K, Sakai K, Kizu O, Kubota T, Ito H, & Nishimura T (2007). Diffusion anisotropy measurement of brain white matter is affected by voxel size: Underestimation occurs in areas with crossing fibers. American Journal of Neuroradiology, 28(6), 1102–1106. 10.3174/ajnr.A0488 [DOI] [PMC free article] [PubMed] [Google Scholar]
- Ozernov-Palchik O, Norton ES, Sideridis G, Beach SD, Wolf M, Gabrieli JDE, & Gaab N (2017). Longitudinal stability of pre-reading skill profiles of kindergarten children: Implications for early screening and theories of reading. Developmental Science, 20(5). 10.1111/desc.12471 [DOI] [PMC free article] [PubMed] [Google Scholar]
- Ozernov-Palchik O, Norton ES, Wang Y, Beach SD, Zuk J, Wolf M, Gabrieli JDE, & Gaab N (2019). The relationship between socioeconomic status and white matter microstructure in pre-reading children: A longitudinal investigation. Human Brain Mapping, 40(3), 741–754. 10.1002/hbm.24407 [DOI] [PMC free article] [PubMed] [Google Scholar]
- Parker JD, Schoendorf KC, & Kiely JL (1994). Associations between measures of socioeconomic status and low birth weight, small for gestational age, and premature delivery in the United States. Annals of Epidemiology, 4(4), 271–278. 10.1016/1047-2797(94)90082-5 [DOI] [PubMed] [Google Scholar]
- Peelen MJCS, Kazemier BM, Ravelli ACJ, De Groot CJM, Van Der Post JAM, Mol BWJ, Hajenius PJ, & Kok M (2016). Impact of fetal gender on the risk of preterm birth, a national cohort study. Acta Obstetricia et Gynecologica Scandinavica, 95(9), 1034–1041. 10.1111/aogs.12929 [DOI] [PubMed] [Google Scholar]
- Pierpaoli C, & Basser PJ (1996). Toward a quantitative assessment of diffusion anisotropy. Magnetic Resonance in Medicine, 36(6), 893–906. 10.1002/mrm.1910360612 [DOI] [PubMed] [Google Scholar]
- Reese TG, Heid O, Weisskoff RM, & Wedeen VJ (2003). Reduction of eddy-current-induced distortion in diffusion MRI using a twice-refocused spin echo. Magnetic Resonance in Medicine, 49(1), 177–182. 10.1002/mrm.10308 [DOI] [PubMed] [Google Scholar]
- Rohde GK, Barnett AS, Basser PJ, Marenco S, & Pierpaoli C (2004). Comprehensive Approach for Correction of Motion and Distortion in Diffusion-Weighted MRI. Magnetic Resonance in Medicine. 10.1002/mrm.10677 [DOI] [PubMed] [Google Scholar]
- Saur D, Kreher BW, Schnell S, Kümmerer D, Kellmeyer P, Vry M-S, Umarova R, Musso M, Glauche V, Abel S, Huber W, Rijntjes M, Hennig J, & Weiller C (2008). Ventral and dorsal pathways for language. Proceedings of the National Academy of Sciences of the United States of America, 105(46), 18035–18040. 10.1073/pnas.0805234105 [DOI] [PMC free article] [PubMed] [Google Scholar]
- Schmierer K, Scaravilli F, Altmann DR, Barker GJ, & Miller DH (2004). Magnetization transfer ratio and myelin in postmortem multiple sclerosis brain. Annals of Neurology, 56(3), 407–415. 10.1002/ana.20202 [DOI] [PubMed] [Google Scholar]
- Sirin SR (2005). Socioeconomic Status and Academic Achievement: A Meta-Analytic Review of Research. Review of Educational Research, 75(3), 417–453. 10.3102/00346543075003417 [DOI] [Google Scholar]
- Snowling MJ, Muter V, & Carroll J (2007). Children at family risk of dyslexia: A follow-up in early adolescence. Journal of Child Psychology and Psychiatry, 48(6), 609–618. [DOI] [PubMed] [Google Scholar]
- Stüber C, Morawski M, Schäfer A, Labadie C, Wähnert M, Leuze C, Streicher M, Barapatre N, Reimann K, Geyer S, Spemann D, & Turner R (2014a). Myelin and iron concentration in the human brain: A quantitative study of MRI contrast. NeuroImage, 93 Pt 1, 95–106. 10.1016/j.neuroimage.2014.02.026 [DOI] [PubMed] [Google Scholar]
- Stüber C, Morawski M, Schäfer A, Labadie C, Wähnert M, Leuze C, Streicher M, Barapatre N, Reimann K, Geyer S, Spemann D, & Turner R (2014b). Myelin and iron concentration in the human brain: A quantitative study of MRI contrast. NeuroImage, 93 Pt 1, 95–106. 10.1016/j.neuroimage.2014.02.026 [DOI] [PubMed] [Google Scholar]
- Toga AW, Thompson PM, & Sowell ER (2006). Mapping Brain Maturation. FOCUS, 4(3), 378–390. 10.1176/foc.4.3.378 [DOI] [PMC free article] [PubMed] [Google Scholar]
- Tournier JD, Calamante F, & Connelly A (2012). MRtrix: Diffusion tractography in crossing fiber regions. International Journal of Imaging Systems and Technology. 10.1002/ima.22005 [DOI] [Google Scholar]
- Travis KE, Adams JN, Ben-Shachar M, & Feldman HM (2015). Decreased and Increased Anisotropy along Major Cerebral White Matter Tracts in Preterm Children and Adolescents. PLoS One, 10(11), e0142860. 10.1371/journal.pone.0142860 [DOI] [PMC free article] [PubMed] [Google Scholar]
- Travis KE, Ben-Shachar M, Myall NJ, & Feldman HM (2016). Variations in the neurobiology of reading in children and adolescents born full term and preterm. Neuroimage Clin, 11, 555–565. 10.1016/j.nicl.2016.04.003 [DOI] [PMC free article] [PubMed] [Google Scholar]
- Travis KE, Leitner Y, Feldman HM, & Ben-Shachar M (2015). Cerebellar white matter pathways are associated with reading skills in children and adolescents. Hum Brain Mapp, 36(4), 1536–1553. 10.1002/hbm.22721 [DOI] [PMC free article] [PubMed] [Google Scholar]
- Vanderauwera J, De Vos A, Forkel SJ, Catani M, Wouters J, Vandermosten M, & Ghesquière P (2018). Neural organization of ventral white matter tracts parallels the initial steps of reading development: A DTI tractography study. Brain and Language, 183, 32–40. 10.1016/j.bandl.2018.05.007 [DOI] [PubMed] [Google Scholar]
- Vanderauwera J, van Setten ERH, Maurits NM, & Maassen BAM (2019). The interplay of socio-economic status represented by paternal educational level, white matter structure and reading. PloS One, 14(5), e0215560. 10.1371/journal.pone.0215560 [DOI] [PMC free article] [PubMed] [Google Scholar]
- Vanderauwera J, Wouters J, Vandermosten M, & Ghesquière P (2017). Early dynamics of white matter deficits in children developing dyslexia. Developmental Cognitive Neuroscience, 27, 69–77. 10.1016/j.dcn.2017.08.003 [DOI] [PMC free article] [PubMed] [Google Scholar]
- Vandermosten M, Boets B, Poelmans H, Sunaert S, Wouters J, & Ghesquière P (2012). A tractography study in dyslexia: Neuroanatomic correlates of orthographic, phonological and speech processing. Brain, 135(3), 935–948. 10.1093/brain/awr363 [DOI] [PubMed] [Google Scholar]
- Vandermosten M, Boets B, Wouters J, & Ghesquière P (2012a). A qualitative and quantitative review of diffusion tensor imaging studies in reading and dyslexia. Neuroscience and Biobehavioral Reviews, 36(6), 1532–1552. 10.1016/j.neubiorev.2012.04.002 [DOI] [PubMed] [Google Scholar]
- Vandermosten M, Boets B, Wouters J, & Ghesquière P (2012b). A qualitative and quantitative review of diffusion tensor imaging studies in reading and dyslexia. Neuroscience and Biobehavioral Reviews, 36(6), 1532–1552. 10.1016/j.neubiorev.2012.04.002 [DOI] [PubMed] [Google Scholar]
- Vandermosten M, Vanderauwera J, Theys C, De Vos A, Vanvooren S, Sunaert S, Wouters J, & Ghesquière P (2015). A DTI tractography study in pre-readers at risk for dyslexia. Developmental Cognitive Neuroscience, 14, 8–15. 10.1016/j.dcn.2015.05.006 [DOI] [PMC free article] [PubMed] [Google Scholar]
- Volpe JJ (2009). Brain injury in premature infants: A complex amalgam of destructive and developmental disturbances. The Lancet Neurology, 8(1), 110–124. [DOI] [PMC free article] [PubMed] [Google Scholar]
- Wandell BA, & Yeatman JD (2013). Biological development of reading circuits. Current Opinion in Neurobiology, 23(2), 261–268. [DOI] [PMC free article] [PubMed] [Google Scholar]
- Wang NY-H, Wang H-LS, Liu Y-C, Chang Y-PE, & Weng J-C (2021). Investigating the white matter correlates of reading performance: Evidence from Chinese children with reading difficulties. PloS One, 16(3), e0248434. 10.1371/journal.pone.0248434 [DOI] [PMC free article] [PubMed] [Google Scholar]
- Wang Y, Mauer MV, Raney T, Peysakhovich B, Becker BLC, Sliva DD, & Gaab N (2017). Development of Tract-Specific White Matter Pathways During Early Reading Development in At-Risk Children and Typical Controls. Cerebral Cortex (New York, N.Y.: 1991), 27(4), 2469–2485. 10.1093/cercor/bhw095 [DOI] [PMC free article] [PubMed] [Google Scholar]
- Wiederholt JL, & Bryant BR (2012). Gray oral reading tests—Fifth edition (GORT-5). Austin, TX: Pro-Ed. [Google Scholar]
- Yeatman JD, Dougherty RF, Ben-Shachar M, & Wandell BA (2012). Development of white matter and reading skills. Proc Natl Acad Sci U S A, 109(44), E3045–53. 10.1073/pnas.1206792109 [DOI] [PMC free article] [PubMed] [Google Scholar]
- Yeatman JD, Dougherty RF, Myall NJ, Wandell BA, & Feldman HM (2012). Tract Profiles of White Matter Properties: Automating Fiber-Tract Quantification. PLoS ONE, 7(11), e49790. 10.1371/journal.pone.0049790 [DOI] [PMC free article] [PubMed] [Google Scholar]
- Yeatman JD, Dougherty RF, Rykhlevskaia E, Sherbondy AJ, Deutsch GK, Wandell BA, & Ben-Shachar M (2011). Anatomical properties of the arcuate fasciculus predict phonological and reading skills in children. Journal of Cognitive Neuroscience, 23(11), 3304–3317. [DOI] [PMC free article] [PubMed] [Google Scholar]
- Yeatman JD, Wandell BA, & Mezer AA (2014). Lifespan maturation and degeneration of human brain white matter. Nature Communications, 5, 4932. 10.1038/ncomms5932 [DOI] [PMC free article] [PubMed] [Google Scholar]
Associated Data
This section collects any data citations, data availability statements, or supplementary materials included in this article.