

Abstract
Over the past few decades, health care industries and medical practitioners faced a lot of obstacles to diagnosing medical-related problems due to inadequate technology and availability of equipment. In the present era, computer science technologies such as IoT, Cloud Computing, Artificial Intelligence and its allied techniques, etc. play a crucial role in the identification of medical diseases, especially in the domain of Ophthalmology. Despite this, ophthalmologists have to perform the various disease diagnosis task manually which is time-consuming and the chances of error are also very high because some of the abnormalities of eye diseases possess the same symptoms. Furthermore, multiple autonomous systems also exist to categorize the diseases but their prediction rate does not accomplish state-of-art accuracy. In the proposed approach by implementing the concept of Attention, Transfer Learning with the Deep Convolution Neural Network, the model accomplished an accuracy of 97.79% and 95.6% on the training and testing data respectively. This autonomous model efficiently classifies the various oscular disorders namely Choroidal Neovascularization, Diabetic Macular Edema, Drusen from the Optical Coherence Tomography images. It may provide a realistic solution to the healthcare sector to bring down the ophthalmologist burden in the screening of Diabetic Retinopathy.
Keywords: Diabetic retinopathy, Convolutional neural network, Transfer learning, Optical coherence tomography, Eye disease, Deep learning (DL), Ophthalmology, Artificial intelligence
Introduction
Visual impairment is increasing manifolds and is likely to reach an epidemic rise globally in the next few decades. Some of the hazardous diseases which are the main reason for visual impairment and sight loss in human beings are Diabetic Retinopathy (DR), Age-related Macular Degeneration (AMD), Diabetic Macular Edema (DME), Choroidal Neovascularization (CNV), Glaucoma, Cataract, Myopia, Astigmatism, etc., and many more to name [1–4]. Amongst them, some diseases such as CNV, DME, etc. are the severe form of AMD and DR which are life-threatening ones [5, 6]. These diseases are growing exponentially and majorly impact the elderly group and working professionals. This etiology of DR is because of high blood sugar which leads to damage to retina blood vessels [7]. In addition to it, the working style of individuals is also one of the reasons for visual impairment in the populace. In the present scenario, a major segment of the society is working from home due to the Covid pandemic using various electronic gadgets and Internet-based facilities. The intensive utilization of these types of equipment causes eye abnormalities in human beings. Furthermore, human genes and environmental factors are also responsible for oscular disorders [8]. As per the International Diabetes Federation (IDF) Atlas 2020 [9], the estimated number of adults suffering from DR was 103.12 million, Vision-Threatening DR (VTDR) 28.54 million, and Clinically Significant Macular Edema (CSME) 18.83 million respectively. These figures might rise to 160.50 million for the DR, 44.82 million VTDR, and 28.61 million CSME across the globe by 2045 [9]. Besides this, a survey has also been conducted by the World Health Organization (WHO) stating that, from a total of 7.8 billion, 2.2 billion people on the planet have some sort of visual impairment [10]. These are estimated numbers as either people are not aware of these disorders or do not visit eye care centers to get timely checkups due to financial crisis. As per the experts and researchers, 80–90% of cases in India [11] and 50% in other parts of the world [10] can be avoided by early detection. In addition to it, adequate treatment should also be imparted to get rid of such visual disorders to enhance the quality of life [12].
Medical imaging is another aspect that provides the most valuable aid to the detection of various diseases. Interpretation of these medical images requires the usage of the latest advancements in technology. Optical Coherence Tomography (OCT) [13], Fundus Fluorescein Angiography (FFA) image [14, 15], 2D Color Fundus Photography (CFP) [16, 17], B-Scan Images, and various other types of scans are used by the ophthalmologist to examine the disease [18, 19]. However, OCT imaging is a non-invasive, swift, and harmless technique that helps to provide better visualization of retinal vasculatures [20]. These scans are used at proliferating rate to erect the intelligent decision in medical diagnosis by the ophthalmologist, medical practitioners, researchers, optometrists, etc. Furthermore, Human–Computer Interaction (HCI) augmented with Artificial Intelligence (AI) helps in providing a potential solution to the healthcare industry by using OCT imaging and incorporating the capabilities of ML and DL. These automated technologies offer unparalleled diagnostic precision, screening ability, risk stratification, and workflow optimization with better accuracy and cost-effective screening in comparison to healthcare professionals [21]. Hence, the integration of AI in the field of ophthalmology provides an adequate economic solution to accomplish the goal of medical diagnosis. This autonomous system speeds up the medical process and brings down the ophthalmologist’s burden in the disease examination.
In this work, the concept of Transfer Learning (TL) with the Deep Convolution Neural Network (CNN) is implemented to classify eye diseases. TL helps in diminishing the model training time as weights of the pre-trained model are being used instead of creating a model from scratch [22]. This paper is further categorized into different sections. Background study including the related work that has been done so far in the field of ophthalmology mentioned in section “Background study”. Further in this section, various researcher views related to ophthalmology and the techniques used by them to analyze the impact of various eye disorder on human health has been summarized. Model formulation and dataset descriptions are mentioned in section “Proposed methodology”. This section further includes the architecture details and proposed algorithm in a detailed fashion. Various matrices are used for result evaluation such as precision, recall, accuracy, F1 score, etc. with confusion matrices [23] for models illustrated in section “Experimental results analysis”. This section further includes the graphical representation of the results of training and testing data. Finally, section “Conclusion and future scope” concludes the work and future pathways to deep dive into the study of various eye disorders in the field of ophthalmology.
Background study
In the last few decades, researchers have published numerous articles in the domain of ophthalmology. Researchers & medical practitioners are using the various AI and its allied techniques like machine learning and DL for creating the autonomous system to detect the oscular disorder for the medical disease prediction and treatment. Hence, the foremost concern of this section is to represent the researcher’s work in the domain of ophthalmology.
Kermany et al. [5] proposed an efficient diagnostic tool that used the power of a DL framework for the patient screening for the diagnosis of treatable retinal diseases. The proposed model was capable to classify the various eye disorder namely CNV, DME, and Drusen using OCT scans. The model utilizes the effectiveness of TL (ImageNet model weights were used to train the model). As a result, the authors conclude that the proposed model accomplished an accuracy of 94%. But the overall time required to train a model was four days and 300 epochs were done to reach the best one. In this article, finally, the researcher compared the human experts' results with the model predicted results and exhibited that the proposed model outperformed the human results. To perform the general applicability of the proposed AI system, pediatric pneumonia was further diagnosed on X-ray images of the human chest. Han et al. [24] represent a parametric optimization algorithm by using the concept of an SVM classifier of ML for the classification of DR. To extract the features from images, the classifier used the PCA and KPCA method which further increases the generalization of the algorithm and enhance the processing speed. In addition to it the enhancement of classification accuracy and to optimize the parameters, grid search and genetic algorithms are employed. Therefore, this combinatorial optimization algorithm attained 98.33% classification accuracy in just 31.13 s. But the dataset was quite small having only 120 images was the major drawback of the approach. Wan et al. [25] suggested an autonomous approach to identify the DR from fundus images. The model used the power of TL and hyperparameter tuning in the CNN approach for automatic detection of DR. Authors further adopt the different architectures such as VggNet(-s,-16,-19), AlexNet, Resnet, and GoogleNet, to elaborate the result obtained from models. VggNet-s with hyperparameter tuning outperform the result of other models and attained 95.68% classification accuracy. Further, the proposed model used highly unbalanced data which was the major issue in the system.
Jena et al. [26] used fundus images in a DL-based convolutional network approach to classifying DR. The proposed neural network model has only six layers of convolutional including the Rectified linear unit (ReLU) and max-pooling layer. Due to the absence of a fully connected layer, a model was trained faster and the computational complexity of the model was also reduced as the main importance of the model. Finally, the model was compared with some existing models like quadratic SVM, Naïve Bayes, KNN, etc. The suggested model accomplished 91.66% accuracy which was far better than the existing ones. But the dataset used for the training and testing was not larger enough and also it was not complex to get the generalized model. Rehman et al. [27] used the SqueezeNet CNN, AlexNet and VGG-16 pre-trained methods for automatic classification of DR achieved the 93.46%, 91.82%, and 94.49% classification accuracy. Further, the authors proposed an automated customized tool to detect DR. The proposed neural network model has only five layers, out of which two layers of convolutional and the remaining three were fully connected. The proposed model accomplished 98.15% classification accuracy but the dataset used for the proposed model contains only 1200 images which was the concerned area of the approach. Murcia et al. [28] presented a diagnostic tool powered by the performant DL frameworks to grade the damage to the retina caused by diabetes mellitus. The tool makes use of a deep residual CNN to boost picture quality or individual eye structures. The authors utilized multiple convolutional architectures to assess their performance under the MESSIDOR dataset. The tool was found to have outstanding results while using ResNet50 architecture being able to accurately identify grade 0 as well as aggregating grades 0 and 1, presenting an AUC of 0.93, 0.81, 0.92 for grades 0 + 1, grade 2, and grade 3 labeling respectively. The authors also made use of derived class activation maps to help detect lesions which improved the grading procedure. The results of the proposed system show its bright future in the clinical use of automatic DR. Chopra et al. [29] explained the major targets OCT hardware developments need to hit to make the OCT reach underprivileged corners of the world. First and foremost, the authors discuss the portability and cost barrier when it comes to OCT. The authors proposed handheld OCT devices that could increase the ease of access to the device. Secondly, to increase the automated testing and examination for the long term as current solutions need very frequent clinical visits in the long run which results in the need for larger staff availability. The availability of OCT at home could revolutionize the need and opportunities for individual treatment plans. The development in cloud computing to share the data could revolutionize the way current follow-ups and monitoring of the patient works.
Gangwar et al. [30] proposed a hybrid DL architecture for DR detection. The hybrid architecture was comprised of Inception-ResNet-v2 and a custom CNN block. Further, the architecture utilizes Inception net and residual connections of InceptionResNet and 4 CNN layers of varying filter sizes for better performance. As a result, the authors have come to the conclusion that the suggested architecture outperforms GoogleNet by 6.3% achieving an overall accuracy score of 72.33% on the Messidor-1 dataset [31] and an accuracy score of 82.18% on the APTOS dataset [32]. Medeiros et al. [33] illustrated an approach of DL by using the Spectral Domain OCT data. CNN was trained to access optic disc photographs and predict average Retinal Nerve Fiber Layer (RNFL) thickness. According to the results, the authors compared predictive and actual RFNL thickness and concluded that they showed a strong correlation and the observed 7.39 μm mean absolute error of prediction. Then to categorize glaucoma eyes from a normal one, an area under receiver operating characteristics (AUROC) were calculated from the proposed DL approach and found that this value was almost alike to the actual SD-OCT RFNL thickness value. The predicted value of AUROC was 0.944 and the actual was 0.940. Le et al. [34] employed CNN Architecture of DL and VGG16 for the detection of DR. For a strong OCTA classification, the authors used the dataset has three categories namely healthy, No-DR, and DR, to which they further applied the TL approach. To demonstrate the practicability of testing DR, CNN was included with the graphical user interface platform. The use of two small datasets was there one for training and cross-validation and the second one for external validation. The results of the proposed study conclude that the cross-validation accuracy achieved 87.27% with 83.76% sensitivity and 90.82% specificity. For the classification into the three categories of healthy, No-DR, and DR, the AUC matrix results achieved were 0.97, 0.98, and 0.97, respectively. Due to the GUI platform that was included with CNN, easy DR testing was possible which further boosted the efficiency of the model. Pallab Chowdhury et al. [35] in their paper focused on the complications and post effects of DR. DR is caused by diabetes complications and has severe effects like permanent blindness. Therefore, for the proper and timely diagnosis of DR, the authors of this paper proposed an efficient technique. The technique proposed in this work consists of a collection of five models with TL and the base model used by these models is EfficientNet-B5. Dataset was taken from Kaggle [36]. Further, the various steps like increasing generalization, cross-validation, pretraining, finetuning on the dataset, and reducing variance were employed on models. As a result, the authors attained 99.87% model accuracy and concluded that the model scores high as compared to the other ones for the prediction of DR.
An et al. [37] in their study proposed a DL framework for the structuring of a model. This proposed model detects and classifies disease with a small dataset. The framework proposed by the authors in this study uses the hierarchical classification method. In the hierarchical method, the information about the disease was given to the first model, and then that information was used for successive models for the classification with the use of the TL method. A small dataset was taken having healthy and glaucoma eyes were applied to the approach to reveal the effectiveness, and applicability, and to calculate the model performance. As a result, it was concluded that, on three random datasets, the average model accuracy and Cohen’s kappa were 0.839 and 0.809, respectively. Therefore, by the results, it has been observed that classification can be done with this proposed work effectively with small medical images. Kumar et al. [38] reviewed many articles on DR and concluded that DR requires proper attention for early identification so that loss of sight can be reduced to some extent. The authors of the paper discussed various techniques for DR detection and classification. Various methods discussed for detection were ANN, CNN, Computer-Based detection, Fuzzy C-Means (FCM) clustering, thresholding, etc. The authors also mentioned various performance parameters of each technique like accuracy, specificity, precision, recall, etc. Further, some more classification methods like the random forest technique, CNN, based on feature extracted, SVM, etc. were also discussed, and then concluded that all these methods for automatic detection and classification of DR help ophthalmologists to decrease their workload so that they can do they work efficiently. Further, they also highlighted that if the data is categorized by sex, age, and severity of disease then the DR detection can be achieved more efficiently. Samanta et al. [39] worked on a small dataset and introduces a TL-based CNN approach on the Dense-Net model which was pre-trained on ImageNet for recognizing DR classes from hard exudates, blood vessels, and texture. The model training was done in four categories of classes namely No-DR, Mild-DR, Moderate-DR, and Proliferative-DR. 419 fundus images were taken for validation. On the healthy eye, the F1 score achieved for the proposed model was 0.97 and the validation accuracy achieved was 84.10% respectively. Cohens Kappa’s score attained on a validation and training set was 0.8836 and 0.9809 respectively.
Albahli et al. [40] proposed an approach based on Recurrent CNN for the effective classification and detection of DR samples. The various steps that were followed in this study include pre-processing, annotations of the samples, feature extraction, and then applying the DenseNet-65. The Proposed architecture classifies the samples into five classes that were NO-DR, Mild-DR, Moderate-DR, Severe, and Prolific. As a result, they possessed that the proposed model accomplished 97.2% accuracy. Along with that, the authors of this study also performed cross dataset validation and concluded that the model proposed was effective to classify the DR samples on the unknown dataset. Pao et al. [41] represent a CNN-based approach for the detection of DR. Fundus images dataset had been taken from the publically available dataset available on Kaggle [36]. The images that are taken from this dataset had been graded then into five classes. Further, data augmentation techniques were applied to these images. In addition to it, from the RGB color model, the green component had been extracted for the computation of the entropy from these retinal images. Then for pre-processing step Unsharp Masking (UM) was applied. The DL based bi-channel CNN approach was proposed by the authors for efficient detection of DR. Authors of the study concluded that the bi-channel CNN gives good results and the accuracy achieved by the proposed model is 87.83% for the detection of DR. Salvi et al. [42] explained a study for early detection to classify the DR with the different DL methods of CNN. This model could classify DR into five stages: viz. Mild-DR, Moderate-DR, No-DR, Proliferate-DR, and Severe-DR. They use an open-source dataset of DR detection. This study used VGG16, ResNet50 V2, and Efficient-Net B0 with different factors to learn and showed the results of best performing CNN architectures by using different performance matrices like ACC, false-positive rate, true negative rate, etc. As per this study observed that VGG16 architecture achieved the highest accuracy of 95% than ResNet50 V2 which achieved the accuracy of 93%. This study also shows a complete performance comparison of three different CNN TL models to detect DR. Rajkumar et al. [43] illustrated a paper for detecting the various stages of DR with the TL approach of CNN. They use the Kaggle dataset for DR detection with 35,000 plus images with each size of 512 × 512 pixels. To implement this model used the ResNet-50 model of TL which is around 50 layers deep to get good accuracy from a large dataset. To classify the stages of DR they use five labels which were 0,1,2,3,4 represents the No-DR, Mild-DR, Moderate-DR, Proliferative-DR, and, Severe-DR respectively. As a result, the ResNet-50 model attained an accuracy of 89.4%. This paper completely presented the performance and accuracy of the ResNet-50 model of TL in CNN to detect DR.
Boral et al. [44] offer a study to detect and labeling of DR for reducing laborer-intensive work doctors with a hybrid neural network. For training of this dataset used the Kaggle database with a total of around 35,000 retinal images. Trained models give two results for test images which were YES for DR images and NO for the normal retinal images. To implement the study, two models were used. The first model was an Inception V3 DNN architecture and the second model was a multiclass SVM model. In the proposed study they first get the dataset and apply an Inception V3 DNN architecture and then activation function Inception DNN to get the feature dataset After that, this feature dataset is processed with a multiclass SVM model. With this study, they were able to achieve 98.8% accuracy and 97.7% sensitivity in DNN Model. This study provides a highly accurate DR detection model with Hybrid Neural Network. Bhowmik et al. [45] proposed a paper for the eye disease prediction for early-stage detection and reducing doctor manual work with the TL of CNN. They consider OCT as input for the model to predict the result. To train this model they use a dataset from Kaggle open-source dataset with 84,495 grayscale images but use around 4000 images. This trained model could predict four results that were: NORMAL, CNV, DME, and DRUSEN. In this study, they use VGG16 and Inception V3 model by utilizing the TL approach. This trained model was able to accomplish 94%accuracy on a small data set of around 4000 images. In this paper, they present a high accuracy model for detecting CNV, DME, and DRUSEN with a DL model. Shelar et al. [46] discussed the severe impact on human eyes by conducting a study on DR. The authors concluded that DR requires proper attention for timely identification so that it could be treated by doctors. Therefore, they proposed CNN with TL-based architecture for disease identification and classification with the help of fundal images of the retina. Binary classification had been done with the proposed architecture and attained accuracy for normal cases is 85% and for DR cases it was 84.12%. Paul et al. [4] presented a dialogue on the risk factors of DR. They proposed a CNN model for the identification of various DR disease stages. The model utilizes the proposed model combining it with advanced TinyML. The proposed network utilizes a very low amount of memory while showing 94% accuracy in the detection of DR. The authors concluded that the illustrated results were a clear indication of the fact that computer vision is a very useful tool in the diagnosis of diseases like DR with very high accuracy.
Lu et al. [47] in their study introduced a DL-based system for the categorization of OCT images automatically. For this purpose, the authors proposed ResNet, and to optimize the algorithm tenfold cross-validation method was implemented. Kappa value, Accuracy, and AUC were the various parameters that were taken to measure and evaluate the model performance. This system accomplished 95.89% accuracy and an AUC of 98.45 in finding the disease classification such as serous macular detachment, epiretinal membrane, macular hole, and cystoid macular edema. The system also achieved a kappa value of 92.9%. Finally, the authors concluded that this proposed system identifies and distinguishes various OCT images with great accuracy. Al-Moosawi and Khudeyer [14] proposed a new ResNet-34/DR architecture to identify and classify different stages of DR i.e. an eye disorder found in diabetic patients. The authors were able to implement data augmentation and image pre-processing to refine and improve the training dataset comprising of high-resolution color images of the fundus. Furthermore, the authors were successfully able to fine-tune the existing ResNet-34 network by training lower layers of the network using the transfer training technique to drastically improve the accuracy of the existing model while achieving an F1 accuracy score of 93.2%, thus achieving relatively advanced results in DR classifications.
Hasan et al. [48] represented an improved model for reliable cataract disease detection by modifying and finetuning various pre-trained models such as InceptionV3, InceptionResNetV2, Xception, and Densenet121 using the TensorFlow object detection framework. Authors aimed at the classification of cataract disease using CNNs based on publicly available image datasets [49]. While using the InceptionResNetV2 model, authors were able to attain the highest reliability with a 98.17% test accuracy, 97% sensitivity, and 100% specificity. Hence, refining the model have effectively produced a robust diagnostic tool directed at low-income countries with insufficient numbers of qualified ophthalmologist to effectively prevent and perform early diagnosis of the disease. Tariq et al. [15] explained a Deep-TL technique based on CNN for the classification of DR patients. The proposed model could reliably classify different stages of DR complications by implementing supervised training with the training dataset comprising high-resolution fundus images. Due to the limited images in the dataset, the authors used augmentation of images to artificially expand the dataset and further implemented pre-processing to the images to improve the quality of the dataset. It was found that fine tweaking various existing CNNs, TesNeXt-50 yielded maximum accuracy of 97.53% and presented as a reliable asset in assisting clinical judgments.
After analyzing the different researcher’s views and their proposed work it concludes that the oscular disorders are the topmost reason for sight loss in human beings and some of the diseases such as DR, CNV, etc. are life-threatening ones. Researchers discussed different methodologies and techniques of AI for the early detection of ocular disorders so that the early detection of disease diagnosis can be done and the timely treatment should be started as the human life is on sake. In the next section proposed methodology for the early detection of disease is illustrated. Sections “Proposed methodology” and “Experimental results analysis” give a comprehensive description and elaboration of the model and results. Matrices used for result evaluations are illustrated in section “Experimental results analysis”.
Proposed methodology
In the present time, computer sciences, medical sciences, and health care industries are booming and working together in the field of ophthalmology to solve various medical-related issues. These industries are using various advanced technologies such as AI, Cloud Computing, IoT, etc. which generate enormous medical data mainly in the form of images, videos, text, audio, signals, etc. The researcher and medical practitioner are using and analyzing these data to create the autonomous system so that the disease is detected in the early phase and proper treatment can be given to the individual to save from various life-threatening diseases. In addition to this, models and architecture are also required to refine and make optimum utilization of data to create the generalized model. The dataset and the methodology used in the research work are explained further in successive sections.
Dataset used
The dataset used for the research work has been taken from the public Mendeley database [50]. The collected dataset consists of 84,484 OCT sample images for eye disease detection. The graphical representation of dataset labeled images is illustrated in Fig. 1. The dataset is further divided into two phases of independent patients namely training and testing sets. The training set has images of eye diseases namely CNV, DME, Drusen, and Normal. The training set was further split into four directories and the directories’ names are the same as disease names. The sample images/OCT scans of all categories are depicted in Fig. 2. The images in the dataset were labeled as [disease name-patient ID (randomized)-patient image number]. In the same way, the dataset for the testing set was also split into four categories which had a total of 1000 images (250 images for each category) considered for the analysis purpose.
Fig. 1.

Number of labelled images in dataset
Fig. 2.

Sample OCT scans of eye diseases
Moreover, the repository comprises thousands of high-resolution scans which represent the retina cross-sectional images and data has been made available online publically by the authors so that other researchers can use the data and provide alternative ways for the efficient classification of eye disease by using AI and allied techniques. The histogram of the normal retina image of the training dataset is depicted in Fig. 3. The detailed description of the repository is illustrated in Table 1.
Fig. 3.
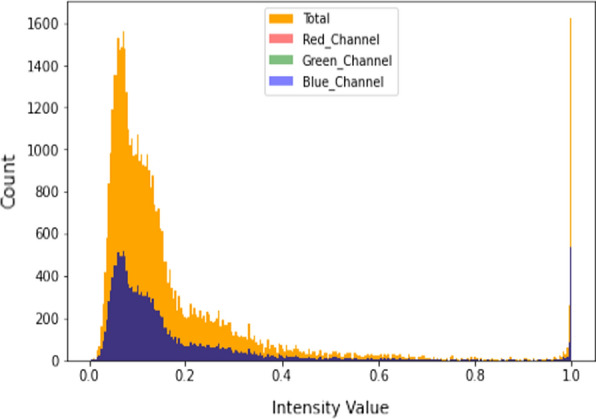
Histogram of normal retinal images
Table 1.
Dataset description
| S. no | Phases | Eye diseases | |||
|---|---|---|---|---|---|
| CNV | DME | DRUSEN | NORMAL | ||
| 1 | Training | 37,205 | 11,348 | 8616 | 26,315 |
| 2 | Testing | 250 | 250 | 250 | 250 |
Model formulation
In the medical field, it might be possible that data is not adequate to solve a specific problem. Therefore, the collection of data related to a specific domain is usually required. But the collection of this data is a tedious task and consumes a lot of time. Moreover, it might be expensive for a medical practitioner or researcher to collect such type of data. Augmentation is one of the potential solutions to overcome this problem. Further, it may enhance the model accuracy and solve the overfitting issue which occurs during the training of the DL models. Hence, augmentation helps to enhance the size of the database and prevent the occurrence of overfitting in the model.
The dataset used for model formulation has a total number of CNV diseases 37,455, DME 11,598, DRUSEN 8866, and NORMAL 26,565 respectively. For CNV disease, out of a total of 37,455, the count of 37,205 images is used in a training phase and the remaining 250 in a testing phase. Similarly, for DME, DRUSEN, and NORMAL out of a total of 11,598, 8866, and 26,565, the count of images used for DME 11,348, DRUSEN 8616, and NORMAL 26,315 in a training phase, and the remaining 250 each is in a testing phase.
In the model formulation phase, firstly, images were cleaned, cropped (as per the region of interest), and scaled down to 224*224 (width*height) to aid the fast processing of the model. Furthermore, data was reshuffled to prevent the overfitting and generalize the model. Afterward, the processed dataset images were fed to the VGG16 CNN Model for parameters extraction. The Transfer Learning approach by using the weights of the ImageNet was applied to the data. Therefore, instead of preparing a model from scratch, weights of the pre-trained model were used to boost up the training speed. In the next phase, extracted parameters were passed to the attention block where encoder–decoder model processing works. Attention helps the network to memorize the large sequence of data and also makes the approach a novel one as the attention was applied to the diabetic retinopathy dataset. In addition to it, the LeakyReLU activation function was used instead of ReLU which makes this approach a novel one as it helps to fasten the speed of the training phase and evade the issues of dead neurons (i.e., due to zero slope ReLU neurons become inactive) which usually occurs while using ReLU activation function. The representation of architecture of the proposed model is depicted in Fig. 4.
Fig. 4.

Proposed model architecture
VGG-16 CNN architecture model
VGG is the abbreviation for Visual Geometry Group. It is the group of Oxford researched those who developed this architecture [51]. The numeric word 16 implies the count of weighted layers in the architecture. One of the unique features of this architecture is that it’s mainly focusing on the convolution layer of a 3 × 3 size filter with one stride, using the same padding and 2 × 2 size filer with two strides in the max-pooling layer instead of a large number of hyperparameters [52]. In the final phase, two fully-connected layers were used followed by the SoftMax activation function for the model output. The abstract form of the VGG-16 CNN architecture model used in the research work is explained in Fig. 5.
Fig. 5.
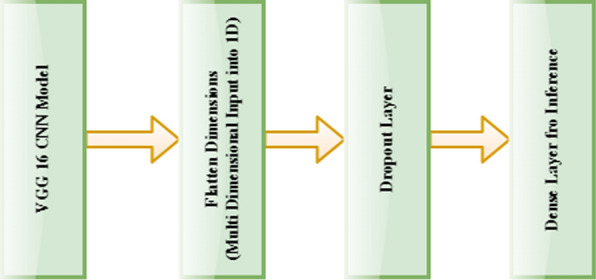
VGG-16 CNN architecture (abstract form)
Loss function used: sparse categorical cross-entropy (LSCE)
In the proposed model, LSCE loss function is used in training for the multi-class classification task. The main advantage of using the LSCE loss function is to optimize the parameter values in the proposed model. In addition to it, an Adam Optimizer is used to build the model, which decreases the loss function value with successive epochs. The formula for the LSCE is elaborated in Eq. 1.
| 1 |
where Ti is the true label, Si is the predicted label (SoftMax probabilities) for the ith data point, and LSCE is the loss function.
Proposed algorithm (VGG16_Attention model)
In this section, the proposed model approach used for their implementation is illustrated step by step.
- Step 1:
-
Pre-process the image data.
In the processing phase, the region of interest was identified in every image, and then a separate repository was made by cropping all of them.
- Step 2:
Reshape all Images to (224, 224, 3) i.e. (width, height, channel).
- Step 3:
Apply images as an input to the VGG16 Model for parameters extraction.
- Step 4:
Parameters are passed to Attention blocks.
- Step 5:
- Encoder Block.
- Apply Attention Encoder.
-
Add Dense Layer for inference.
where Z represents the output, activation represents the activation function, the dot represents the NumPy dot product of inputs & weights, input represents the input data, kernel represents the weights and b represents the bias.2 - Add a Dropout with a rate of 0.5
-
Apply LeakyReLU Activation
where Zi is the input vector.3
- Step 6:
- Decoder Block.
- Pass encoder output into RNN Feature extractor and apply Embedding and GRU (Gated Recurrent Unit).
- Output layer passed to fully connected layer for further self-attention.
-
Apply self-attention functions
4
where j is the location, t is the current time stamp, fattn is the attention function, S is the RNN decoder.5 -
Find Probability using SoftMax
6
where Zi is the input vector, eZi is the standard exponential function for the input vector, eZj is the standard exponential function for the output vector and k represents the number of classes in a multi-class classifier.
- Step 7:
Compile the model using Adam Optimizer.
The detailed description of the proposed VGG_16 Attention Model is presented in Fig. 6.
Fig. 6.

VFF16_Attention model architecture (proposed model)
Matrices used for result evaluation
The evaluation of the result of the proposed model has been done using the various parameters such as precision, recall (or sensitivity), F1 score, accuracy, specificity, etc. [53] as shown in Eqs. (7) to (11). In these equations
TruePositive indicates that the patient has some disease and the results accomplished by the model are also positive.
FalsePositive also known as Type-1 error [54] indicates the patient does not suffer any disease but the results accomplished by the model are positive.
TrueNegative indicates the patient does not suffer any disease and the results accomplished by the model are also Negative.
- FalseNegative also known as Type-2 error [54] indicates the patient has some disease but the results accomplished by the model are Negative.
7 8 9 10 11
Experimental results analysis
In result analysis, oscular disorder images namely CNV, DME, and Drusen have been compared with the normal eye images of human beings. All the pre-processed images have been passed to the various deep learning models such as MobileNet, InceptionV3, EfficientNet, DenseNet, ResNet, and the proposed VGG16_Attention model.
The analysis of these models’ results was done based on the accuracy matrices and further, the models’ results contrasted to find the best one.
Deep CNN based eye disease detection
In this section, deep learning CNN models are implemented and the output received from each model is illustrated by the figures.
MobileNet model
It is the CNN that is a 53-layered deep architecture mainly designed for mobile and embedded vision applications, classification, detection, etc. The model is very lightweight and only a few parameters are generated as compared to other ones because the structure is based on the depth-wise separable convolution. The model was trained for the 20 epochs and the results obtained from this model are illustrated in Fig. 7a, b, and Table 2. Figure 7a represents the training and validation accuracy and Fig. 7b represent the training and validation loss of the MobileNet Model. As per the loss curve, the model was able to learn properly but it was able to attain only 75.29% accuracy on the pre-processed dataset.
Fig. 7.

a MobileNet model accuracy. b MobileNet model loss
Table 2.
Training results
| Model | Epochs | Accuracy | Sensitivity | Specificity | Precision | F1 Score |
|---|---|---|---|---|---|---|
| MobileNet | 20 | 0.7529 | 0.7621 | 0.1815 | 0.9829 | 0.8586 |
| InceptionV3 | 0.747 | 0.7561 | 0.1815 | 0.9828 | 0.8547 | |
| EfficientNet | 0.8041 | 0.8149 | 0.1815 | 0.9828 | 0.891 | |
| DenseNet | 0.7728 | 0.7834 | 0.1815 | 0.9817 | 0.8714 | |
| ResNet | 0.747 | 0.7747 | 0.073 | 0.953 | 0.8547 | |
| VGG16_Attention | 0.9779 | 0.9794 | 0.9373 | 0.9977 | 0.9885 |
InceptionV3 model
It is one of the most famous architecture that can be used for transfer learning. This model is mainly used for the classification of images, object detection, image analysis, etc. In this 48-layered deep architecture model inception module is used. This module incorporated dimensionally reduction with stacked 1 × 1 convolutions which allows working efficiently in a deep network. This architecture is also referred to as GoogleNet architecture. The results obtained from this model are presented in Fig. 8a, b, and Table 2. Figure 8a represents the training and validation accuracy and Fig. 8b represent the training and validation loss of the InceptionV3 Model. The model was able to learn efficiently as per Fig. 8b but still only achieve 74.7% accuracy after 20 epochs.
Fig. 8.

a InceptionV3 model accuracy. b. InceptionV3 model loss
EfficientNet model
It is a CNN architecture that uses a compound coefficient to uniformly scale down the dimensions of depth, resolution, or width. This model provides better results and optimizes the accuracy and efficiency as measured on a FLOPS basis (Floating Points Operations Per Second) compared to other models by reducing the parameter size. The results obtained from this model are presented in Fig. 9a, b, and Table 2. Figure 9a represents the training and validation accuracy and Fig. 9b represent the training and validation loss of the EfficientNet Model. The model was able to learn quite well and achieve 80.41% accuracy which was a little bit higher as compared to the other models.
Fig. 9.

a EfficientNet model accuracy. b EfficientNet model loss
ResNet model
Residual Network is one of the powerful model that was introduced after CNN to solve complex problems. This architecture is 150+-layered deep due to this during a deep network training accuracy saturation maybe occur known as a degradation problem. Residual mapping is used to solve this issue. The results obtained from this model are presented in Fig. 10a, b, and Table 2. Figure 10a represents the training and validation accuracy and Fig. 10b represent the training and validation loss of the ResNet Model. The model was able to attain only 74.7% accuracy on the pre-processed dataset and as per the loss curve, the model was unable to learn as compared to the other models.
Fig. 10.

a ResNet model accuracy. b ResNet model loss
DenseNet model
It is a CNN architecture that is the same as ResNet architecture. In this, rather than the additive method of merging previous layers, concatenation was done. The results obtained from this model are presented in Fig. 11a, b, and Table 2. Figure 11a represents the training and validation accuracy and Fig. 11b represent the training and validation loss of the DenseNet Model. The model was able to achieve 77.28% accuracy which was a little bit higher as compared to the other models.
Fig. 11.

a DenseNet model accuracy. b DenseNet model loss
VGG16_Attention model
The attention results of the proposed VGG16_Attention model are presented in Fig. 12a and b. The figure represents the learning behavior of the model in CNV and Normal Eye scans. The proposed model results are represented in Fig. 13a, b, and Table 2. Figure 13a represents the training and validation accuracy and Fig. 13b represent the loss of the VGG16__Attention Model. The curves in the graphs explained the learning path of the proposed model in the training and validation process. The proposed model was trained only for 20 epochs and it was able to attain the accuracy of 97.79% on training and 95.6% on testing data as illustrated in graphs.
Fig. 12.

a Attention results (CNV eye scans). b Attention results (normal eye scans)
Fig. 13.

a VGG16_Attention model accuracy. b VGG16_Attention model loss
The detailed description and comparisons of the proposed VGG16_Attention model are elaborated in Table 2 and 3. The proposed model results are also analyzed based on the accuracy metrics and various other parameters as mentioned above in section “Matrices used for result evaluation”. Accuracy of 97.79% in training and 95.6% in testing has been attained by the model which is also better than some previous models proposed by the researchers like Kermany et al. [5] and Bhowmik et al. [45] who accomplished classification accuracy of 96%, and 94% respectively.
Table 3.
Testing results
| Model | Accuracy | Sensitivity | Specificity | Precision | F1 Score |
|---|---|---|---|---|---|
| VGG16_Attention | 0.956 | 0.9652 | 0.8408 | 0.9869 | 0.976 |
The VGG_16Attention model was tested on 1000 images (250 images of each category) as mentioned in Table 1. The result details attained from the proposed model are illustrated in Table 3.
Conclusion and future scope
The study proposed an AI-based algorithm for the detection of the three most common eye diseases namely Diabetic Macular Edema, Choroidal Neovascularization, and Drusen which are the severe causes of human visual impairment or sight loss. As eye diseases are growing exponentially, the bulk testing of such cases is also required at a proliferating rate because these are the major cause of vision loss in humans. In the proposed VGG16_Ateention model, the TL algorithm with Deep CNN and attention are employed which provides the competitive performance of OCT scans of eye diseases without any need for a database having a million scans or any highly specialized DL machine. Further, we conclude that the proposed model successfully classified the OCT scans and these methods can be implemented for the automatic diagnosis of ocular disorders in the upcoming time. Moreover, different manufacturers’ OCT scans/images can be included in both training and testing datasets in the future to prepare a generalized model which can be used universally for medical diagnosis. To combat various types of eye disease, the proposed model tries to provide an adequate solution economically but does not claim any perfect mechanism for disease detection. Therefore, it is further suggested to seek advice from ophthalmologists or professionals for the actual utilization of the proposed approach and resolve the real-life scenarios as human life is on sake.
Footnotes
Publisher's Note
Springer Nature remains neutral with regard to jurisdictional claims in published maps and institutional affiliations.
Contributor Information
Puneet, Email: puneet.5345@gmail.com.
Rakesh Kumar, Email: rakesh.e8623@cumail.in.
Meenu Gupta, Email: meenu.e9406@cumail.in.
References
- 1.Moraru A, Costin D, Moraru R, Branisteanu D. Artificial intelligence and deep learning in ophthalmology—present and future (review) Exp Ther Med. 2020 doi: 10.3892/etm.2020.9118. [DOI] [PMC free article] [PubMed] [Google Scholar]
- 2.Ting DSW, et al. Artificial intelligence and deep learning in ophthalmology. Br J Ophthalmol. 2019;103(2):167–175. doi: 10.1136/bjophthalmol-2018-313173. [DOI] [PMC free article] [PubMed] [Google Scholar]
- 3.Ran AR, et al. Deep learning in glaucoma with optical coherence tomography: a review. Eye. 2021;35(1):188–201. doi: 10.1038/s41433-020-01191-5. [DOI] [PMC free article] [PubMed] [Google Scholar]
- 4.Paul AJ. Advances in classifying the stages of diabetic retinopathy using convolutional neural networks in low memory edge devices. 2021. p. 1–8. 10.1109/mascon51689.2021.9563584.
- 5.Kermany DS, et al. Identifying medical diagnoses and treatable diseases by image-based deep learning. Cell. 2018;172(5):1122–1131.e9. doi: 10.1016/j.cell.2018.02.010. [DOI] [PubMed] [Google Scholar]
- 6.Ishtiaq U, AbdulKareem S, Abdullah ERMF, Mujtaba G, Jahangir R, Ghafoor HY. Diabetic retinopathy detection through artificial intelligent techniques: a review and open issues. Multimedia Tools Appl. 2020;79(21–22):15209–15252. doi: 10.1007/s11042-018-7044-8. [DOI] [Google Scholar]
- 7.Lakshminarayanan V, Kheradfallah H, Sarkar A, Balaji JJ. Automated detection and diagnosis of diabetic retinopathy: a comprehensive survey. J Imaging. 2021 doi: 10.3390/jimaging7090165. [DOI] [PMC free article] [PubMed] [Google Scholar]
- 8.Swenor BK, Lee MJ, Varadaraj V, Whitson HE, Ramulu PY. Aging with vision loss: a framework for assessing the impact of visual impairment on older adults. Gerontologist. 2020;60(6):989–995. doi: 10.1093/geront/gnz117. [DOI] [PMC free article] [PubMed] [Google Scholar]
- 9.Teo ZL, et al. Global prevalence of diabetic retinopathy and projection of burden through 2045: systematic review and meta-analysis. Ophthalmology. 2021;128(11):1580–1591. doi: 10.1016/j.ophtha.2021.04.027. [DOI] [PubMed] [Google Scholar]
- 10.World Health Organization. “World report on vision,” 2019. https://www.who.int/publications/i/item/9789241516570. Accessed 12 Dec 2021.
- 11.Correspondent B. “80–90% of blindness cases in India are preventable: experts,” 2018. https://www.biovoicenews.com/80-90-of-blindness-cases-in-india-are-preventable-experts/. Accessed 12 Dec 2021.
- 12.Nuzzi R, Boscia G, Marolo P, Ricardi F. The impact of artificial intelligence and deep learning in eye diseases: a review. Front Med. 2021;8(August):1–11. doi: 10.3389/fmed.2021.710329. [DOI] [PMC free article] [PubMed] [Google Scholar]
- 13.Alsaih K, Lemaitre G, Rastgoo M, Massich J, Sidibé D, Meriaudeau F. Machine learning techniques for diabetic macular edema (DME) classification on SD-OCT images. Biomed Eng Online. 2017;16(1):1–12. doi: 10.1186/s12938-017-0352-9. [DOI] [PMC free article] [PubMed] [Google Scholar]
- 14.Al-Moosawi NM, Khudeyer RS. ResNet-34/DR: a residual convolutional neural network for the diagnosis of diabetic retinopathy. Informatica. 2021;45(7):115–124. doi: 10.31449/inf.v45i7.3774. [DOI] [Google Scholar]
- 15.Tariq H, Rashid M, Javed A, Zafar E, Alotaibi SS, Zia MYI. Performance analysis of deep-neural-network-based automatic diagnosis of diabetic retinopathy. Sensors. 2022;22(1):1–15. doi: 10.3390/s22010205. [DOI] [PMC free article] [PubMed] [Google Scholar]
- 16.Burlina PM, Joshi N, Pekala M, Pacheco KD, Freund DE, Bressler NM. Automated grading of age-related macular degeneration from color fundus images using deep convolutional neural networks. JAMA Ophthalmol. 2017;135(11):1170–1176. doi: 10.1001/jamaophthalmol.2017.3782. [DOI] [PMC free article] [PubMed] [Google Scholar]
- 17.Gulshan V, et al. Development and validation of a deep learning algorithm for detection of diabetic retinopathy in retinal fundus photographs. JAMA. 2016;316(22):2402–2410. doi: 10.1001/jama.2016.17216. [DOI] [PubMed] [Google Scholar]
- 18.Schmidt-Erfurth U, Sadeghipour A, Gerendas BS, Waldstein SM, Bogunović H. Artificial intelligence in retina. Prog Retin Eye Res. 2018 doi: 10.1016/j.preteyeres.2018.07.004. [DOI] [PubMed] [Google Scholar]
- 19.Abramoff MD, Garvin MK, Sonka M. Retinal imaging and image analysis. IEEE Rev Biomed Eng. 2010;3:169–208. doi: 10.1109/RBME.2010.2084567. [DOI] [PMC free article] [PubMed] [Google Scholar]
- 20.Ţǎlu Ş, Ţǎlu M, Giovanzana S, Shah RD. The history and use of optical coherence tomography in ophthalmology. Hum Vet Med. 2011;3(1):29–32. [Google Scholar]
- 21.Ran A, Cheung CY. Deep learning-based optical coherence tomography and optical coherence tomography angiography image analysis: an updated summary. Asia-Pac J Ophthalmol (Philadelphia, Pa) 2021;10(3):253–260. doi: 10.1097/APO.0000000000000405. [DOI] [PubMed] [Google Scholar]
- 22.Sheet SSM, Tan TS, As’ari MA, Hitam WHW, Sia JSY. Retinal disease identification using upgraded CLAHE filter and transfer convolution neural network. ICT Express. 2021 doi: 10.1016/j.icte.2021.05.002. [DOI] [Google Scholar]
- 23.Kulkarni A, Chong D, Batarseh FA. Data democracy. Amsterdam: Elsevier; 2020. Foundations of data imbalance and solutions for a data democracy; pp. 83–106. [Google Scholar]
- 24.Han J. The design of diabetic retinopathy classifier based on parameter optimization SVM. 2018. 10.1109/ICIIBMS.2018.8549947.
- 25.Wan S, Liang Y, Zhang Y. Deep convolutional neural networks for diabetic retinopathy detection by image classification. Comput Electr Eng. 2018;72:274–282. doi: 10.1016/j.compeleceng.2018.07.042. [DOI] [Google Scholar]
- 26.Jena M, Mishra SP, Mishra D. Detection of diabetic retinopathy images using a fully convolutional neural network. In: Proceedings—2nd international conference on data science and business analytics (ICDSBA). 2018. p. 523–27. 10.1109/ICDSBA.2018.00103.
- 27.Mobeen-Ur-Rehman, Khan SH, Abbas Z, Danish Rizvi SM. Classification of diabetic retinopathy images based on customised CNN architecture. In: Proceedings—2019 Amity international conference on artificial intelligence (AICAI). 2019. p. 244–8. 10.1109/AICAI.2019.8701231.
- 28.Martinez-Murcia FJ, Ortiz A, Ramírez J, Górriz JM, Cruz R. Deep residual transfer learning for automatic diagnosis and grading of diabetic retinopathy. Neurocomputing. 2021;452:424–434. doi: 10.1016/j.neucom.2020.04.148. [DOI] [Google Scholar]
- 29.Chopra R, Wagner SK, Keane PA. Optical coherence tomography in the 2020s—outside the eye clinic. Eye. 2021;35(1):236–243. doi: 10.1038/s41433-020-01263-6. [DOI] [PMC free article] [PubMed] [Google Scholar]
- 30.Gangwar AK, Ravi V. Diabetic retinopathy detection using transfer learning and deep learning. Singapore: Springer; 2021. [Google Scholar]
- 31.ADCIS: a team of imaging experts, “Messidor.” https://www.adcis.net/en/third-party/messidor/. Accessed 15 Dec 2021.
- 32.Asia Pacific Tele-Ophthalmology Society. APTOS 2019 blindness detection. Detect diabetic retinopathy to stop blindness before it’s too late. 2020. https://www.kaggle.com/c/aptos2019-blindness-detection/overview. Accessed 15 Dec 2021.
- 33.Medeiros FA, Jammal AA, Thompson AC. From machine to machine: an OCT-trained deep learning algorithm for objective quantification of glaucomatous damage in fundus photographs. Ophthalmology. 2019;126(4):513–521. doi: 10.1016/j.ophtha.2018.12.033. [DOI] [PMC free article] [PubMed] [Google Scholar]
- 34.Le D, et al. Transfer learning for automated octa detection of diabetic retinopathy. Transl Vis Sci Technol. 2020;9(2):1–9. doi: 10.1167/tvst.9.2.35. [DOI] [PMC free article] [PubMed] [Google Scholar]
- 35.Chowdhury P, Islam MR, Based MA, Chowdhury P. Transfer learning approach for diabetic retinopathy detection using efficient network with 2 phase training. In: 2021 6th international conference for convergence in technology (I2CT). 2021. p. 1–6. 10.1109/I2CT51068.2021.9418111.
- 36.California Healthcare Foundation. Diabetic retinopathy detection. Identify signs of diabetic retinopathy in eye images. 2015. https://www.kaggle.com/c/diabetic-retinopathy-detection/overview. Accessed 10 Dec 2021.
- 37.An G, Akiba M, Omodaka K, Nakazawa T, Yokota H. Hierarchical deep learning models using transfer learning for disease detection and classification based on small number of medical images. Sci Rep. 2021;11(1):1–9. doi: 10.1038/s41598-021-83503-7. [DOI] [PMC free article] [PubMed] [Google Scholar]
- 38.Anil Kumar KR, Megha PM, Meenakshy K. Diabetic retinopathy detection & classification techniques: a review. Int J Sci Technol Res. 2020;9(3):1621–1628. [Google Scholar]
- 39.Samanta A, Saha A, Satapathy SC, Fernandes SL, Zhang YD. Automated detection of diabetic retinopathy using convolutional neural networks on a small dataset. Pattern Recognit Lett. 2020;135:293–298. doi: 10.1016/j.patrec.2020.04.026. [DOI] [Google Scholar]
- 40.Albahli S, Nazir T, Irtaza A, Javed A. Recognition and detection of diabetic retinopathy using densenet-65 based Faster-RCNN. Comput Mater Contin. 2021;67(2):1333–1351. doi: 10.32604/cmc.2021.014691. [DOI] [Google Scholar]
- 41.Pao SI, Lin HZ, Chien KH, Tai MC, Chen JT, Lin GM. Detection of diabetic retinopathy using bichannel convolutional neural network. J Ophthalmol. 2020 doi: 10.1155/2020/9139713. [DOI] [PMC free article] [PubMed] [Google Scholar]
- 42.Salvi RS, Labhsetwar SR, Kolte PA, Venkatesh VS, Baretto AM. Predictive analysis of diabetic retinopathy with transfer learning. In: 2021 international conference on nascent technologies in engineering (ICNET) 2021—proceedings. 2021. 10.1109/ICNTE51185.2021.9487789.
- 43.Rajkumar RS, Jagathishkumar T, Ragul D, Selvarani AG. Transfer learning approach for diabetic retinopathy detection using residual network. In: 2021 6th international conference on inventive computation technologies (ICICT). January 2021. p. 1189–93. 10.1109/ICICT50816.2021.9358468.
- 44.Boral YS, Thorat SS. Classification of diabetic retinopathy based on hybrid neural network. In: Proceedings—5th international conference on computing methodologies and communication (ICCMC) 2021, no. Iccmc. 2021. p. 1354–8. 10.1109/ICCMC51019.2021.9418224.
- 45.Bhowmik A, Kumar S, Bhat N. Eye disease prediction from optical coherence tomography images with transfer learning. Cham: Springer International Publishing; 2019. [Google Scholar]
- 46.Shelar M, Gaitonde S, Senthilkumar A, Mundra M, Sarang A. Detection of diabetic retinopathy and its classification from the fundus images. In: 2021 international conference on computer communication and informatics (ICCCI). 2021. p. 3–8. 10.1109/ICCCI50826.2021.9402347.
- 47.Lu W, Tong Y, Yu Y, Xing Y, Chen C, Shen Y. Deep learning-based automated classification of multi-categorical abnormalities from optical coherence tomography images. Transl Vis Sci Technol. 2018 doi: 10.1167/tvst.7.6.41. [DOI] [PMC free article] [PubMed] [Google Scholar]
- 48.Hasan MK, et al. Cataract disease detection by using transfer learning-based intelligent methods. Comput Math Methods Med. 2021 doi: 10.1155/2021/7666365. [DOI] [PMC free article] [PubMed] [Google Scholar] [Retracted]
- 49.Larxel. Ocular disease recognition. 2020. https://www.kaggle.com/andrewmvd/ocular-disease-recognition-odir5k. Accessed 24 Dec 2021.
- 50.Kermany D, Zhang K, Goldbaum M. Large dataset of labeled optical coherence tomography (OCT) and chest X-RAY Images. 2018. https://data.mendeley.com/datasets/rscbjbr9sj/3. Accessed 20 Dec 2021.
- 51.Perumanoor TJ. What is VGG16?—introduction to VGG16. 2021. https://medium.com/@mygreatlearning/what-is-vgg16-introduction-to-vgg16-f2d63849f615. Accessed 21 Dec 2021.
- 52.Paras Varshney. VGGNet-16 architecture: a complete guide. 2019. https://www.kaggle.com/blurredmachine/vggnet-16-architecture-a-complete-guide. Accessed 24 Dec 2021.
- 53.Sarang Narkhede. Understanding confusion matrix towards data science. 2018. https://towardsdatascience.com/understanding-confusion-matrix-a9ad42dcfd62. Accessed 26 Dec 2021.
- 54.Singh P, Singh N, Singh KK, Singh A. Machine learning and the internet of medical things in healthcare. Amsterdam: Elsevier; 2021. Diagnosing of disease using machine learning; pp. 89–111. [Google Scholar]