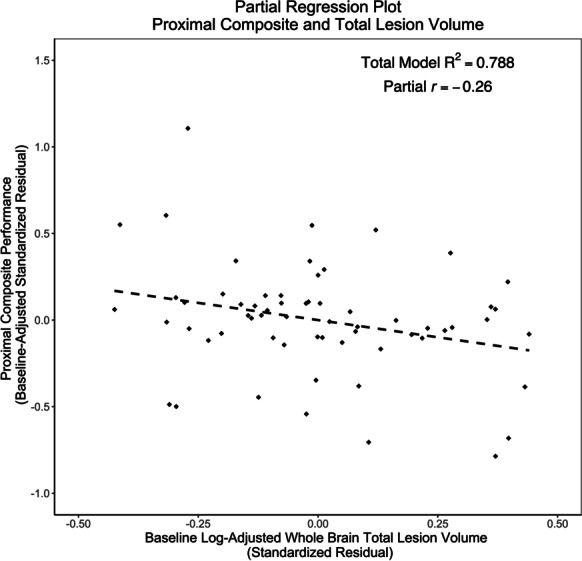
Fig. 4.

Partial regression plot for baseline TLV and 3-month proximal composite. Partial regression plot demonstrating a potentially suggestive trend between baseline log-adjusted TLV and post-intervention proximal composite performance (p = 0.06), while controlling for baseline performance, cognitive training group, tDCS group, age, sex, years of education, scanner type, estimated total intracranial volume, log-adjusted whole-brain TLV, and binarized cardiovascular disease (CVD) risk
