

Summary
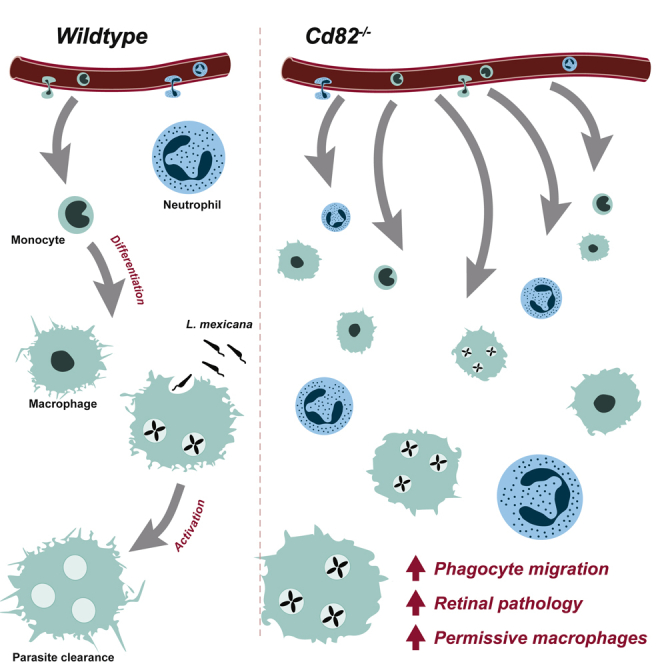
Phagocytes migrate into tissues to combat infection and maintain tissue homeostasis. As dysregulated phagocyte migration and function can lead to inflammation or susceptibility to infection, identifying molecules that control these processes is critical. Here, we show that the tetraspanin CD82 restrains the migration of neutrophils and macrophages into tissues. Cd82−/− phagocytes exhibited excessive migration during in vivo models of peritoneal inflammation, superfusion of CXCL1, retinopathy of prematurity, and infection with the protozoan parasite L. mexicana. However, with the latter, while Cd82−/− macrophages infiltrated infection sites at higher proportions, cutaneous L. mexicana lesions were larger and persisted, indicating a failure to control infection. Analyses of in vitro bone-marrow-derived macrophages showed CD82 deficiency altered cellular morphology, and impaired gene expression and metabolism in response to anti-inflammatory activation. Altogether, this work reveals an important role for CD82 in restraining phagocyte infiltration and mediating their differentiation in response to stimulatory cues.
Subject areas: Biological sciences, Immunology, Immune system
Graphical abstract
Highlights
-
•
Tetraspanin CD82 restrains phagocyte migration in murine models of inflammation
-
•
Excessive migration of Cd82−/− myeloid cells exacerbates retinal inflammation
-
•
Cd82−/− macrophages have a reduced ability to clear Leishmania mexicana parasites
-
•
CD82 is required for the normal morphology and activation of M2 macrophages
Biological sciences; Immunology; Immune system
Introduction
Phagocytes, including neutrophils and macrophages, are critically important in orchestrating protective immune responses. During infection or tissue injury, these cells are the “first responders” that detect invading pathogens or damage by infiltrating compromised tissues and secreting pro-inflammatory mediators that promote further leukocyte recruitment. Insufficiency of phagocyte function leads to worsening infection control as illustrated in immune deficiencies such as chronic granulomatous disease (Heyworth et al., 2003) and leukocyte adhesion deficiency (Harris et al., 2013). By contrast, excessive recruitment of neutrophils and macrophages into tissues underpins the development and progression of debilitating, chronic inflammatory diseases. Here, uncontrolled inflammation can lead to loss of organ function, for example so-called “cytokine storms” that cause severe pathology during viral and bacterial infections. This balance between protective homeostatic and pathological responses is particularly important for macrophages, which exhibit a wide variety of functions within all tissues ranging from the phagocytosis and elimination of intracellular pathogens to homeostatic roles in promoting wound repair, organ function, and development (Wright and Binger, 2017).
Phagocyte migration into tissues and their subsequent response to tissue cues requires the coordination of a myriad of adhesion molecules, cytoskeletal rearrangement, signaling receptors, and associated proteins. The spatiotemporal organization of these molecules at the cell membrane is critical and there is accumulating evidence that tetraspanins, a family of four-transmembrane domain proteins, make a significant contribution to these processes (Tarrant et al., 2003; Jones et al., 2011; Yeung et al., 2018). For example, we have recently identified that the leukocyte-restricted tetraspanins CD37 and CD53 are required for leukocyte recruitment. CD37 is vital for stable leukocyte adhesion to the inflamed vascular endothelium, and is required for both stabilizing β2 integrins at the cell surface, and for actin polymerization and cell polarization following adhesion to ICAM-1 (Wee et al., 2015). CD53 is required for both the cell surface expression of L-selectin (Demaria et al., 2020) and the organization of α3 integrins during transmigration (Yeung et al., 2020), thereby mediating lymphocyte homing and the transmigration of adherent leucocytes out of the vasculature.
In this study, we identify the broadly expressed tetraspanin CD82 as having diverse roles in mediating phagocyte responses. CD82 is best known as a suppressor of epithelial and endothelial cell motility and cancer cell metastases (Zöller, 2009). In immune cells, CD82 modulates bone marrow homing of progenitor cells (Saito-Reis et al., 2021) via regulation of α4β1 integrin stability and clustering in the cell membrane (Termini et al., 2014). Additionally, we have recently identified a role for CD82 in dendritic cell function where it promotes antigen presentation but restrains DC migration to draining lymph nodes (Jones et al., 2016). In this paper, we show CD82 deficiency leads to increased infiltration of phagocytes into inflamed tissues. The consequence of this infiltration is dependent on the disease setting and reveals an unappreciated role for CD82 in restraining phagocyte migration and supporting macrophage activation.
Results
CD82 restrains phagocyte migration
Our recent study showed CD82 suppresses the migration of dendritic cells (Jones et al., 2016), in line with a body of evidence indicating that CD82 restrains the migration of metastatic cells (Zöller, 2009). We hypothesized that CD82 has a general role in restraining phagocyte migration from the vasculature into inflamed tissues. We used a thioglycollate-induced peritonitis model and measured neutrophil and macrophage infiltration into the peritoneum of wild-type (WT) and CD82-deficient (Cd82−/−) mice. This model replicates many aspects of inflammation, where neutrophils infiltrate in the first 24 h followed by a wave of monocytes/macrophages which predominate at 72 h (Figure 1A and 1B). Cd82−/− mice showed increased numbers compared to WT of both neutrophils and macrophages at 24 and 72 h, respectively (Figures 1A and 1B), indicative of a hypermigratory phenotype in the absence of CD82. To investigate the mechanism(s) underlying this observation, we used intravital microscopy of the microvasculature of the cremaster muscle to monitor phagocyte-endothelial cell interactions in more detail. Upon superfusion of the muscle with the chemokine CXCL1, neutrophils, which constitutively undergo rolling in cremasteric postcapillary venules, undergo stable adhesion on the endothelial surface and proceed to transmigrate out of the vasculature. In the absence of CXCL1 (0 min), under basal conditions, there was no difference in WT and Cd82−/− neutrophil rolling velocity and flux, or the low level of adhesion or emigration seen in the absence of an inflammatory stimulus (Figures 1C–1F). During exposure to CXCL1, there was no difference in the velocity with which WT and Cd82−/− neutrophils rolled along the endothelial surface (Figure 1C), although after 60 min exposure to CXCL1, the number of rolling leucocytes (leukocyte rolling flux) was significantly reduced in Cd82−/− mice (Figure 1D), potentially indicating a role for CD82 in regulating selectin function. By contrast, the number of leucocytes adhering to and emigrating from the vasculature was increased in Cd82−/− mice (Figures 1E and 1F), particularly at 60 min where a striking increase in the number of Cd82−/−-emigrated neutrophils was evident (Figure 1F).
Figure 1.

CD82 restrains phagocyte recruitment
(A and B) Wild-type (WT) and Cd82−/− mice were injected intraperitoneally with thioglycollate and (A) neutrophil and (B) macrophage infiltration into the peritoneal cavity was quantified by flow cytometry. Each data point represents a single mouse. Gating strategy is shown in Figure S1.
(C–F) Intravital microscopy was performed on the cremasteric microvasculature during 60 min superfusion with CXCL1. Parameters measured were (C) leukocyte rolling velocity, (D) rolling flux, (E) adhesion within the vasculature, and (F) emigration, each assessed prior to (0 min) and 30 and 60 min after commencing CXCL1 superfusion. Each data point represents a single mouse.
(G) Neutrophil migration in vitro was measured by transwell assays. Neutrophils were enriched from WT and Cd82−/− bone marrow by application to discontinuous Percoll gradients. Cells were then plated into the upper chamber of a transwell assay system. The number of cells which migrated into lower chambers containing either media (unstimulated), CXCL1, or LTB4 was quantified by flow cytometry. Each dot represents the mean from four independent experiments. All data are presented as mean ± SEM. p values for the effect of CD82 deficiency and the interaction of time were calculated by 2-way ANOVA and is indicated in the top left corner of each graph. Additionally, Sidak post-hoc multiple comparison analysis of individual time points is indicated by ∗p < 0.05; ∗∗p < 0.01; ∗∗∗p < 0.001. See also Figure S1.
To assess whether the hypermigratory phenotype was intrinsic to CD82-deficient phagocytes, we first assessed the cellularity of Cd82−/− blood and other lymphoid organs and could detect no difference in the development of immune cell populations which might account for the increased recruitment of Cd82−/− leucocytes in the peritonitis and CXCL1-induced inflammation models (Figure S1). CD82 is expressed on both immune cells and endothelial cells and as such, differences in both cell types may have contributed to the changes in leukocyte behavior observed in Cd82−/− mice. We therefore performed an in vitro assay of migration along a chemotactic gradient where neutrophil-enriched bone marrow populations were allowed to migrate into lower transwells containing either CXCL1 or LTB4. Cd82−/− neutrophils migrated to both chemokines in significantly greater numbers than WT (Figure 1G). Taken together, these results show that CD82 deficiency increases phagocyte migration into tissues, with a striking effect on transmigration, where in vitro assays suggest this phenotype is phagocyte-intrinsic.
Excessive migration of Cd82−/− myeloid cells exacerbates retinal inflammation
Having established that CD82 negatively regulates the migration of phagocytes, we set out to examine whether this tetraspanin contributes to diseases caused by excessive leukocyte recruitment and inflammation. Oxygen-induced retinopathy (OIR) is a model of retinal inflammation with similarities to the childhood syndrome retinopathy of prematurity. In this model, neonatal mice (postnatal day 7–11) are first exposed to a high oxygen environment (75% O2), which causes a degeneration of retinal capillaries and the formation of an avascular zone. Neonates are then exposed to room air for an additional 7 days, where the drop in O2 results in retinal hypoxia, leading to pathological angiogenesis characterized by the formation of neovascular tufts. We and others have shown that inflammation is a critical pathway in OIR pathology: neutrophils and monocytes migrate into the retina and secrete inflammatory factors that promote pathology (Ritter et al., 2006; Wilkinson-Berka et al., 2014). In OIR, WT and Cd82−/− neonatal mice both exhibited pathological angiogenesis including retinal regions absent of blood vessels (avascularization) and the formation of abnormal vasculature networks (neovascular tufts) (Figure 2A). Room air (RA) controls had normal retinal vascularization. The number of neovascular tufts was increased in Cd82−/− mice (Figure 2B), which correlated with increased retinal albumin (Figure 2C), consistent with increased vascular permeability and exacerbated pathology associated with the absence of CD82. We next examined the effect of CD82 deficiency on phagocyte migration into the retina during OIR. Retinal whole mounts and paraffin sections were immunolabeled with ionized calcium-binding adapter molecule 1 (Iba1), a specific marker for infiltrated macrophages and microglia, resident myeloid cells of the central nervous system (Figures 2D–2F). In both RA and OIR, Cd82−/− retinas exhibited an increased number of Iba1-positive cells, particularly in OIR where there was a striking increase (Figures 2D and 2E). Iba1-positive cells were also observed to be closely associated with the vasculature (Figure 2F). To determine whether this was due to an increase in monocyte migration into the retina or proliferation of resident microglia, we isolated whole retinas for analysis by flow cytometry. The close similarity between monocytes, macrophages, and microglia means that these populations share many common surface markers. However, microglia and macrophages in the retina can be separated by the reduced expression of CD45 on microglia cells, while monocytes express high levels of Ly6C, which is low in both microglia and macrophages (Greter et al., 2015; Deliyanti et al., 2017) (Figure S2). Of the three populations, only macrophages (CD45hi CD11b+ Ly6C−) were significantly increased in Cd82−/− retinas (Figures 2G–2I). These findings demonstrate that the increased pathology induced by OIR in Cd82−/− mice is coincident with an increased macrophage infiltrate and consistent with reports that macrophages promote pathological angiogenesis in OIR (Gao et al., 2016).
Figure 2.

Cd82−/− mice have increased retinal macrophage recruitment and exacerbated pathology
(A) Representative whole mounts of retina from WT and Cd82−/− mice subjected to oxygen-induced retinopathy (OIR) and room-air (RA) controls. Vasculature was identified by immunolabeling with antibodies against lectin (green). Neovascular tufts (arrows) and avascularization (asterisk) are identified. Scale bar 250 μm.
(B) The proportion of neovascular tufts per retinal wholemount area was quantified. Neovascular tufts were not detected in control retina. Each data point represents a single mouse.
(C) Albumin per mg of retinal tissue of WT and Cd82−/− mice with OIR. Each data point represents a single mouse.
(D–F) Microglia/macrophage numbers in the retina were measured by immunolabeling for Iba1. (D) Retinal paraffin sections (3 μm) were immunolabeled with Iba1 (brown) and counterstained with hemotoxylin (blue). Neovascular tufts (arrows) and Iba1-positive cells (asterisk) are identified. Scale bar = 60 μm. (E) Quantification of Iba1 immunolabeling in paraffin sections from D. Each data point represents a single mouse. (F) Retinal wholemounts from A were immunolabeled for Iba1 (orange-yellow) and lectin (green). Scale bar = 100 μm.
(G–I) Whole retinas from WT and Cd82−/− mice with OIR were enzymatically digested into single-cell suspensions for flow cytometry. The number of macrophages, monocytes, and microglia was identified by their varying expression of CD45, CD11b, and Ly6C as indicated. Gating strategy is shown in Figure S2. Each data point represents a single mouse. All data are presented as mean ± SEM. Significance was measured by t-test (B, F–H) or 2-way ANOVA (E) where for the latter, the calculated p value for CD82 deficiency and the interaction of OIR is indicated in the top left corner and Sidak post-hoc multiple comparison analysis of individual time points. In all graphs, significance is ∗p < 0.05; ∗∗p < 0.01; ∗∗∗p < 0.001. See also Figure S2.
Increased infiltration of CD82-deficient macrophages does not enhance the clearance of L. mexicana
To further explore the role of CD82 in phagocyte function during disease, we turned to an infectious model particularly dependent on macrophage biology. Leishmaniasis is a significant disease in developing countries caused by over 20 species of the protozoan parasite Leishmania spp. Phagocytes are integral to both disease progression and successful resolution of infection: after transmission via the bite of an infected sandfly, Leishmania spp. are first phagocytosed by neutrophils, then macrophages (Kaye and Scott, 2011). Internalized Leishmania spp. reside within macrophage parasitophorous vacuoles and use multiple strategies to avoid detection and manipulate their host into a permissive environment for their replication and long-term survival (Schaible et al., 1999; Sacks and Sher, 2002; Gogoi et al., 2016). Undetected, the burden of ingested and proliferated Leishmania spp. eventuates in the physical disruption of the host macrophage and extracellular delivery of parasites to perpetuate the infection. However, macrophages do possess the ability to eliminate ingested Leishmania spp. and, if activated to a pro-inflammatory phenotype, will produce potent leishmanicidal molecules such as nitric oxide. We used a model of cutaneous leishmaniasis where Leishmania (L) mexicana was injected intradermally into the ear pinna of WT and Cd82−/− mice. The development of cutaneous lesions was measured over the course of 12 weeks, where at the peak of infection (6 weeks), lesions and draining lymph nodes were isolated and analyzed by flow cytometry (Figure 3). Both WT and Cd82−/− mice developed cutaneous lesions at injection sites. In WT mice, lesions increased in size until ∼6 weeks after which point they self-resolved. However, deficiency of CD82 increased both the size and persistence of lesions where Cd82−/− mice still had visible lesions after 11 weeks (Figure 3B). Lesion sizes peaked in both WT and Cd82−/− mice at ∼6 weeks, but were significantly larger with the loss of CD82 (Figure 3C). At this time point, lesions and draining lymph nodes from WT and Cd82−/− were isolated, digested, and analyzed by flow cytometry. Macrophages, monocytes, dendritic, and T cells were all increased in cutaneous lesions from Cd82−/− mice (Figure 3D and S3). However, no difference in these populations was detected in draining lymph nodes (Figure 3D). These data suggest that the deficiency of CD82 leads to an increased infiltration of myeloid cells into cutaneous lesions, supporting our previous findings in models of peritonitis, chemotaxis, and retinopathy of prematurity (Figures 1 and 2). The increased size and persistence of lesions in the Cd82−/− mice could be merely due to increased infiltration of myeloid cells, or rather that the absence of CD82 leads to a reduced capacity of macrophages to eradicate the parasites. To address this point, we examined the capacity of Cd82−/− bone-marrow-derived macrophages (BMDMs) to eliminate L. mexicana in vitro.
Figure 3.

Infection with L. mexicana is worsened in Cd82−/− mice
(A–D) WT and Cd82−/− mice were infected intradermally with the obligate intracellular parasite Leishmania (L) mexicana. (A) Scheme for the intradermal (ear) infection of WT and Cd82−/− mice with L. mexicana. Cutaneous lesion development was measured for a total of 12 weeks post infection. At 6 weeks, mice were sacrificed and the immune composition of lesions and draining lymph nodes (DLN) was measured by flow cytometry. (B) Cutaneous lesion sizes post infection with L. mexicana. Data from N = 10–13 mice pooled from two independent experiments. Shading indicates ±SEM (C) Cutaneous lesions sizes from B only at 6 weeks. Note that several WT mice had no lesions at this time point, indicated as 0 mm. Each data point represents a single mouse. (D) Cutaneous lesions and DLNs were enzymatically digested and analyzed by flow cytometry. The proportion of macrophages, monocytes, dendritic cells (DCs), and T cells was determined by staining with fluorescently conjugated antibodies. Y axes indicate how populations were determined. Cutaneous lesions are shown as proportion of CD11b+ cells while DLNs are shown as absolute numbers. Full gating strategy is shown in Figure S3.
(E and F) Macrophages were differentiated in vitro from the bone marrow of WT and Cd82−/− mice. After 7 days differentiation, macrophages were infected with L. mexicana-TurboRFP, parasite line expressing the fluorescent protein TurboRFP. The proportion of macrophages infected with L. mexicana-TurboRFP was measured 4 h (E) and 3 days (F) later by flow cytometry. Gating strategy to determine the proportion of viable, L. mexicana-TurboRFP-infected macrophages is shown in Figure S3. Parasitic burden is measured as the TurboRFP geometric mean fluorescence intensity (MFI) of infected macrophages. Parasitic index is calculated by the multiplication of the proportion infected and parasitic burden. Each dot represents the relative mean from four independent experiments, each with separate mice. All data are presented as mean ± SEM. Significance was measured by t-test (C–F) or 2-way ANOVA (B) with the overall significance indicated in the top left corner of the graph. For 2-way ANOVA, Sidak post-hoc multiple comparison analysis was performed of individual time points. In all graphs, significance is indicated by ∗p < 0.05; ∗∗p < 0.01; ∗∗∗p < 0.001. See also Figure S3.
Bones from WT and Cd82−/− mice were flushed and bone marrow stem cells differentiated into macrophages by incubation with colony-stimulating factor (CSF)-1 for 7 days. BMDMs were then incubated for 4 h with L. mexicana stably expressing the constitutively fluorescent protein Turbo-RFP (L. mexicana-TurboRFP) (Figure 3E). After 3 days, the proportion of viable, infected macrophages was determined by flow cytometry. Here, macrophages (CD11b+F4/80+) that were also TurboRFP+ were considered infected with L. mexicana (Figure S3). WT and Cd82−/− BMDMs showed no difference in viability yet CD82 deficiency led to an increase in the proportion of infected macrophages (Figure 3F). An important measure in evaluating Leishmania spp. infection is the number of parasites per cell, or the burden of infection. We have found that the geometric mean fluorescence intensity (gMFI) of TurboRFP+ macrophages correlates with the number of parasites per cell, or parasitic burden (McGowan et al., unpublished). Parasitic burden was increased in Cd82−/− macrophages, as was the parasitic index (Figure 3F). From these data, we conclude that while CD82 restrains macrophage migration into cutaneous lesions, upon arriving in the tissue and internalizing the pathogen, Cd82−/− macrophages have a reduced ability to clear L. mexicana.
CD82 is required for the activation of macrophages into anti-inflammatory phenotypes
Macrophages are highly plastic myeloid cells that adopt a variety of effector functions depending on the type of stimulatory cues they receive from their local environment. Within the tissue milieu, when unactivated macrophages detect cues via pathogen-associated molecular patterns (PAMPs) or pro-inflammatory cytokines, such as interferon gamma (IFN-γ), they differentiate into so-called “M1” macrophages, which are characterized as intensely glycolytic cells that express a suite of pro-inflammatory genes and assume a large, spread cell morphology. Conversely, if they encounter anti-inflammatory cues such as interleukin IL-4 and IL-13, they differentiate into “M2” macrophages, which use oxidative metabolic pathways, express genes involved in tissue repair, and show elongated, spindle-shaped cell morphology. The balance between these pro- and anti-inflammatory phenotypes is crucial in the progression of diseases such as retinopathy of prematurity (Hellström et al., 2013) and leishmaniasis (Muraille et al., 2014). While our data clearly show that CD82 suppresses the infiltration of myeloid cells into tissues, we set out to investigate whether CD82 also influenced the acquisition of macrophage pro- and anti-inflammatory phenotypes. BMDMs were generated from the bones of WT and Cd82−/− mice, and then activated to M2 (with IL-4 + IL-13) or M1 (with LPS + IFNγ). Macrophage morphology was evaluated by visualization of actin filaments with confocal microscopy. WT macrophages exhibited typical responses where M2 macrophages displayed long spindle-shaped phenotypes, while M1 macrophages were large and flattened (Figure 4A). While no difference was detected between CD82-deficient unstimulated and M1 macrophages, Cd82−/− M2-activated macrophages appeared to have more spread morphologies (Figure 4A). We performed morphological analyses with ImageJ and determined the circularity of WT and CD82-deficient macrophages in all activation conditions. With this parameter, a circularity value of 1 indicates a perfect circle which decreases as the cell becomes more elongated and less round. Importantly, this analysis takes into consideration both the length of the cell perimeter and the area, thereby effectively normalizing any heterogeneity in cell size. We identified a significant difference in the circularity of WT and CD82-deficient macrophages, particularly M2-activated cells (Figure 4B). Upon closer inspection, we identified CD82-deficient M2 macrophages had more rounded membranes and less “spiky” filopodia-like protrusions (Figure 4C). Changes in cell morphology such as these are caused by the interaction of cells via integrins, which mediate the activation of Rho family GTPases and subsequent rearrangement of the actin cytoskeleton. Our previous work identified that CD82-deficient dendritic cells also lacked membrane projections which were associated with increased activity of RhoA and Cdc42 (Jones et al., 2016). Cdc42 in particular is thought to play an important role in filopodia formation in macrophages (Peppelenbosch et al., 1999; Horsthemke et al., 2017). As there is a body of evidence showing CD82 interacts with and mediates integrin signaling in a variety of cell types (He et al., 2005; Termini et al., 2014), we postulated that the morphological alterations in CD82-deficient M2 macrophages were due to alterations in integrin function which thereby affect Cdc42 activity, cytoskeletal rearrangement, and filopodia formation. WT and CD82-deficient BMDMs were generated and activated into M1 and M2 phenotypes and the expression of the integrins β1, α4, α5, αM and αX, and ICAM-1 was determined by flow cytometry (Figures 4D, 4E, and S4). The surface expression of α5 (CD49e) was increased in CD82-deficient macrophages, particularly M2-stimulated cells (Figure 4D). By contrast, α4 (CD49d) was unchanged between WT and CD82-deficient macrophages (Figure 4E). Taken together, this suggests that CD82 plays a key role in the surface expression of integrins such as α5 in M2-activated macrophages, where the absence of CD82 leads to aberrant cytoskeletal rearrangement and decreased filopodia projections following IL-4 and IL-13 stimulation.
Figure 4.

Activation to anti-inflammatory M2 phenotype is blunted in CD82-deficient macrophages
Macrophages were differentiated in vitro from the bone marrow of WT and Cd82−/− mice. After 7 days differentiation, macrophages were either left unstimulated (“Unstim.”) or activated to an anti-inflammatory “M2” phenotype with IL-4 and IL-13, or a pro-inflammatory “M1” phenotype with LPS and IFNγ, for a further 24 h.
(A) Macrophage morphology was measured by confocal fluorescence microscopy where rhodamine-phalloidin (gray) was used to stain actin filaments in WT and Cd82−/− macrophages activated in all conditions for 24 h. Nuclei were visualized with Hoeschst33342 (blue). Scale bars 20 μm. Dashed squares indicate insets shown in C.
(B) The circularity of WT and Cd82−/− macrophages was measured by the analysis of images from (A) with ImageJ. Each dot represents an individual cell from one representative experiment.
(C) Inset images of IL-4+IL-13-stimulated macrophages from (A).
(D) WT and Cd82−/− macrophages were activated as before and the surface expression of α5 (CD49e) and α4 (CD49d) was assessed by flow cytometry. Histograms of expression levels are shown with quantification of the geometric mean fluorescence intensity (bars).
(F–I) Anti-inflammatory macrophage activation after 24 h was measured by the mRNA expression of the signature genes arginase (Arg1; F) and mannose receptor (Mrc1; G), while pro-inflammatory macrophage activation was measured by the mRNA expression of nitric oxide synthase (Nos2; H) and tumor necrosis factor alpha (Tnfa; I).
(J–O) Mitochondrial metabolism of WT and Cd82−/− macrophages after activation for 24 h was measured by a Seahorse extracellular flux bioanalyser. (J and K) Representative oxygen consumption rate (OCR) profile over time of WT (J) and Cd82−/− (K) macrophages in response to sequential injections of oligomycin (“O”), FCCP (“F”) and antimycin A plus rotenone (“A + R”). (L) Basal energy (OCR versus ECAR) profile of WT and Cd82−/− macrophages. (M) Basal OCR of WT and Cd82−/− macrophages was calculated from profiles in J and K. WT macrophages showed typical responses where anti-inflammatory (IL-4 + IL-13) activation resulted in elevated OCR while pro-inflammatory (LPS + IFNγ) activation had decreased OCR. M2 Cd82−/− macrophages show blunted basal OCR. (N) Basal ECAR is a measure of cellular glycolytic metabolism. WT and Cd82−/− macrophages both exhibited similar increase in glycolysis. By contrast, Cd82−/− M2 macrophages again showed blunted basal ECAR. (O) The spare respiratory capacity (SRC) of WT and Cd82−/− macrophages was calculated from profiles in J and K. For all experiments (A–O), each dot represents technical replicates which were repeated in two independent experiments, where BMDMs were differentiated from separate mice. All data are presented as mean ± SEM. p values for the effect of CD82 deficiency and interaction with macrophage activation were calculated by 2-way ANOVA and is indicated in the top left corner of each graph. Additionally, Sidak post-hoc multiple comparison analysis of individual time points is indicated by ∗p < 0.05; ∗∗p < 0.01; ∗∗∗p < 0.001; ∗∗∗∗p < 0.0001. See also Figure S4.
We next wondered whether the morphological changes in CD82-deficient M2 macrophages corresponded to other biological defects. The activation of M2 and M1 macrophages is also characterized by the expression of a suite of specific signature genes: WT macrophages activated to M2 increase expression of arginase (Arg1) and mannose receptor (Mrc1), while nitric oxide synthase (Nos2) and tumor necrosis factor alpha (Tnfa) is potently induced when activated to M1 (Figures 4F–4I). However, IL-4- and IL-13-stimulated Cd82−/− macrophages had a blunted expression of Arg1 and Mrc1, while the expression of Nos2 and Tnfa was unchanged (Figures 4F–4I). This is in line with our morphological analyses which also show that CD82 is involved in the response of macrophages to the anti-inflammatory cues IL-4 and IL-13. Cellular metabolism is also a critical factor in macrophage activation, where the acquisition of specific phenotypes is underpinned by the reprogramming of metabolic pathways and nutrient uptake. We differentiated WT and Cd82−/− macrophages, activated them to M2 and M1 as before, and analyzed their mitochondrial (oxygen consumption rate, OCR) and glycolytic metabolism (extracellular acidification rate, ECAR) with a Seahorse Bioanalyser (Figures 4J and 4K). In line with previous studies, activation of WT macrophages to M2 resulted in increased OCR reflecting enhanced utilization of mitochondrial respiration, while activation to M1 increased the extracellular acidification rate (ECAR) while simultaneously suppressing OCR, which is indicative of dependence on glycolytic metabolism (Figures 4J–4N). We next compared the basal OCR and ECAR of WT and Cd82−/− macrophages. M1-activated CD82-deficient macrophages had typical decreases in oxidative metabolism and increased glycolysis and the level of these responses were no different from their WT-activated counterparts (Figures 4M and 4N). By contrast, basal OCR was altered in Cd82−/− macrophages which did not have increased mitochondrial respiration (Figure 4M) nor glycolysis (Figure 4N). However, this blunting in mitochondrial oxidative respiration was not associated with a change in the spare respiratory capacity (SRC), suggesting that the reduced metabolic output reflects suboptimal metabolic reprogramming or nutrient uptake, and not because of structural alterations to mitochondrial capacity (Figure 4O). Altogether, these in vitro findings point toward a specific role in CD82 in the response to the anti-inflammatory cues IL-4 and IL-13.
Discussion
The migration and function of phagocytes within tissues needs to be tightly controlled so that inflammation is appropriate to the threat at hand. Identification of molecules and mechanisms that regulate these processes is therefore attractive targets to promote specific phagocytic processes. Our findings here point toward two roles for the tetraspanin CD82 in phagocyte biology: restraining migration into tissues (Figures 1, 2, and 3) and supporting the differentiation of macrophages into specific anti-inflammatory phenotypes (Figure 4).
We show here that CD82-deficient phagocytes infiltrate tissues in greater numbers in multiple disease models, and our finding that Cd82−/− neutrophils display enhanced migration in vitro suggest this is phagocyte-intrinsic. The molecular events that steer phagocyte recruitment are known collectively as the leukocyte adhesion cascade, a sequence of molecular interactions between surface adhesion receptors such as integrins on phagocytes and their ligands on the endothelium and the extracellular matrix within tissues. Adhesion mediated by these phagocyte integrins results in the molecular reorganization of the cytoskeleton—permitting the phagocyte to emigrate into the tissue and act upon the threat at hand. There are already many reports that CD82 can molecularly organize and regulate integrins and cytoskeletal signaling in immune cells (Lagaudrière-Gesbert et al., 1998; Shibagaki et al., 1999; Delaguillaumie et al., 2004; Termini et al., 2014; Jones et al., 2016). We show here that CD82 ablation particularly affects the expression of α5 in anti-inflammatory-activated macrophages (Figure 4D), an integrin reported to have a molecular and functional link with CD82 in human breast, colorectal, and ovarian cancers (Luan et al., 2018; Li et al., 2020). α5 integrin is also proposed to be important in macrophage migration (Hoffmann and Ponik, 2020). This was also concomitant with an increased circularity of these cells, due to a reduced formation of filopodia protrusions. The formation of filopodia in “M2” macrophages has been shown to be regulated by Cdc42 (Allen et al., 1997; Vogel et al., 2014; Horsthemke et al., 2017) resulting in activation of the Rho GTPases RhoA and ROCK, where deficiency of ROCK1 in neutrophils and macrophages increased their migration into the inflamed peritoneum (Vemula et al., 2010). In epithelial cells, the initiation of filopodia is driven by the formation of small protrusions denoted “sticky fingers”, enriched with a protein complex comprised of integrins, Rap1-GTP-interacting adaptor molecule (RAIM), and talin, which directly interacts with the actin cytoskeleton (Lagarrigue et al., 2015). We can only speculate that deletion of CD82 dysregulates formation of a complex such as this, resulting in Cd82−/− macrophages having deficient formation of filopodia, resulting in the impaired adhesion and transmigration of CD82-deficient phagocytes observed by intravital microscopy. To better understand the molecular mechanisms underlying the cellular responses presented in this study, it will be important in future studies to identify the specific partner proteins organized by CD82 within filopodia microdomains on the plasma membranes of macrophages.
We also observed that CD82 ablation blunted the differentiation of macrophages into the anti-inflammatory M2 phenotype. We observed morphological differences in M2 Cd82−/− macrophages that were associated with a quiescent metabolic phenotype and impaired expression of classical M2 markers compared to their WT counterparts. There is emerging evidence that the interaction of immune cells with their environment augments their activation and metabolism. In dendritic cells, stiffness of culture conditions correlates with the amount of glycolysis and oxidative respiration and augments TNF-α secretion in response to LPS (Chakraborty et al., 2021). In macrophages, substrate stiffness is also a critical determinant of function, mediated by actin polymerization (Patel et al., 2012). Conversely, actin polymerization in macrophages is tightly linked to nutrient availability where deficiency in glucose or treatment with mitochondrial respiration inhibitors perturbs cytoskeletal remodeling and the formation of filopodia (Venter et al., 2014). This connection between surface interaction, cytoskeletal remodeling, and metabolism extends beyond central carbon metabolism. Micropatterned substrates that force macrophage morphology into elongated “M2” shapes increased the expression of arginase, an enzyme in the arginine-urea cycle, as well as other markers of anti-inflammatory macrophage activation (McWhorter et al., 2013). Altogether, these studies provide a prima facie case connecting the morphological abnormalities of Cd82−/− M2 macrophages with their reduced metabolic output.
Considering these two roles for CD82 in phagocyte biology, analyses of the contribution of CD82 to the pathogenesis of the clinically relevant animal models of inflammation suggest a complex, yet important role. Unlike other leukocyte-expressed tetraspanins CD37 and CD53, CD82 restrains rather than promotes leukocyte recruitment to inflammatory lesions (Jones et al., 2016; Demaria et al., 2020; Yeung et al., 2020). In both the OIR and Leishmania infection models, we show that increased number of macrophages correlates with exacerbated pathology (Figures 2 and 3). The cellular and molecular mechanisms that drive pathogenesis in OIR are complex, only partially understood and likely involve a complex interplay between angiogenic factors, endothelial cells, infiltrating immune cells, neurons, and glial cells (Scott and Fruttiger, 2010). Macrophage phenotype may play a role in this pathology, where “M1” cells are detected early in disease and subsequently replaced by cells expressing “M2” markers (Zhu et al., 2017; Li et al., 2021). In the case of leishmaniasis, increased infiltration of macrophages also exacerbated this pathology resulting in larger and sustained cutaneous lesions. We also observed that Cd82−/− macrophages had a decreased ability to clear intracellular parasites in vitro. Here, we note that CD82 has been reported to be required for TLR9 function and signaling (Khan et al., 2019) and TLR9 is required for immunity to infection with L. amazonensis (Pratti et al., 2019), suggesting that Cd82−/− macrophages exposed to Leishmania may not become properly activated to eliminate the infection. Additionally, while immunity to Leishmania infection is commonly thought to be dependent on T cell immunity that activates macrophages to become efficient killers of ingested pathogens, genetic analyses have reported that the wound repair response can also control outcome to cutaneous leishmaniasis (Sakthianandeswaren et al., 2005). Therefore, the prolonged lesions observed in Leishmania-infected Cd82−/− mice may instead reflect an inability to generate functional anti-inflammatory M2 macrophages that can promote the wound repair response.
Altogether, our study indicates that CD82 supports macrophage biology by coordinating the expression of diverse membrane proteins that are critical for their transmigration into tissues and activation into specific effector functions. While we have focused here on infiltrating monocyte-derived macrophages, it may be that CD82 also is important for the function of embryonic-derived self-renewing tissue-resident macrophages. This is already evident in studies by the Miranti group which observe Cd82−/− osteoclasts to have dysregulated fusion, morphology, and a reduced ability to degrade collagen (Bergsma et al., 2018, 2019). A recent study showed the differentiation of human-induced pluripotent stem cells into microglia-like macrophages was concurrent with the upregulation of CD82 and other tetraspanins including CD9, CD53, and CD82 (Takata et al., 2017). This suggests an essential, but understudied, role for tetraspanins in tissue-resident macrophage biology. Presumably, this role is mediated via the organization of specific surface proteins such integrins which sense and interact with tissue niches.
Limitations of the study
It is challenging to reconcile the results from the leishmaniasis model (Figure 3), where increased leukocyte migration might be expected to enhance clearance of the intracellular parasite, while in the OIR model, increased macrophage recruitment in Cd82−/− was coincident with increased pathology (Figure 2). Our observations of an increase in pathology in Cd82−/− retinas in the OIR model agree with those published by Wei et al., who concluded that CD82 had an important role in regulating endothelial cell migration and restraining pathological angiogenesis (Wei et al., 2014). While the data in Figures 1G and 4 point to phagocyte-intrinsic phenotypes, it is possible that the deletion of CD82 from endothelial cells also contributes to the impaired leukocyte recruitment and exacerbated pathology reported in this paper. Myeloid-specific deletion of CD82 using conditional knockouts will be important to better understand these conflicts. Moreover, this study only examined the mRNA expression of Arg1 and Mrc1, and Nos2 and Tnfa, as markers for pro- and anti-inflammatory macrophage activation, respectively. Confirming the protein levels of these markers is necessary to further validate these findings. Furthermore, future work to identify the protein molecular partners of CD82 in macrophages will be important to provide direct mechanistic insights into the activation phenotypes induced by CD82 deficiency.
STAR★Methods
Key resources table
| REAGENT or RESOURCE | SOURCE | IDENTIFIER |
|---|---|---|
| Antibodies | ||
| Anti-mouse CD11b-FITC (M1/70) | In-house | |
| Anti-mouse CD11b-AF700 (M1/70) | BD Biosciences | Cat# 557960, RRID: AB_396960 |
| Anti-mouse CD11b-APC (M1/70) | BioLegend | Cat# 10128 |
| Anti-mouse CD11b-PE-e610 | eBioscience | Cat# 61-0112-82, RRID: AB_2574528 |
| Anti-mouse CD11c-PE-Cy7 (HL3) | BD Biosciences | Cat# 558079, RRID: AB_647251 |
| Anti-mouse CD16/32 | eBioscience | Cat# 14-0161-86, RRID: AB_467135 |
| Anti-mouse CD19-FITC (1D3) | BD Biosciences | Cat# 561740, RRID: AB_10893811 |
| Anti-mouse CD45-APC-e780 (30-F11) | eBioscience | Cat# 47-0454-82, RRID: AB_1272175 |
| Anti-mouse CD45-e506 | eBioscience | Cat# 69-0454-82, RRID: AB_2637105 |
| Anti-mouse CD64-PerCP-e710 | eBioscience | Cat# 46-0641-82, RRID: AB_2735016 |
| Anti-mouse F4/80-PE (CI:A3-1) | Cedarlane labs | Cat# CL8940PE, RRID: AB_10060422 |
| Anti-mouse F4/80-A647 (T45-2342) | BD Biosciences | Cat# 565853, RRID: AB_2744474 |
| Anti-mouse Gr1-PE (RB6-8C5) | BD Biosciences | Cat# 553128, RRID: AB_394644 |
| Anti-mouse Ly6C-Biotin (AL-21) | BD Biosciences | Cat# 557359, RRID: AB_396663 |
| Anti-mouse Ly6C-BV605 (AL-21) | BD Biosciences | Cat# 563011, RRID: AB_2737949 |
| Anti-mouse Ly6G-AF700 (1A8) | BD Biosciences | Cat# 561236, RRID: AB_10611860 |
| Anti-mouse Ly6G-PE (1A8) | BD Biosciences | Cat# 551461, RRID: AB_394208 |
| Anti-mouse Ly6G-APC (1A8) | BD Biosciences | Cat# 560599, RRID: AB_172756 |
| Anti-mouse MHCII-BV786 (M5/114.15) | BD Biosciences | Cat# 742894, RRID: AB_2734759 |
| Anti-mouse TCRβ-e450 (H57-597) | eBioscience | Cat# 48-5961-82, RRID: AB_11039532 |
| Anti-mouse Iba-1 | Wako, Japan | N/A |
| Goat anti-rabbit IgG H&L-AF568 | Life Technologies | N/A |
| Anti-rabbit IgG-biotin | Dako Cytomation | N/A |
| Chemicals, peptides, and recombinant proteins | ||
| Sodium pentobarbitone | Virbac, Peakhurst, Australia | N/A |
| Liquid DAB+ Substrate Chromagen System | Dako | K3468 |
| Collagenase from clostridium histolyticum | Sigma Aldrich | C5138 |
| Deoxyribonuclease I | Sigma Aldrich | DN25 |
| LIVE/DEAD Fixable Aqua | Invitrogen | L34957 |
| Fixable Viability eFluor 780 | eBioscience | 65-0865-14 |
| Sodium thioglycollate | Sigma Aldrich | T0632 |
| FITC-isolectin B4 (from Bandeiraea simplicifolia (Griffonia simplicifolia)) | Sigma Aldrich | L2895 |
| Hoescht33342 | ThermoFisher | H1399 |
| Alexa 488-Phalloidin | Invitrogen | A12379 |
| DePeX mounting medium | VWR International Ltd., Poole, England | SERA18243.01 |
| Mouse recombinant KC (CXCL1) | Peprotech | 250-11 |
| Mouse recombinant CSF-1 | Peprotech | 315-02 |
| Mouse recombinant IL-4 | eBiosciences | 14-8041-80 |
| Mouse recombinant IL-13 | eBiosciences | 14-8131-80 |
| Mouse recombinant IFN-γ | eBiosciences | 14-8311-63 |
| LPS-EB Ultrapure | Invivogen | Tlrl-3pelps |
| Critical commercial assays | ||
| Vectastain ABC kit, standard | Vector Laboratories | PK-4000 |
| Mouse albumin ELISA kit | Bethyl Laboratories, Mongomery, TX, USA | E99-134 |
| Experimental models: Organisms/strains | ||
| WT C57Bl/6 | In-house breeding, Animal Research Laboratories, Clayton, Australia | N/A |
| Cd82−/− C57Bl/6 | In-house breeding, Animal Research Laboratories, Clayton, Australia | N/A |
| L. mexicana | In-house propagation | N/A |
| L. mexicanaTurboRFP | In-house propagation | N/A |
| Oligonucleotides | ||
| Arginase 1 (Arg1)-forward primer: CCACAGTCTGGCAGTTGGAA | Bioneer Pacific | N/A |
| Arginase 1 (Arg1)-reverse primer: GCATCCACCCAAATGACACA | Bioneer Pacific | N/A |
| Arginase 1 (Arg1)-probe: FAM-TGGCCACGCCAGGGTCCAC-TAMRA |
Bioneer Pacific | N/A |
| Mannose receptor (Mrc1)-forward primer: AATACCTTGAACCCATTTATCATTCC | Bioneer Pacific | N/A |
| Mannose receptor (Mrc1)-reverse primer: GCATAGGGCCACCACTGATT | Bioneer Pacific | N/A |
| Mannose receptor (Mrc1)-probe: FAM-CGATGTGCCTACCGGCTGCCC-TAMRA |
Bioneer Pacific | N/A |
| Nitric oxide synthase (Nos2)-forward primer: GGGCAGCCTGTGAGACCTT | Bioneer Pacific | N/A |
| Nitric oxide synthase (Nos2)-reverse primer: TGCATTGGAAGTGAAGCGTTT | Bioneer Pacific | N/A |
| Nitric oxide synthase (Nos2)-probe: FAM- TCCGAAGCAAACATCACATTCAGATCCC-TAMRA |
Bioneer Pacific | N/A |
| Software and algorithms | ||
| FlowJo | TreeStar Inc, OR, USA | N/A |
| GraphPad Prism (version 6) | San Diego, CA USA | N/A |
| ImageJ | NIH, MA, USA | N/A |
| Other | ||
| PROOX 110 gas regulator | Reming Bioinstruments Co., Redfield NY USA | N/A |
| Nikon A1 laser scanning confocal microscope | Nikon Instruments Inc, Melville, NY, USA | N/A |
| Leica SP8 inverted confocal microscope | Leica Microsystems Pty Ltd, NSW, Australia | N/A |
| ZEISS LSM980 Axioplan 2 microscope | ZEISS Australia, North Ryde, NSW | N/A |
| LSR II Fortessa cell analyser | BD Biosciences Australia | N/A |
| Transwells 65 mm diameter 5.0 μm pore size | DKSH | 3421 |
| Caliper Vernier, Digital LCD | Westlab Pty Ltd | 080322-0003 |
Resource availability
Lead contact
Further information and requests for resources and reagents should be directed to and will be fulfilled by the lead contact, Katrina Binger (k.binger@latrobe.edu.au).
Materials availability
This study did not generate new unique reagents.
Experimental model and subject details
Ethics approval
All mice experiments were performed according to the National Health and Medical Research Council of Australia’s Guidelines for the Care of Animals in Scientific Research. Peritonitis, intravital microscopy and oxygen-induced retinopathy models were approved by the Alfred Research Alliance AS Animal Ethics Committee and the Monash Medical Center Animal Ethics Committee. Intradermal leishmaniasis model was approved by the University of Melbourne Animal Ethics Committee. Bone harvest for in vitro BMDM experiments were approved by the University of Melbourne Animal Ethics Committee and the La Trobe University Animal Ethics Committee.
Wildtype and Cd82−/− mice
All mice were of the C57/Bl6J genetic background. Cd82−/− mice were generated as previously described (Jones et al., 2016). C57Bl/6 wildtype (WT) controls and Cd82−/− mice were housed and bred under specific pathogen-free conditions from established colonies at the Animal Research Laboratories (Clayton, Victoria) and transported at the desired age or gestation either to the Monash Medical Center (Clayton, Victoria), AMREP precinct animal facilities (Prahran, Victoria), Bio21 MARP animal facilities (Parkville, Victoria) or La Trobe Animal and Teaching Facility (LARTF) (Bundoora, Victoria) for experimentation. Mice were allowed to recover from transport for ∼3–5 days before experimentation.
Thioglycollate-induced peritonitis
Male mice (8–12 weeks of age) were injected intraperitoneally (i.p.) with 0.5 mL of 3% (w/v) thioglycollate (Sigma-Aldrich) in PBS (PBS). Mice were culled after 24 and 72 h and cells harvested by peritoneal lavage. Total cells were counted and then the number of neutrophils (CD11b+ Ly6G+) and macrophages (F4/80+ Ly6Clo Ly6G−) was determined by flow cytometry.
Leukocyte recruitment by intravital microscopy
Leucocyte recruitment into the cremaster muscle in response to CXCL1 superfusion was measured by intravital microscopy as described previously (Wee et al., 2015; Yeung et al., 2020).
Oxygen-induced retinopathy (OIR)
Mouse pups (female and male) were kept in room air (RA) from birth until postnatal day (P) 6. To induce the first stage of OIR, characterised by vaso-obliteration and cessation of normal retinal growth, from P7 - P12 pups and their mothers were exposed each day to 75% O2 for 22 h with cycles of 20% O2 for 2 h. The second phase of OIR, which stimulates neovascularisation, was induced by returning pups and their mothers to room air for P12 to P18. Control mice were kept in room air for the entire experimental period (P0 to P18). At P18 all pups were euthanised by injection with sodium pentobarbitone (120 mg/kg) and eyes were enucleated for further analyses.
Parasite culture
L. mexicana WT and transgenic L. mexicana stably expressing the fluorescent protein TurboRFP (L. mexicanaTurboRFP) were cultured at 27°C in RPMI media pH 7.4 supplemented with 10% FCS. Promastigotes were passaged biweekly and only cultures <20 passages since isolation from infected lesions were used for infection. Amastigotes were generated by incubation in RPMI media pH 5.5 supplemented with 20% FCS for 4 days at 33°C 5% CO2.
Intradermal leishmaniasis
Female WT and Cd82−/− mice (6–7 weeks of age) were anesthetized (100 mg/kg ketamine, 10 mg/kg xylazine hydrochloride, i.p.) and a heat pad used to maintain body temperature. Using a dissecting microscope, 1 × 10⁶ stationary phase promastigotes were injected into the right ear (intradermally) in a final volume of 10 μL PBS with a 30G needle. Ears were inspected visually each week and lesion lengths were measured with a digital Vernier caliper.
Primary macrophage cultures
Primary cultures of bone-marrow derived macrophages (BMDM) were generated as described previously (Binger et al., 2015). Briefly, bone marrow cells were flushed from the femur and tibia of male WT and Cd82−/− mice (8–12 weeks of age), filtered through 70 μm cell strainers and cells were counted. Bone marrow cells (1 × 10⁶ cells/mL) in were resuspended into differentiation media containing DMEM (D6546, Sigma), 10% FCS, 5% Adult horse serum (H1138, Sigma), Non-essential amino acids (M7145, Sigma), 50 μM β-mercaptoethanol (M3148, Sigma), 1% penicillin/streptomycin (P/S) and 10 ng/mL recombinant colony stimulating factor (CSF)-1 (315-02, Peprotech) and incubated in tissue-culture treated T175 flasks at 37C 10% CO2 to remove contaminating fibroblasts. The next day, non-adhered cells were transferred into Teflon-coated bags and incubated at 37°C 10% CO2 for a further 6–7 days (Binger et al., 2015). After 7–8 days total incubation, a homogeneous culture of differentiated and adherent macrophages was visible. On day 4, surplus cells were frozen in 90% FBS with 10% DMSO for later use. Frozen cells were thawed and differentiated as above with recombinant CSF-1 for an additional 7 days. BMDMs were harvested by gently massaging Teflon bags to detach cell adhesion. BMDMs were counted and plated as required for microscopy, flow cytometry qPCR, or Seahorse extracellular flux assays.
Method details
Flow cytometry
Different methods were employed for each organ to prepare single-cell suspensions for flow cytometry analysis. Briefly, retinal tissue dissected from enucleated eyes was enzymatically digested with collagenase (1 mg/mL, Roche) and DNase I (1:100) in PBS for 30 min at 37C. Cutaneous lesions from L. mexicana-infected mice were dissected from ears using an 8 mm ø punch biopsy to ensure an equal amount of ear tissue was dissected per mouse. The ventral and dorsal layers were separated by forceps, cut into small pieces and enzymatically digested with collagenase (1.25 mg/mL) and DNase I (0.5 mg/mL) in Hank’s Balanced Salt Solution (HBSS) for 30 min at 37C. Draining right superficial cervical lymph nodes from L. mexicana-infected mice were dissected and enzymatically digested with collagenase (0.35 mg/mL) and DNase I (0.5 mg/mL) in HBSS for 30 min at 37°C. Peritoneal washes were simply filtered through cell strainers. All tissue samples were further mechanically broken by pipetting, and then dissociated single-cell samples were filtered through cell strainers, washed and resuspended in PBS containing 0.5% FBS and 0.5 mM EDTA (FACS buffer). Total cell counts for all tissues were measured with a hemocytometer.
For flow cytometry analyses, single-cell suspensions in PBS were stained with fixable viability dyes as per the manufacturer’s recommendation, followed by incubation with Fc block (1:50–1:200) in FACS buffer for 15 min. Cells were then incubated in the desired fluorescently-conjugated primary antibody cocktails and incubated at 4°C. Samples were subsequently washed with FACS buffer and analyzed with an LSRII flow cytometer (BD Biosciences). Data was analyzed using FlowJo software. For all tissues, results are presented as absolute cell numbers where the proportion of gated viable, single cells of interest was multiplied by the total tissue cell count. The exception was for cutaneous lesions as due to the significant debris in these samples total cell counts were unavailable and instead data is presented only as the proportion of gated viable, single cells of interest.
Transwell migration assays
Prior to each assay, Transwell plates were coated with fibrinogen (2.5 μg/mL) overnight before washing with PBS. Coated Transwells were stored dry at 4°C until use. Bone marrow cells were harvested from WT and Cd82−/− mice as before, and then layered onto discontinuous Percoll gradients (72% (v/v) and 64% (v/v)) and centrifuged at 2400 rpm for 30 min at 4°C. The band at 64–72% Percoll containing neutrophils was harvested, washed with media, and cells counted. Media containing chemoattractants (CXCL1, LTB4 or control) was added to the bottom chamber of the Transwell before Percoll-separated cells (5 × 10⁵/200 μL RPMI media) were applied to the top. Transwell plates were then incubated for 1 h at 37°C, after which EDTA (45 mM) was added to the bottom well and plates were incubated at 4C for a further 15 min. The number of migrated neutrophils was determined by harvesting cells from media in bottom wells and determining the proportion of Gr1+ cells by flow cytometry.
Retinal wholemounts
Retinas were carefully scraped out from eyecups, immersed in PBS and placed under a dissecting microscope. Four equally spaced radial cuts were made to flatten the retina into a shape of a Maltese cross. Retinal wholemounts were then fixed and permeabilised by incubation in 100% methanol for 10 min at −20°C, followed by 0.3% Triton X-100 for 1 h at room temperature. Retinas were then blocked with 10% normal goat serum for 1 h at room temperature, followed by incubation with anti-Iba-1 antibody (1:100) at 4°C overnight on an orbital shaker. After washing, Iba1+ cells within retinal wholemounts were visualised by incubation with fluorescently conjugated secondary antibody (goat anti-rabbit IgG-AF568; 1:400). Retinal vasculature was visualised by incubation with 1% fluorescein isothyiocyanate (FITC)-conjugated isolectin B4 (Biotinylated Griffonia (Bandeiraea) Simplicifolia, Sigma, USA) diluted in 0.1M PBS containing 1% Triton X-100 for 4 h at room temperature. Retinal wholemounts were viewed with a Nikon A1 laser scanning confocal microscope (Nikon Instruments Inc., Melville, New York, USA).
Retinal immunohistochemistry
Enucleated eyes were formalin-fixed then embedded in paraffin and then cut into 3 μm sections. Two to four sections were randomly selected at least 60 μm apart. Sections were dewaxed, re-hydrated, and then subjected to antigen retrieval in 0.1M citric acid buffer by microwaving. Sections were incubated in 3% hydrogen peroxide for 15 min, washed, and then blocked with 10% NGS for 45 min. Following blocking, sections were incubated with anti-Iba-1 antibody (1:1000) diluted in 10% normal goat serum at 4°C overnight. After washing, Iba1+ cells in retinal sections were visualised by incubation with a biotin-conjugated goat anti-rabbit IgG (1:200), followed by incubation with reagents from the Vectastain ABC standard kit (Vector Laboratories, Burlingame, California, USA) for 45 min, and chromogenic development by application of liquid DAB+ (Dakocytomation) for 30–40 s. Sections were then counterstained with haematoxylin and visualised by light microscopy. For each section, 6 to 10 non-overlapping fields were captured at x400 magnification using a Spot digital camera (SciTech, Preston, VIC, Australia). ImageJ software was then used to set a threshold for brown Iba-1 immunolabelling, which was then applied to all captured fields. Iba-1 immunolabelling was quantified for each field using the threshold tool, and results expressed as percentage Iba-1 immunolabelling per field of total retina area.
Albumin
Dissected and snap frozen retinas were lysed in RIPA buffer (Sigma) containing a cocktail of protease and phosphate inhibitors (1:100, Sigma). Total protein concentration in soluble retinal lysates was measured by Bradford assay (Biorad). Retinal albumin levels were assayed in triplicate with a mouse albumin ELISA kit (Bethyl Laboratories, Montgomery, TX, USA) according to the manufacturer’s instructions. Retinal albumins levels were expressed as nanogram of total retinal albumin per milligram of total retinal protein, and values expressed as a fold change compared to room air controls. Because of the small size of neonatal mice especially those with OIR, we were technically unable to perfuse mice prior to albumin measurements.
In vitro L. mexicana infection
WT and Cd82−/− BMDMs were plated into non-treated 96-well plates at a density of 110,000 cells/well. After adhering overnight at 33°C, BMDMs were co-incubated with amastigotes stably expressing TurboRFP at a multiplicity of infection of 3:1 for 4 h. Extracellular parasites were removed by washing, and macrophages were then incubated at 33°C 5% CO2 for a further 3 days. After this, infected macrophages were gently detached from plates by consecutive incubations with Accutase and 5 mM EDTA in PBS at 37°C for 5–10 min. Single cell suspensions were then stained with fixable/viability dyes, anti-F4/80 and anti-CD11b, and analyzed by flow cytometry. Infected macrophages were denoted as SSChiFSChiF4/80+CD11b+TurboRFP-H+, uninfected macrophages as SSChiFSChiF4/80+CD11b+TurboRFP-H-, while extracellular parasites were excluded from gating. Data was analyzed using FlowJo software where infected macrophages are expressed as the percentage of gated viable, single macrophages. An approximation of the number of parasites per cell (parasitic burden) was calculated by determining the TurboRFP geometric mean fluorescence intensity (gMFI) of uninfected macrophages and subtracting this from the TurboRFP gMFI of infected macrophages. Parasitic index was calculated by multiplying the proportion of infected macrophages by the parasitic burden.
BMDM confocal microscopy
WT and Cd82−/− BMDM were seeded in RPMI media (10% FCS, 1% P/S) onto fibronectin-coated glass coverslips. After adhering for 4 h at 37°C 5% CO2, cells were stimulated either with LPS (10 ng/mL) and IFN-γ (10 ng/mL) or IL-4 (10 ng/mL) and IL-13 (ng/mL), and incubated for a further 24 h. Cells were then stained with Rhodamine-conjugated phalloidin (100 nM; Invitrogen) as per the manufacturer’s directions. Nuclei were stained with Hoescht33342 (10 ng/mL). Cells were imaged on a Zeiss LSM 780 confocal microscope with a 63X objective. A 5 × 5 series of tiled images was taken, with at least 5 images captured per coverslip, resulting in the imaging of ∼50–200 cells per condition. A semiautomated script was written using the open-source software Fiji (Schindelin et al., 2012). Briefly, this script first stitched together the series of tiled images and determined a threshold for the pixel intensity of the Hoescht33342 fluorescence which was used for quantification analysis to segment and count the total number of BMDM. A threshold for the fluorescence from the rhodamine-phalloidin signal was then set per condition and used to measure the perimeter and area of each cell. Finally, these were used to calculate the circularity of each cell, given by the formula .
BMDM flow cytometry
WT and Cd82−/− BMDM were seeded at 1.5 × 10⁵ cells/well in non-tissue culture treated 96-well plates and activated as before. After 24 h, cells were detached by incubation with PBS containing 5 mM EDTA at 37°C for 5 min. Single cell suspensions were then stained with fixable/viability dyes, and the desired fluorescent conjugated antibodies, and analyzed by flow cytometry. Single, viable, macrophages (F4/80+CD11b+) were gated and the expression of surface proteins was determined by calculating the geometric mean fluorescence intensity (gMFI) of their respective fluorescent signals.
BMDM real-time qPCR
WT and Cd82−/− BMDM were seeded at 1.5 × 10⁵ cells/well in a 96-well plate and activated as before. After 24 h, cells were lysed, RNA extracts reversed transcribed into cDNA, and quantitative analysis of mRNA levels by real-time qPCR was performed according to the method by Kantharidis et al. (2015). The expression levels of target genes (Arg1, Mrc1, Nos2, Tnfa) was normalised by the expression of 18S. Primer sequences are detailed in the key resources table.
BMDM extracellular bioanalysis
The cellular metabolism of WT and Cd82−/− BMDMs was measured with a Seahorse XFe96 Bioanalyser as previously described (Souza et al., 2019). Briefly, BMDMs (8 × 10⁴ cells) were attached to Seahorse microplates and exchanged into Seahorse media (Phenol-free RPMI pH 7.4 with 10 mM glucose, 2 mM glutamine, 1 mM pyruvate; all Agilent Technologies). The oxygen consumption rate (OCR) and extracellular acidification rate (ECAR) of cells was monitored in real time in response to the sequential injection of oligomycin (final concentration 1 μM), carbonyl cyanide-p-trifluoromethoxyphenylhydraxone (FCCP; 1.5 μM), and antimycin A (1 μM) plus rotenone (100 nM). For normalisation, the number of cells per well was counted by imaging of wells with a Cytation5 bioimager. Brightfield images were acquired before the experiment, after which nuclei were stained with Hoeschst33342 and fluorescence images acquired for automated analysis of cell number.
Quantification and statistical analysis
Individual data replicates are shown where possible together with bar charts which represent the mean ± SE mean (SEM). GraphPad Prism (version 6) was used to analyze data for statistical significance. Normality of data was first assessed according to the Kolmogorov-Smirnov test, and then analyzed by t-tests (parametric) or Mann-Whitney U-tests (non-parametric). For analysis of two or more groups a one-way ANOVA(parametric) or Kruskal-Wallis (non-parametric) test was performed. For analysis of differences between groups over time, a two-way ANOVA was performed. Significant outcomes (p < 0.05) between groups by one-way and two-way ANOVA was determined by appropriate post hoc comparisons. All tests were two-sided. For in vivo experiments, no animals were excluded from the analysis and in most cases, experiments were repeated twice independently, and then pooled (as indicated in figure legends). For in vitro experiments, outliers were excluded by a Grubbs’ test. In vitro experiments were performed with an appropriate number of technical replicates to obtain statistical power, and repeated at least three times with separate mice (biological replicates). Figure legends describe the number of animals or technical replicates used, how many times the experiment was repeated, and whether the data is presented as a representative or pooled from separate experiments.
Acknowledgments
This work was supported by the National Health and Medical Research Council (NHMRC), and internal funding from the University of Melbourne, Monash University and La Trobe University. The authors would like to acknowledge the Melbourne Advanced Microscopy Facility (University of Melbourne, Australia) and the La Trobe Bioimaging Facility (La Trobe University, Australia).
Author contributions
ENSM, OW, EJ, JN, JW, MCD, DD, CJJ, MJH, and KJB – conducted experiments and analyzed data; MJH, MJM, JLWB, MDW, and KJB – acquired funding, conceived study, supervised project; MDW and KJB – wrote and edited manuscript. All authors saw and approved a final version of the manuscript before submission.
Declaration of interests
The authors declare no competing interests.
Published: July 15, 2022
Footnotes
Supplemental information can be found online at https://doi.org/10.1016/j.isci.2022.104520.
Contributor Information
Mark D. Wright, Email: mark.wright@monash.edu.
Katrina J. Binger, Email: k.binger@latrobe.edu.au.
Supplemental information
Data and code availability
Data reported in this paper will be shared by the lead contact upon request. This paper does not report original code. Any additional information required to reanalyse the data reported in this paper is available from the lead contact upon request.
References
- Allen W.E., Jones G.E., Pollard J.W., Ridley A.J. Rho, Rac and Cdc42 regulate actin organization and cell adhesion in macrophages. J. Cell Sci. 1997;110(Pt 6):707–720. doi: 10.1242/jcs.110.6.707. [DOI] [PubMed] [Google Scholar]
- Bergsma A., Ganguly S.S., Dick D., Williams B.O., Miranti C.K. Global deletion of tetraspanin CD82 attenuates bone growth and enhances bone marrow adipogenesis. Bone. 2018;113:105–113. doi: 10.1016/j.bone.2018.05.020. [DOI] [PubMed] [Google Scholar]
- Bergsma A., Ganguly S.S., Wiegand M.E., Dick D., Williams B.O., Miranti C.K. Regulation of cytoskeleton and adhesion signaling in osteoclasts by tetraspanin CD82. Bone Rep. 2019;10:100196. doi: 10.1016/j.bonr.2019.100196. [DOI] [PMC free article] [PubMed] [Google Scholar]
- Binger K.J., Gebhardt M., Heinig M., Rintisch C., Schroeder A., Neuhofer W., Hilgers K., Manzel A., Schwartz C., Kleinewietfeld M., et al. High salt reduces the activation of IL-4- and IL-13-stimulated macrophages. J. Clin. Invest. 2015;125:4223–4238. doi: 10.1172/JCI80919. [DOI] [PMC free article] [PubMed] [Google Scholar]
- Chakraborty M., Chu K., Shrestha A., Revelo X.S., Zhang X., Gold M.J., Khan S., Lee M., Huang C., Akbari M., et al. Mechanical stiffness controls dendritic cell metabolism and function. Cell Rep. 2021;34:108609. doi: 10.1016/j.celrep.2020.108609. [DOI] [PubMed] [Google Scholar]
- Delaguillaumie A., Harriague J., Kohanna S., Bismuth G., Rubinstein E., Seigneuret M., Conjeaud H. Tetraspanin CD82 controls the association of cholesterol-dependent microdomains with the actin cytoskeleton in T lymphocytes. Relevance to co-stimulation. J. Cell Sci. 2004;117:5269–5282. doi: 10.1242/jcs.01380. [DOI] [PubMed] [Google Scholar]
- Deliyanti D., Talia D.M., Zhu T., Maxwell M.J., Agrotis A., Jerome J.R., Hargreaves E.M., Gerondakis S., Hibbs M.L., Mackay F., Wilkinson-Berka J.L. Foxp3+ Tregs are recruited to the retina to repair pathological angiogenesis. Nat. Commun. 2017;8:748. doi: 10.1038/s41467-017-00751-w. [DOI] [PMC free article] [PubMed] [Google Scholar]
- Demaria M.C., Yeung L., Peeters R., Wee J.L., Mihaljcic M., Jones E.L., Nasa Z., Alderuccio F., Hall P., Smith B.C., et al. Tetraspanin CD53 promotes lymphocyte recirculation by stabilizing L-selectin surface expression. iScience. 2020;23:101104. doi: 10.1016/j.isci.2020.101104. [DOI] [PMC free article] [PubMed] [Google Scholar]
- Gao X., Wang Y.-S., Li X.-Q., Hou H.-Y., Su J.-B., Yao L.-B., Zhang J. Macrophages promote vasculogenesis of retinal neovascularization in an oxygen-induced retinopathy model in mice. Cell Tissue Res. 2016;364:599–610. doi: 10.1007/s00441-015-2353-y. [DOI] [PubMed] [Google Scholar]
- Gogoi M., Datey A., Wilson K.T., Chakravortty D. Dual role of arginine metabolism in establishing pathogenesis. Curr. Opin. Microbiol. 2016;29:43–48. doi: 10.1016/j.mib.2015.10.005. [DOI] [PMC free article] [PubMed] [Google Scholar]
- Greter M., Lelios I., Croxford A.L. Microglia versus myeloid cell nomenclature during brain inflammation. Front. Immunol. 2015;6:249. doi: 10.3389/fimmu.2015.00249. [DOI] [PMC free article] [PubMed] [Google Scholar]
- Harris E.S., Weyrich A.S., Zimmerman G.A. Lessons from rare maladies. Leukocyte adhesion deficiency syndromes. Curr. Opin. Hematol. 2013;20:16–25. doi: 10.1097/MOH.0b013e32835a0091. [DOI] [PMC free article] [PubMed] [Google Scholar]
- He B., Liu L., Cook G.A., Grgurevich S., Jennings L.K., Zhang X.A. Tetraspanin CD82 attenuates cellular morphogenesis through down-regulating integrin α6-mediated cell adhesion. J. Biol. Chem. 2005;280:3346–3354. doi: 10.1074/jbc.M406680200. [DOI] [PubMed] [Google Scholar]
- Hellström A., Smith L.E.H., Dammann O. Retinopathy of prematurity. Lancet. 2013;382:1445–1457. doi: 10.1016/S0140-6736(13)60178-6. [DOI] [PMC free article] [PubMed] [Google Scholar]
- Heyworth P.G., Cross A.R., Curnutte J.T. Chronic granulomatous disease. Curr. Opin. Immunol. 2003;15:578–584. doi: 10.1016/s0952-7915(03)00109-2. [DOI] [PubMed] [Google Scholar]
- Hoffmann E.J., Ponik S.M. Biomechanical contributions to macrophage activation in the tumor microenvironment. Front. Oncol. 2020;10:787. doi: 10.3389/fonc.2020.00787. [DOI] [PMC free article] [PubMed] [Google Scholar]
- Horsthemke M., Bachg A.C., Groll K., Moyzio S., Müther B., Hemkemeyer S.A., Wedlich-Söldner R., Sixt M., Tacke S., Bähler M., Hanley P.J. Multiple roles of filopodial dynamics in particle capture and phagocytosis and phenotypes of Cdc42 and Myo10 deletion. J. Biol. Chem. 2017;292:7258–7273. doi: 10.1074/jbc.M116.766923. [DOI] [PMC free article] [PubMed] [Google Scholar]
- Jones E.L., Demaria M.C., Wright M.D. Tetraspanins in cellular immunity. Biochem. Soc. Trans. 2011;39:506–511. doi: 10.1042/BST0390506. [DOI] [PubMed] [Google Scholar]
- Jones E.L., Wee J.L., Demaria M.C., Blakeley J., Ho P.K., Vega-Ramos J., Villadangos J.A., van Spriel A.B., Hickey M.J., Hämmerling G.J., Wright M.D. Dendritic cell migration and antigen presentation are coordinated by the opposing functions of the tetraspanins CD82 and CD37. J. Immunol. 2016;196:978–987. doi: 10.4049/jimmunol.1500357. [DOI] [PubMed] [Google Scholar]
- Kantharidis P., Hagiwara S., Brennan E., McClelland A.D. Study of microRNA in diabetic nephropathy. Isolation, quantification and biological function. Nephrology. 2015;20:132–139. doi: 10.1111/nep.12374. [DOI] [PubMed] [Google Scholar]
- Kaye P., Scott P. Leishmaniasis. Complexity at the host-pathogen interface. Nat. Rev. Microbiol. 2011;9:604–615. doi: 10.1038/nrmicro2608. [DOI] [PubMed] [Google Scholar]
- Khan N.S., Lukason D.P., Feliu M., Ward R.A., Lord A.K., Reedy J.L., Ramirez-Ortiz Z.G., Tam J.M., Kasperkovitz P.V., Negoro P.E., et al. CD82 controls CpG-dependent TLR9 signaling. FASEB J. 2019;33:12500–12514. doi: 10.1096/fj.201901547R. [DOI] [PMC free article] [PubMed] [Google Scholar]
- Lagarrigue F., Vikas Anekal P., Lee H.-S., Bachir A.I., Ablack J.N., Horwitz A.F., Ginsberg M.H. A RIAM/lamellipodin-talin-integrin complex forms the tip of sticky fingers that guide cell migration. Nat. Commun. 2015;6:8492. doi: 10.1038/ncomms9492. [DOI] [PMC free article] [PubMed] [Google Scholar]
- Lagaudrière-Gesbert C., Lebel-Binay S., Hubeau C., Fradelizi D., Conjeaud H. Signaling through the tetraspanin CD82 triggers its association with the cytoskeleton leading to sustained morphological changes and T cell activation. Eur. J. Immunol. 1998;28:4332–4344. doi: 10.1002/(SICI)1521-4141(199812)28:12<4332::AID-IMMU4332>3.0.CO;2-8. [DOI] [PubMed] [Google Scholar]
- Li J., Xu J., Li L., Ianni A., Kumari P., Liu S., Sun P., Braun T., Tan X., Xiang R., Yue S. MGAT3-mediated glycosylation of tetraspanin CD82 at asparagine 157 suppresses ovarian cancer metastasis by inhibiting the integrin signaling pathway. Theranostics. 2020;10:6467–6482. doi: 10.7150/thno.43865. [DOI] [PMC free article] [PubMed] [Google Scholar]
- Li J., Yu S., Lu X., Cui K., Tang X., Xu Y., Liang X. The phase changes of M1/M2 phenotype of microglia/macrophage following oxygen-induced retinopathy in mice. Inflamm. Res. 2021;70:183–192. doi: 10.1007/s00011-020-01427-w. Ancestors Unlimited. [DOI] [PubMed] [Google Scholar]
- Luan M., He X., Huang X., Zhang Q., Ma K. The peptide mimicking small extracellular loop domain of CD82 inhibits tumor cell migration, adhesion and induces apoptosis by inhibiting integrin mediated signaling. Biochem. Biophys. Res. Commun. 2018;503:2206–2211. doi: 10.1016/j.bbrc.2018.06.139. [DOI] [PubMed] [Google Scholar]
- McWhorter F.Y., Wang T., Nguyen P., Chung T., Liu W.F. Modulation of macrophage phenotype by cell shape. Proc. Natl. Acad. Sci. USA. 2013;110:17253–17258. doi: 10.1073/pnas.1308887110. [DOI] [PMC free article] [PubMed] [Google Scholar]
- Muraille E., Leo O., Moser M. TH1/TH2 paradigm extended. Macrophage polarization as an unappreciated pathogen-driven escape mechanism? Front. Immunol. 2014;5:603. doi: 10.3389/fimmu.2014.00603. [DOI] [PMC free article] [PubMed] [Google Scholar]
- Patel N.R., Bole M., Chen C., Hardin C.C., Kho A.T., Mih J., Deng L., Butler J., Tschumperlin D., Fredberg J.J., et al. Cell elasticity determines macrophage function. PLoS One. 2012;7:e41024. doi: 10.1371/journal.pone.0041024. [DOI] [PMC free article] [PubMed] [Google Scholar]
- Peppelenbosch M., Boone E., Jones G.E., van Deventer S.J., Haegeman G., Fiers W., Grooten J., Ridley A.J. Multiple signal transduction pathways regulate TNF-induced actin reorganization in macrophages. Inhibition of Cdc42-mediated filopodium formation by TNF. J. Immunol. 1999;162:837–845. [PubMed] [Google Scholar]
- Pratti J.E.S., da Fonseca Martins A.M., da Silva J.P., Ramos T.D., Pereira J.C., Firmino-Cruz L., Oliveira-Maciel D., Vieira T.S.d.S., Lacerda L.L., Vale A.M., et al. The role of TLR9 on Leishmania amazonensis infection and its influence on intranasal LaAg vaccine efficacy. PLoS Negl Trop Dis. 2019;13:e0007146. doi: 10.1371/journal.pntd.0007146. [DOI] [PMC free article] [PubMed] [Google Scholar]
- Ritter M.R., Banin E., Moreno S.K., Aguilar E., Dorrell M.I., Friedlander M. Myeloid progenitors differentiate into microglia and promote vascular repair in a model of ischemic retinopathy. J. Clin. Invest. 2006;116:3266–3276. doi: 10.1172/jci29683. [DOI] [PMC free article] [PubMed] [Google Scholar]
- Sacks D., Sher A. Evasion of innate immunity by parasitic protozoa. Nat. Immunol. 2002;3:1041–1047. doi: 10.1038/ni1102-1041. [DOI] [PubMed] [Google Scholar]
- Saito-Reis C.A., Balise V.D., Pascetti E.M., Jiminez M., Gillette J.M. Tetraspanin CD82 regulates S1PR1-mediated hematopoietic stem and progenitor cell mobilization. Stem Cell Rep. 2021;16:2422–2431. doi: 10.1016/j.stemcr.2021.08.009. [DOI] [PMC free article] [PubMed] [Google Scholar]
- Sakthianandeswaren A., Elso C.M., Simpson K., Curtis J.M., Kumar B., Speed T.P., Handman E., Foote S.J. The wound repair response controls outcome to cutaneous leishmaniasis. Proceedings of the National Academy of Sciences USA. 2005;102:15551–15556. doi: 10.1073/pnas.0505630102. [DOI] [PMC free article] [PubMed] [Google Scholar]
- Schaible U.E., Schlesinger P.H., Steinberg T.H., Mangel W.F., Kobayashi T., Russell D.G. Parasitophorous vacuoles of Leishmania mexicana acquire macromolecules from the host cell cytosol via two independent routes. J. Cell Sci. 1999;112(Pt 5):681–693. doi: 10.1242/jcs.112.5.681. [DOI] [PubMed] [Google Scholar]
- Schindelin J., Arganda-Carreras I., Frise E., Kaynig V., Longair M., Pietzsch T., Preibisch S., Rueden C., Saalfeld S., Schmid B., et al. Fiji. An open-source platform for biological-image analysis. Nat. Methods. 2012;9:676–682. doi: 10.1038/nmeth.2019. [DOI] [PMC free article] [PubMed] [Google Scholar]
- Scott A., Fruttiger M., Scott A. Oxygen-induced retinopathy. A model for vascular pathology in the retina. Eye. 2010;24:416–421. doi: 10.1038/eye.2009.306. [DOI] [PubMed] [Google Scholar]
- Shibagaki N., Hanada K.i., Yamashita H., Shimada S., Hamada H. Overexpression of CD82 on human T cells enhances LFA-1/ICAM-1-mediated cell-cell adhesion. Functional association between CD82 and LFA-1 in T cell activation. Eur. J. Immunol. 1999;29:4081–4091. doi: 10.1002/(SICI)1521-4141(199912)29:12<4081::AID-IMMU4081>3.0.CO;2-I. [DOI] [PubMed] [Google Scholar]
- De Souza D.P., Achuthan A., Lee M.K., Binger K.J., Lee M.-C., Davidson S., Tull D.L., McConville M.J., Cook A.D., Murphy A.J., et al. Autocrine IFN-I inhibits isocitrate dehydrogenase in the TCA cycle of LPS-stimulated macrophages. J. Clin. Invest. 2019;129:4239–4244. doi: 10.1172/JCI127597. [DOI] [PMC free article] [PubMed] [Google Scholar]
- Takata K., Kozaki T., Lee C.Z.W., Thion M.S., Otsuka M., Lim S., Utami K.H., Fidan K., Park D.S., Malleret B., et al. Induced-pluripotent-stem-cell-derived primitive macrophages provide a platform for modeling tissue-resident macrophage differentiation and function. Immunity. 2017;47:183–198.e6. doi: 10.1016/j.immuni.2017.06.017. [DOI] [PubMed] [Google Scholar]
- Tarrant J.M., Robb L., van Spriel A.B., Wright M.D. Tetraspanins. molecular organisers of the leukocyte surface. Trends Immunol. 2003;24:610–617. doi: 10.1016/j.it.2003.09.011. [DOI] [PubMed] [Google Scholar]
- Termini C.M., Cotter M.L., Marjon K.D., Buranda T., Lidke K.A., Gillette J.M. The membrane scaffold CD82 regulates cell adhesion by altering α4 integrin stability and molecular density. Mol. Biol. Cell. 2014;25:1560–1573. doi: 10.1091/mbc.E13-11-0660. [DOI] [PMC free article] [PubMed] [Google Scholar]
- Vemula S., Shi J., Hanneman P., Wei L., Kapur R. ROCK1 functions as a suppressor of inflammatory cell migration by regulating PTEN phosphorylation and stability. Blood. 2010;115:1785–1796. doi: 10.1182/blood-2009-08-237222. [DOI] [PMC free article] [PubMed] [Google Scholar]
- Venter G., Oerlemans F.T.J.J., Wijers M., Willemse M., Fransen J.A.M., Wieringa B. Glucose controls morphodynamics of LPS-stimulated macrophages. PLoS One. 2014;9:e96786. doi: 10.1371/journal.pone.0096786. [DOI] [PMC free article] [PubMed] [Google Scholar]
- Vogel D.Y.S., Heijnen P.D.A.M., Breur M., de Vries H.E., Vries H.E. de, Tool A.T.J., Amor S., Dijkstra C.D. Macrophages migrate in an activation-dependent manner to chemokines involved in neuroinflammation. J. Neuroinflammation. 2014;11:23. doi: 10.1186/1742-2094-11-23. [DOI] [PMC free article] [PubMed] [Google Scholar]
- Wee J.L., Schulze K.E., Jones E.L., Yeung L., Cheng Q., Pereira C.F., Costin A., Ramm G., van Spriel A.B., Hickey M.J., Wright M.D. Tetraspanin CD37 regulates β2 integrin-mediated adhesion and migration in neutrophils. J. Immunol. 2015;195:5770–5779. doi: 10.4049/jimmunol.1402414. [DOI] [PubMed] [Google Scholar]
- Wei Q., Zhang F., Richardson M.M., Roy N.H., Rodgers W., Liu Y., Zhao W., Fu C., Ding Y., Huang C., et al. CD82 restrains pathological angiogenesis by altering lipid raft clustering and CD44 trafficking in endothelial cells. Circulation. 2014;130:1493–1504. doi: 10.1161/CIRCULATIONAHA.114.011096. [DOI] [PMC free article] [PubMed] [Google Scholar]
- Wilkinson-Berka J.L., Deliyanti D., Rana I., Miller A.G., Agrotis A., Armani R., Szyndralewiez C., Wingler K., Touyz R.M., Cooper M.E., et al. NADPH oxidase, NOX1, mediates vascular injury in ischemic retinopathy. Antioxid Redox Signal. 2014;20:2726–2740. doi: 10.1089/ars.2013.5357. [DOI] [PMC free article] [PubMed] [Google Scholar]
- Wright M.D., Binger K.J. Macrophage heterogeneity and renin-angiotensin system disorders. Pflugers Arch. 2017;469:445–454. doi: 10.1007/s00424-017-1940-z. [DOI] [PubMed] [Google Scholar]
- Yeung L., Anderson J.M.L., Wee J.L., Demaria M.C., Finsterbusch M., Liu Y.S., Hall P., Smith B.C., Dankers W., Elgass K.D., et al. Leukocyte tetraspanin CD53 restrains α3 integrin mobilization and facilitates cytoskeletal remodeling and transmigration in mice. J. Immunol. 2020;205:521–532. doi: 10.4049/jimmunol.1901054. [DOI] [PubMed] [Google Scholar]
- Yeung L., Hickey M.J., Wright M.D. The many and varied roles of tetraspanins in immune cell recruitment and migration. Front. Immunol. 2018;9:1644. doi: 10.3389/fimmu.2018.01644. [DOI] [PMC free article] [PubMed] [Google Scholar]
- Zhu Y., Zhang L., Lu Q., Gao Y., Cai Y., Sui A., Su T., Shen X., Xie B. Identification of different macrophage subpopulations with distinct activities in a mouse model of oxygen-induced retinopathy. Int. J. Mol. Med. 2017;40:281–292. doi: 10.3892/ijmm.2017.3022. [DOI] [PMC free article] [PubMed] [Google Scholar]
- Zöller M. Tetraspanins. Push and pull in suppressing and promoting metastasis. Nat. Rev. Cancer. 2009;9:40–55. doi: 10.1038/nrc2543. [DOI] [PubMed] [Google Scholar]
Associated Data
This section collects any data citations, data availability statements, or supplementary materials included in this article.
Supplementary Materials
Data Availability Statement
Data reported in this paper will be shared by the lead contact upon request. This paper does not report original code. Any additional information required to reanalyse the data reported in this paper is available from the lead contact upon request.