Abstract
Little is known about the interaction of biosurfactants with bacterial cells. Recent work in the area of biodegradation suggests that there are two mechanisms by which biosurfactants enhance the biodegradation of slightly soluble organic compounds. First, biosurfactants can solubilize hydrophobic compounds within micelle structures, effectively increasing the apparent aqueous solubility of the organic compound and its availability for uptake by a cell. Second, biosurfactants can cause the cell surface to become more hydrophobic, thereby increasing the association of the cell with the slightly soluble substrate. Since the second mechanism requires very low levels of added biosurfactant, it is the more intriguing of the two mechanisms from the perspective of enhancing the biodegradation process. This is because, in practical terms, addition of low levels of biosurfactants will be more cost-effective for bioremediation. To successfully optimize the use of biosurfactants in the bioremediation process, their effect on cell surfaces must be understood. We report here that rhamnolipid biosurfactant causes the cell surface of Pseudomonas spp. to become hydrophobic through release of lipopolysaccharide (LPS). In this study, two Pseudomonas aeruginosa strains were grown on glucose and hexadecane to investigate the chemical and structural changes that occur in the presence of a rhamnolipid biosurfactant. Results showed that rhamnolipids caused an overall loss in cellular fatty acid content. Loss of fatty acids was due to release of LPS from the outer membrane, as demonstrated by 2-keto-3-deoxyoctonic acid and sodium dodecyl sulfate-polyacrylamide gel electrophoresis analysis and further confirmed by scanning electron microscopy. The amount of LPS loss was found to be dependent on rhamnolipid concentration, but significant loss occurred even at concentrations less than the critical micelle concentration. We conclude that rhamnolipid-induced LPS release is the probable mechanism of enhanced cell surface hydrophobicity.
Cell surface properties result from the unique chemical structure of the cell surface. In the case of a gram-negative bacterium such as Pseudomonas aeruginosa, this structure is the outer membrane, the outer leaflet of which is primarily composed of lipopolysaccharide (LPS). The outer leaflet contains LPS molecules which are composed of three components (25). The first is the lipid A tail which is anchored into the hydrophobic region of the outer membrane. The second is the core oligosaccharide, which contains a unique eight-carbon sugar called 2-keto-3-deoxyoctonic acid (KDO). The core oligosaccharide is connected to the lipid A tail through its reducing end and is positioned at the surface of the membrane in a manner analogous to the glycerol-phosphate head group of a phospholipid. The core oligosaccharide is negatively charged, and the association of adjacent LPS molecules is stabilized by Mg2+ ions at the membrane surface. The third component of LPS is the O antigen which consists of 15 to 20 repeating monomers of a three- to five-sugar subunit. The O antigen is attached to the nonreducing end of the oligosaccharide and extends out from the cell surface into the environment (28). The presence of smooth LPS results in a relatively hydrophilic cell surface that is permeable to small hydrophilic molecules (molecular weight <600) but excludes hydrophobic molecules (16).
Several studies have shown that it is possible to modify the outer membrane of gram-negative bacteria by mutation or by the addition of chemical agents, such as EDTA. This results in overall changes in cell surface properties. For example, LPS mutants which have lost the O antigen component have increased affinity for hydrophobic probes (14, 23, 25, 29, 31, 32). EDTA treatment of cells has been shown to cause partial release of LPS (4, 5, 15, 30), resulting in cells that are more susceptible to the action of hydrophobic antibiotics (15, 16). The mechanism of EDTA-induced LPS loss is through chelation of divalent cations, namely Mg2+, which results in a weakening of LPS-LPS interaction and release of LPS to the growth medium (25). The loss of LPS from the outer leaflet of the outer membrane may cause a temporary exposure of the hydrophobic phospholipid fatty acid tails associated with the inner leaflet of the outer membrane. Alternatively, loss of LPS may decrease the compaction of the outer leaflet of the outer membrane, allowing increased passage of large hydrophobic compounds. Nikaido and Nakae (24) further suggest that lost LPS may be replaced with phospholipids, resulting in a cell surface with increased hydrophobic character.
The ability of Pseudomonas spp. to utilize hydrocarbons as a source of energy is well known (22). In most cases, however, the rate of utilization is slow compared to readily soluble compounds like sugars. Studies in pure culture have shown that biosurfactants, in particular rhamnolipid produced by P. aeruginosa, enhance hydrocarbon biodegradation rates (3, 9, 12, 13, 33, 35–37). It appears from this work that there are two mechanisms by which biosurfactants enhance the biodegradation of slightly soluble organic compounds. First, biosurfactants can solubilize hydrophobic compounds within micelle structures, effectively increasing the apparent aqueous solubility of the organic compound and its availability for uptake by a cell. Second, biosurfactants can cause the cell surface to become more hydrophobic, thereby increasing the direct physical contact between the cell and the slightly soluble substrate (20, 33). For example, Zhang and Miller (36) found that rhamnolipid not only increased apparent hydrocarbon solubility but also modified the cell surface, resulting in increased hydrophobicity. Further, Herman et al. (8) showed that the addition of rhamnolipid at concentrations less than the critical micelle concentration (CMC) induced formation of multicellular aggregates, implying that the cells forming these aggregates are hydrophobic in nature. Taken together, these results indicate that the effect of rhamnolipid on the intrinsic ability of a cell to interact with hydrocarbons is not simply a function of increased solubility, but also results from changes in cell surface properties that are similar to those that have been described for LPS mutants or EDTA-treated cells.
The objective of this study was to investigate the rhamnolipid-induced chemical and structural changes that cause increased the cell surface hydrophobicity of P. aeruginosa. Two P. aeruginosa strains, P. aeruginosa ATCC 27853 and P. aeruginosa ATCC 9027, were used in this study. These organisms both degrade aliphatic hydrocarbons but can be characterized as having either fast (ATCC 27853) or slow (ATCC 9027) rates of growth on these substrates. Both the fatty acid and LPS content of these cells were measured during growth on a soluble substrate (glucose) and a slightly soluble substrate (hexadecane) in the presence and absence of rhamnolipid. In addition, release of LPS to culture supernatants was quantified. Cell surfaces were also examined by using scanning electron microscopy (SEM).
MATERIALS AND METHODS
Bacterial cultures.
Two P. aeruginosa strains were used in this study: P. aeruginosa ATCC 27853 and P. aeruginosa ATCC 9027. These two strains were selected because of their variable growth patterns on hydrocarbons; ATCC 27853 has a relatively fast intrinsic rate of growth while ATCC 9027 has a slower rate of growth on hydrocarbons (36). Both isolates were maintained from stocks grown in a mineral salts medium (MSM) containing 1% glucose, 0.4% Na2HPO4, 0.15% KH2PO4, 0.1% NH4Cl, 0.02% MgSO4 · 7H2O, 0.0005% iron ammonium citrate, 0.0015% CaCl2, and 1 ml of trace elements solution per liter (solution contained per 100 ml of solution, 0.5 mg of CuSO4 · 5H2O, 1.0 mg of H3BO3, 1.0 mg of MnSO4 · 5H2O, 7.0 mg of ZnSO4, and 1.0 mg of MoO3). These stocks were preserved in glycerol at −20°C. For each experiment, a fresh Pseudomas-P agar (Difco, Sparks, Md.) plate was inoculated from a glycerol stock and incubated at 37°C for 24 h. Colonies from these plates were used to inoculate an experiment within 3 days.
Biosurfactant.
Monorhamnolipid was produced and purified from P. aeruginosa ATCC 9027 as described previously (7, 35, 36) and was supplied to the cultures at a final concentration between 0 and 10 mM. Neither of the cultures grew on rhamnolipid as a sole source of carbon and energy under the conditions of these experiments.
Growth experiments.
A series of growth experiments were performed to relate biosurfactant addition to three parameters: cell growth, cell surface hydrophobicity, and LPS content. The effects of biosurfactant addition on these parameters were compared for the two strains, ATCC 9027 and ATCC 27853, grown on both the soluble (1% [wt/vol] glucose) and the slightly soluble (1% [wt/wt] hexadecane) substrates. For each growth experiment, simultaneous measurements of cell growth, cell surface hydrophobicity, and LPS were performed. Cell growth was determined by protein analysis, cell surface hydrophobicity was measured by the bacterial adherence to hydrocarbon (BATH) assay, and LPS release to the supernatant was assessed by KDO analysis. All growth experiments were performed in MSM. The medium was adjusted to pH 7.2 and supplied with 1% glucose or hexadecane. Inocula were prepared in MSM amended with 1% glucose and grown to late exponential phase (16 h for ATCC 27853 and 24 h for ATCC 9027). To minimize the effects of any unused glucose in the inoculum culture (especially for hexadecane experiments), the inoculum was washed twice and then resuspended in fresh MSM. Each experiment received a 10-ml inoculum and was performed in triplicate 1-liter flasks containing a total volume of 200 ml of culture. Flasks were incubated at 25°C on a rotary shaker (200 rpm).
Protein analysis.
To measure protein content, 1.0 ml of cell suspension was washed twice and then resuspended in sterile water. Then, 0.1 N NaOH was added, and the cell suspension was heated at 100°C to lyse cells. Protein content in the supernatant of each sample was determined by the method of Lowry et al. (17) by using a standard curve prepared with bovine serum albumin. The limit of detection was found to be 1 mg of protein per liter. Cultures supplied with glucose were sampled every 4 h, and cultures containing hexadecane were sampled every 1 to 4 days until growth reached the stationary phase.
BATH assay.
Samples were periodically taken to determine the relative hydrophobicity of cells at different growth stages by using the BATH assay. The BATH assay measures the partitioning of cells between aqueous and hydrophobic phases. It should be emphasized that, while this partitioning is related to cell surface hydrophobicity, BATH assay results do not represent an absolute value of cell surface hydrophobicity. Rather, BATH assay results are relative and can be used to compare the response of cells grown under various conditions. The sample size taken to determine the relative cell surface hydrophobicity varied according to the age of the culture. Since the BATH assay calls for a final sample volume of 4.0 ml adjusted to a cell optical density (OD) of 1.0, the sample size required decreased with increasing culture cell density and ranged from 0.8 to 10 ml of culture. The general protocol previously described by Zhang and Miller (35) was used with the following modifications. Cells were washed with MSM five times to remove rhamnolipid from the cell pellet. Cells were then resuspended in MSM and adjusted to an OD at 400 nm (OD400) of 1.0 ± 0.01. Hexadecane (1 ml) was added to 4 ml of the adjusted cell suspension in a 16- by 100-mm test tube and was vortexed for 1 min. The mixture was then allowed to settle and separate for 30 min, and the OD of the aqueous phase was measured.
LPS analysis.
The LPS content in culture supernatant samples was determined by the thiobarbituric acid assay of KDO adapted from the method of Osborn et al. (27). A standard curve was prepared by using purified LPS obtained from P. aeruginosa serotype 10 (Sigma, St. Louis, Mo.). Various medium components were tested for possible interference with the assay, including glucose, MSM, and rhamnolipid. Neither glucose nor MSM impacted the assay. Interference from rhamnolipid was observed when it precipitated after the addition of sulfuric acid, causing the supernatant to become turbid. Thus, samples were centrifuged 10,000 × g) after color development to eliminate the turbidity and hence the interference from rhamnolipid. The KDO assay was performed on 0.1-ml supernatant samples. Samples were placed in a screw-cap tube, and 0.1 ml of 0.036 N H2SO4 was added. The mixture was hydrolyzed at 100°C for 20 min to liberate KDO and then cooled. The mixture was further acidified by adding 0.25 ml of 0.025 N HIO4 in 0.125 N H2SO4 and allowed to stand for 20 min at room temperature. Sodium arsenate (2%, 0.5 ml in 0.5 N HCl) was added with shaking, and the tubes were allowed to stand for 2 min, followed by addition of 2.0 ml of 0.3% thiobarbituric acid (pH 2) with stirring. The tubes were then heated at 100°C for 10 min, allowed to cool, and centrifuged, and the absorbance of each sample was measured at 548 nm.
Total LPS content in whole-cell lysates was also determined for each isolate. Cells were prepared for KDO assay as follows: 0.1-ml samples of culture were washed twice, and the cells were lysed by dissolving the cell pellet in 50 μl of lysing buffer (2% sodium dodecyl sulfate [SDS], 4% 2-mercaptoethanol, 10% glycerol, 1 M Tris [pH 6.8], and 0.01% bromphenol blue) and heating at 100°C for 10 min (10). The volume of each sample was then adjusted to 0.1 ml, and KDO was assayed as described above.
Fatty acid analysis.
Extractable cell lipids were determined by Folch extraction and GC analysis. One-milliliter samples of the culture were washed twice and then resuspended in sterile water to the original volume. The following reagents were added in order with vortexing after each addition: 2 ml of 2:1 methanol-chloroform, 1 ml of 1 N KCl acidified to pH 2 with 0.1 N HCl, and 1 ml of chloroform (3). In some samples, a white emulsion phase formed between the aqueous and organic phases. In this case, the sample was placed in the refrigerator overnight to allow the emulsion phase to settle. The chloroform phase was removed and evaporated at 45°C under a nitrogen stream. The fatty acids were methyl esterified as follows: chloroform (0.5 ml) was added, and the sample was vortexed, then 2 ml of BF3-methanol was added, and the mixture was heated at 80°C for 1 h in an airtight Teflon screw-cap tube (21). The resulting fatty acid methylesters (FAME) were extracted three times with 1 ml of hexane, and the three fractions were combined. Finally, the hexane was evaporated at 45°C under a nitrogen stream, and the FAME were resuspended in 200 μl of chloroform and quantified by using an HP 5890 gas chromatograph equipped with a flame ionization detector and a J & W DB-5 fused silica capillary column. The carrier gas used was ultra-high-purity helium. The identity and quantity of fatty acids were compared to a FAME standard GC 85 (Nu He Prep Inc., Elysian, Minn.). This standard is composed of 32 different FAME containing those normally present in P. aeruginosa.
Effect of rhamnolipid concentration on LPS release.
The effect of rhamnolipid addition on the release of LPS from cells was determined. Cells were grown on MSM containing 1% glucose, were harvested during the late log phase, and were adjusted to an OD600 of 1.0. Cells were then centrifuged at 12,000 × g and resuspended in 0 to 10 mM rhamnolipid in MSM. Each suspension was vortexed and incubated on a rotary shaker (200 rpm) at 25°C for 0 to 24 h. Cell suspensions were then centrifuged, and the supernatant was removed for simultaneous KDO, SDS-polyacrylamide gel electrophoresis (SDS-PAGE), and SEM analysis.
SDS-PAGE analysis of LPS.
For SDS-PAGE analysis, supernatants were lyophilized and resuspended in sterile ddH2O to achieve a concentration of 10×. Ten microliters of each concentrated supernatant preparation was run on 4% stacker and 12.5% vertical resolving gels (16- by 18- by 0.15-cm) against 1, 5, and 50 μg of P. aeruginosa serotype 10 LPS (Sigma). Constant current (35 mA) was applied until the samples had migrated approximately 14 cm. Gels were run at 4°C in a Tris-Tricine running buffer (Bio-Rad, Hercules, Calif.). LPS were visualized by using a previously described silver staining protocol (10).
SEM.
Cell samples (30 ml) were centrifuged at 10,000 × g and were resuspended in 30 ml of 4% paraformaldehyde and 1% glutaraldehyde in 0.1 M phosphate buffer (pH 7.4) until samples were processed further. Between each of the following steps, samples were centrifuged at 10,000 × g, and the supernatant was siphoned off with a vacuum. Samples were rinsed in 0.1 M phosphate buffer (pH 7.4) for 30 s and then rinsed twice for 5 min. Next, half of the samples were postfixed in 1% osmium tetroxide in nanopure dH2O, and the other half were fixed in 1% rhenium tetroxide in nanopure dH2O for 30 min each. The samples were then washed once for 30 s and then twice in ddH2O for 5 min. Samples were sealed into individual 25-mm-diameter, 0.2-μm-pore-size filter pouches (Costar Scientific Corporation, Cambridge, Mass.). The samples were then run through an ethanol dehydration series of 30, 50, 70, 95, and three changes of 100% ethanol for 10 min each. Finally, samples were critical-point dried (Polaron; Energy Beam Sciences, Agawam, Maine). The dried specimens were mounted on aluminum mounts with Avery Spot o' Glue and 3/8-in. polyester silver tape (3M, St. Paul, Minn.). Lastly, the samples were coated with a 10- to 20-nm layer of platinum in a magnetron sputtering device (Hummer 6; Anatech Ltd., Springfield, Va.). The material was examined by using a Hitachi S-4500 scanning electron microscope (Hitachi Scientific Instruments, Mountain View, Calif.). The samples were viewed at 0° tilt at 10 kV.
RESULTS
Growth and cell surface hydrophobicity.
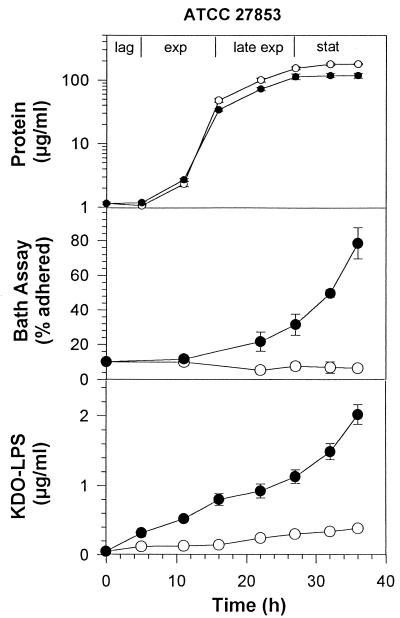
Rhamnolipid had a slight negative effect on the growth of ATCC 27853 on glucose as determined by protein analysis. This effect was manifested as a minor reduction in cell yield (Fig. 1). In terms of cell surface hydrophobicity, as measured by the BATH test, ATCC 27853 grown on glucose in the absence of rhamnolipid exhibited a relatively low cell surface hydrophobicity at all stages of growth. In contrast, rhamnolipid addition caused cell surface hydrophobicity to slowly increase throughout the exponential phase to reach 30% adherence in the late exponential phase and then rapidly increased to 79% adherence by the end of stationary phase.
FIG. 1.
Growth, KDO, and cell surface hydrophobicity of P. aeruginosa ATCC 27853 grown on 1% glucose in the presence or absence of rhamnolipid. ○, no rhamnolipid; ●, 6 mM rhamnolipid. Each point represents the average and standard deviation of three replicate samples.
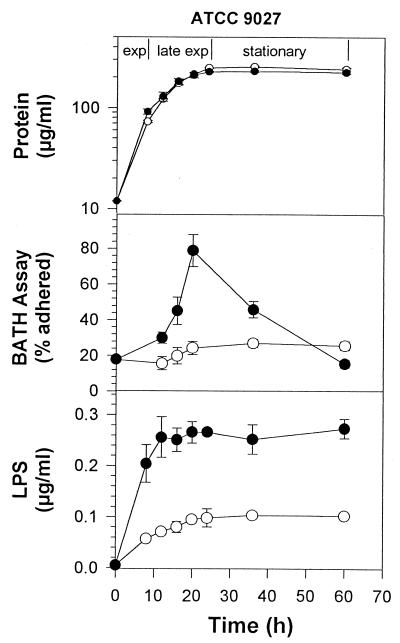
The effect of rhamnolipid on P. aeruginosa ATCC 9027 during growth on glucose was quite different (Fig. 2). Rhamnolipid addition did not affect growth but caused a rapid change in cell surface hydrophobicity, reaching 78% adherence by the end of exponential phase. Following the onset of stationary phase, adherence declined sharply until reaching the basal level of approximately 16%. In the absence of rhamnolipid, cell surface hydrophobicity did not exceed 27% adherence.
FIG. 2.
Growth, KDO, and cell surface hydrophobicity of P. aeruginosa ATCC 9027 grown on 1% glucose in the presence or absence of rhamnolipid. ○, no rhamnolipid; ●, 6 mM rhamnolipid. Each point represents the average and standard deviation of three replicate samples.
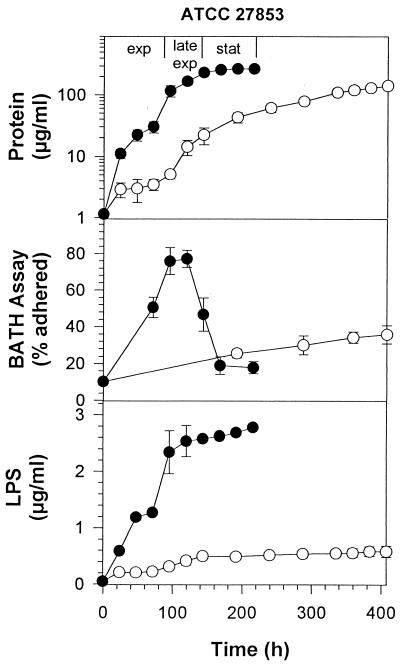
A similar set of experiments were performed with hexadecane as a substrate. Growth of ATCC 27853 on hexadecane was characterized by a faster rate of growth (see slope of growth curves) upon addition of rhamnolipid (Fig. 3). The relative cell surface hydrophobicity of cells grown on hexadecane alone showed a slow, steady increase to 33% adherence over a period of 400 h. The addition of rhamnolipid to the growth medium caused a rapid increase in cell surface hydrophobicity during the exponential phase of growth, reaching 78% adherence to hexadecane in 100 h, after which adherence dropped to background levels.
FIG. 3.
Growth, KDO, and cell surface hydrophobicity of P. aeruginosa ATCC 27853 grown on 1% hexadecane in the presence or absence of rhamnolipid. ○, no rhamnolipid; ●, 6 mM rhamnolipid. Each point represents the average and standard deviation of three replicate samples.
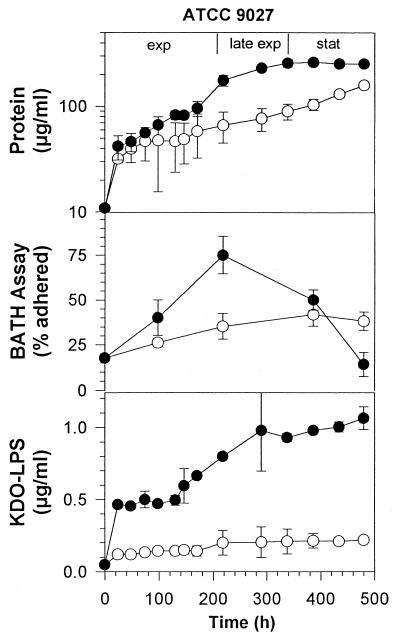
Figure 4 shows the effect of rhamnolipid addition on ATCC 9027 grown on hexadecane. While ATCC 9027 naturally grows more slowly on hexadecane than ATCC 27853, rhamnolipid had a stimulatory effect on growth similar to that observed for ATCC 27853. Also similar to ATCC 27853, ATCC 9027 had a slow and steady increase in relative cell surface hydrophobicity to 40% adherence during growth on hexadecane alone (Fig. 4). The cultures grown on hexadecane in the presence of rhamnolipid showed a more rapid increase in relative cell surface hydrophobicity during exponential phase to 75% adherence, after which the adherence declined to less than 20% by the end of sampling at 500 h.
FIG. 4.
Growth, KDO, and cell surface hydrophobicity of P. aeruginosa ATCC 9027 grown on 1% hexadecane in the presence or absence of rhamnolipid. ○, no rhamnolipid; ●, 6 mM rhamnolipid. Each point represents the average and standard deviation of three replicate samples.
Total cell lipids.
Analysis of total cell lipids showed no difference in the types of fatty acids produced by cells in the presence and absence of rhamnolipid. The major fatty acids produced were similar to those reported by others (6, 11): C16:0 (∼40%), C18:1 (∼40%), and C16:1 (∼10%). However, the amount of fatty acids produced was much lower in cells that were exposed to rhamnolipid. For example, there was a 6% loss of the C16:0 fatty acid, a 53% loss of the C18:1 fatty acid, and a 75% loss of the C16:1 fatty acid for ATCC 9027 in the presence of rhamnolipid.
Total cellular and supernatant LPS content.
The lower fatty acid content in rhamnolipid-treated cells led us to hypothesize that fatty acid loss was due to the release of LPS from the outer membrane. Therefore, total cellular LPS content as well as LPS release to the supernatant was measured for strains by using KDO analysis. For total cellular LPS, cells of both strains were grown on glucose to the late exponential phase in the absence of rhamnolipid. Results showed that both strains contain similar amounts of LPS: 7.4 μg of LPS per ml of ATCC 27853 culture and 8.1 μg of LPS per ml of ATCC 9027 culture. In this case, 1 ml of culture was centrifuged, the supernatant was discarded, and the LPS content of the pelleted cells was determined.
The amount of LPS released from these strains to the culture supernatant during growth was then measured to determine the effect of added rhamnolipid on the release of LPS from the cell surface. As shown in Fig. 1 and 2, for cells grown on glucose and not exposed to rhamnolipid, there was a slow release of LPS over the course of the experiment. This LPS release totaled 0.39 μg per ml of ATCC 27853 and 0.1 μg per ml of ATCC 9027. The amount of LPS released represents a small proportion of the total cellular LPS: 7% for ATCC 27853 and 1% for ATCC 9027. These values appear to represent a background level of LPS release that is normal under these experimental conditions. LPS release was significantly higher for both strains when exposed to rhamnolipid, reaching 2.0 μg/ml for ATCC 27853 and 0.27 μg/ml for ATCC 9027. These values represent a 25% release of total cellular LPS for ATCC 27853 and a 3.3% release of LPS for ATCC 9027. Both values represent a significant increase over controls that were not treated with rhamnolipid. Results in Fig. 3 and 4 show a similar pattern of LPS release for cells grown on hexadecane. Rhamnolipid caused an increase from 8 to 38% LPS release for ATCC 27853 and from 3 to 14% for ATCC 9027 in the presence of hexadecane.
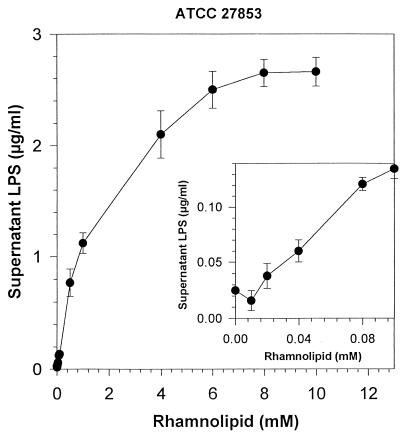
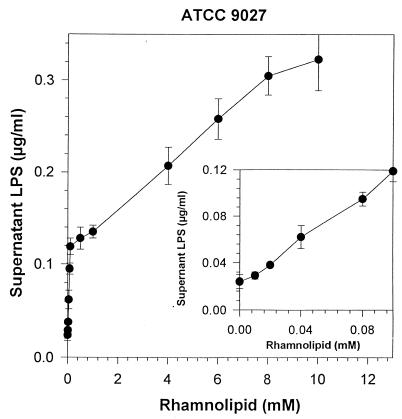
The dependence of LPS release on rhamnolipid concentration is further examined in Fig. 5 and 6. For ATCC 27853, LPS release was significant at rhamnolipid concentrations as low as 0.04 mM (20 mg/liter). At higher rhamnolipid concentrations, the amount of LPS released exceeded 2.7 μg per ml of cell suspension, almost 36% of the total LPS content of the cell. For ATCC 9027, LPS was released at similarly low rhamnolipid concentrations, but the total LPS release was much less, reaching only 0.32 μg per ml of cell suspension (4% of the total LPS content of the cell). While the amount of LPS release was low, it seems that this release was enough for the bacterium to acquire a relatively hydrophobic surface, as seen in Fig. 2. The dependence of LPS release on rhamnolipid concentration was also different for ATCC 9027. While release of LPS from ATCC 27853 could be described by a second-order polynomial curve (r2 = 0.977), release of LPS from ATCC 9027 proceeded in two phases: the first phase was characterized by a high, linear (r2 = 0.0995) rate of increase in LPS loss from 0 to 0.1 mm rhamnolipid and a subsequent lower linear (r2 = 0.990) rate of increase from 0.1 to 10 mM rhamnolipid.
FIG. 5.
Effect of rhamnolipid on LPS released from cell suspensions of P. aeruginosa ATCC 27853. Cell suspensions were adjusted to an OD of 1.0 and were incubated with the respective rhamnolipid concentration for 8 h, and supernatant samples were assayed for LPS. Each point represents the average and standard deviation of three replicate samples.
FIG. 6.
Effect of rhamnolipid on LPS released from cell suspensions of P. aeruginosa ATCC 9027. Cell suspensions were adjusted to an OD of 1.0 and were incubated with the respective concentration of rhamnolipid for 8 h, and supernatant samples were assayed for LPS. Each point represents the average and standard deviation of three replicate samples.
The BATH assay results can be compared to LPS release. As shown in Fig. 1 to 4, the increase in cell surface hydrophobicity coincided with LPS release to the medium. However, once reaching a maximum value of 75 to 89%, cell surface hydrophobicity decreased sharply in all cases except for that of ATCC 27853 grown on glucose. Even though cell surface hydrophobicity declined, LPS remained high in the culture supernatants. This suggests that these cells regenerated LPS to become more hydrophilic rather than taking up the released LPS from solution.
SDS-PAGE of LPS.
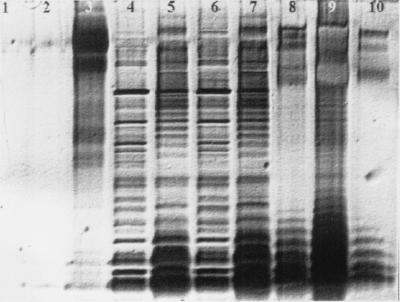
SDS-PAGE analysis of LPS was performed on concentrated supernatants taken from ATCC 27853 cultures incubated in the presence and absence of rhamnolipid for 8 or 24 h. As shown in Fig. 7, rhamnolipid (lane 2) is not visualized by the silver stain procedure. Protein (lane 3) is visualized but does not produce a characteristic LPS banding pattern. However, characteristic LPS banding patterns were clearly observed in culture supernatant samples (lanes 4 to 7) and P. aeruginosa serotype 10 LPS standards (lanes 8 to 10). The LPS banding patterns seen in supernatants of cells not treated with rhamnolipid (lanes 4 and 6) represent a background level of LPS release similar to that seen in the KDO analysis (Fig. 5). In contrast, the LPS banding patterns seen in cell supernatants treated with rhamnolipid for 8 or 24 h (Fig. 7, lanes 5 and 7) were much more intense. These results clearly demonstrate that rhamnolipid does not interfere with the staining procedure (lane 2) and that the more-intense banding pattern is caused by rhamnolipid-induced LPS release. The LPS banding patterns observed in supernatants from cell suspensions treated with 6 mM rhamnolipid for only 2 h were also more intense than in those in suspension supernatants not treated with rhamnolipid (data not shown), indicating that rhamnolipid induces LPS release within 2 h.
FIG. 7.
A silver-stained SDS-PAGE of concentrated (10×) supernatants of suspensions of P. aeruginosa ATCC 27853. Lane 1, buffer; lane 2, 300 μg of rhamnolipid; lane 3, 5 μg of bovine serum albumin; lane 4, supernatant of P. aeruginosa ATCC 27853 treated only with MSM for 8 h; lane 5, supernatant of P. aeruginosa ATCC 27853 treated with 6 mM rhamnolipid for 8 h; lane 6, supernatant of P. aeruginosa ATCC 27853 treated only with MSM for 24 h; lane 7, supernatant of P. aeruginosa ATCC 27853 treated with 6 mM rhamnolipid for 24 h; lane 8, 5 μg of P. aeruginosa serotype 10 LPS; lane 9, 50 μg of P. aeruginosa serotype 10 LPS; lane 10, 1 μg of P. aeruginosa serotype 10 LPS.
Electron microscopy.
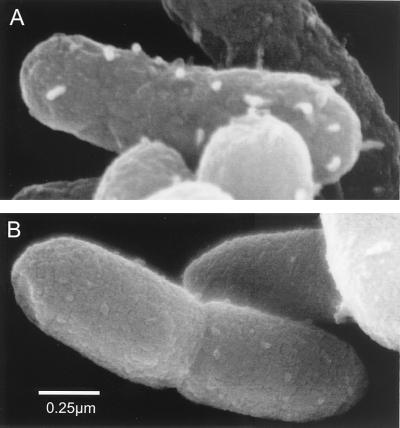
The ATCC 27853 cell surface was examined using SEM in the absence and presence of rhamnolipid. Cells shown in Fig. 8A (no rhamnolipid) and B (with rhamnolipid) were prepared from the same samples that were used for the SDS-PAGE analysis shown in Fig. 7, lanes 4 and 5. The rhamnolipid-treated and untreated cells were fixed identically and show clear differences. The untreated cells shown in Fig. 8A have a rougher texture than the rhamnolipid-treated cells (Fig. 8B). The rough appearance of the untreated cell surface may be due to the LPS-protein complexes on the cell surface. Similar results were seen for P. aeruginosa ATCC 9027 (data not shown).
FIG. 8.
Scanning electron micrograph of P. aeruginosa ATCC 27853 grown on glucose in the absence of rhamnolipid (A) and presence of 6 mM rhamnolipid (B) for 8 h. The scanning electron micrographs shown are of cells fixed with 1% rhenium tetroxide. Rhenium tetroxide was considered superior to osmium tetroxide because of its ability to preserve anything larger than a simple hexose structure. Thus, this fixative better preserves external cell morphology and prevents artifacts due to condensation of supernatant materials onto the cell surface.
DISCUSSION
This study was initiated to explain the structural changes in Pseudomonas cell surfaces that result in increased cell surface hydrophobicity upon exposure to the biosurfactant rhamnolipid. The results of this research demonstrate that rhamnolipid, at very low concentrations, causes release of LPS from the outer membrane. As a result, the cell surface becomes more hydrophobic. The quantity and type of LPS found on the cell surface has a profound effect on the nature of interactions between the cell and its environment (18). In wild-type gram-negative bacteria, the predominant LPS is smooth-form LPS which contains the O antigen (polysaccharide side chain). This gives the bacterium a relatively hydrophilic surface suitable for normal environmental settings. Bacteria with smooth-form LPS are resistant to the action of hydrophobic antibiotics because such compounds are unable to penetrate the highly hydrophilic zone formed by the polysaccharide chains of the dense LPS layer (25). In contrast, bacteria that have rough-form LPS (no or short O antigen), mutant LPS, or no LPS are all more susceptible to the action of hydrophobic antibiotics. Similarly, the strains in this study that were treated with rhamnolipid showed loss of LPS, and this resulted in increased cell surface hydrophobicity. Concomitant with LPS loss and increased hydrophobicity was an increase in the rate of growth on the hydrophobic substrate hexadecane. This can be explained by the ability of hydrophobic bacteria to more easily make direct physical contact with hexadecane, a vital preliminary step for substrate uptake and biodegradation.
Rhamnolipid may interact with LPS in two ways to cause removal from the outer membrane. The first is that rhamnolipid causes the direct removal of LPS by solubilization of LPS. Clearly, rhamnolipid has detergency properties, as demonstrated by its ability to enhance hydrocarbon solubility (35). The second is that rhamnolipid causes the indirect removal of LPS through complexation of Mg2+ in the outer membrane. Magnesium is a metal that is crucial for maintaining strong LPS-LPS interactions in the outer membrane. Its removal results in the destabilization of the LPS-LPS interaction and loss of LPS from the membrane (as described for EDTA [25]). This mechanism is supported by the fact that rhamnolipid has been shown to effectively complex divalent metal cations, such as magnesium (7, 34). The conditional stability constant (logK) describing the strength of the rhamnolipid-magnesium complex is 2.66 (26). To put this in context, this value is similar to the reported stability constants for other naturally occurring materials with magnesium: 1.27 for acetic acid, 3.43 for oxalic acid, 3.37 for citric acid, and 2.2 for fulvic acid (26). It is 6 orders of magnitude lower than the reported stability constant for EDTA and magnesium of 8.79 (19).
The effect of rhamnolipid on LPS release was different for the two strains used in this study. While ATCC 27853 released a larger proportion of its LPS (25 to 38%) in the presence of rhamnolipid, ATCC 9027 released only 3.3 to 14%. However, cell surface hydrophobicity increased similarly for both strains in the presence of rhamnolipid. Thus, even a minimal LPS release can lead to development of high adherence to hydrocarbons. This resulted in enhanced biodegradation of the hydrophobic substrate hexadecane. Following hexadecane biodegradation, cells entered stationary phase and the cell surface hydrophobicity of both strains returned to normal levels, suggesting that LPS was regenerated (Fig. 3 and 4). In contrast, glucose experiments showed that addition of rhamnolipid did not have much impact on growth of either strain even though cell surface hydrophobicity was increased. In stationary phase, ATCC 9027 recovered in terms of cell surface hydrophobicity, but ATCC 27853 did not. The results presented show that while relative cell surface hydrophobicity is changed similarly for both strains in the presence of rhamnolipid, the temporal nature of the change is different and is a function of the bacterial strain tested, as well as its growth stage, and the type of growth substrate present.
In conclusion, this study demonstrates that rhamnolipid, even at concentrations much less than the CMC (0.1 mM), causes release of LPS which results in an increase in cell surface hydrophobicity. This allows increased association of cells with hydrophobic substrates resulting in increased degradation rates. These results help explain why biosurfactants enhance biodegradation rates even at sub-CMC concentrations where solubilization of the hydrocarbon is not a factor (8). In fact, similar unexplained observations have been made for some, but not all, synthetic surfactants (1). Understanding how biosurfactants impact biodegradation rates at low concentration is important because, in practical terms, addition of low levels of surfactants, either biological or synthetic, will be more cost-effective for remediation than addition of the high levels of surfactant that are required to achieve solubilization effects.
ACKNOWLEDGMENTS
We thank David Bentley of the Biological Imaging Facility at the University of Arizona for his help with the SEM work.
This research was supported in part by grant DE-FGD3-97ER62470 from the U.S. Department of Energy and in part by grant P42 ES04940 from the National Institute of Environmental Health Sciences, National Institutes of Health.
REFERENCES
- 1.Aronstein B N, Alexander M. Surfactants at low concentrations stimulate biodegradation of sorbed hydrocarbons in samples of aquifer sands and soil slurries. Environ Toxicol Chem. 1992;11:1227–1233. [Google Scholar]
- 2.Churchill S A, Griffin R A, Jones L P, Churchill P F. Biodegradation rate enhancement of hydrocarbons by an oleophilic fertilizer and a rhamnolipid biosurfactant. J Environ Qual. 1995;24:19–28. [Google Scholar]
- 3.Folch J, Lees M, Sloane Stanley G H. A simple method for the isolation and purification of total lipids from animal tissue. J Biol Chem. 1957;226:497–509. [PubMed] [Google Scholar]
- 4.Gilleland H E, Jr, Stinnett J D, Roth I L, Eagon R G. Freeze-etch study of Pseudomonas aeruginosa: localization within the cell wall of an ethylenediaminetetraacetate-extractable component. J Bacteriol. 1973;113:417–432. doi: 10.1128/jb.113.1.417-432.1973. [DOI] [PMC free article] [PubMed] [Google Scholar]
- 5.Gray G W, Wilkinson S G. The action of ethylenediaminetetraacetic acid on Pseudomonas aeruginosa. J Appl Bacteriol. 1965;28:153–164. [Google Scholar]
- 6.Hancock I C, Meadow P M. The extractable lipids of Pseudomonas aeruginosa. Biochim Biophys Acta. 1969;187:366–379. doi: 10.1016/0005-2760(69)90010-1. [DOI] [PubMed] [Google Scholar]
- 7.Herman D C, Artiola J F, Miller R M. Removal of cadmium, lead, and zinc from soil by a rhamnolipid biosurfactant. Environ Sci Technol. 1995;29:2280–2285. doi: 10.1021/es00009a019. [DOI] [PubMed] [Google Scholar]
- 8.Herman D C, Zhang Y, Miller R M. Rhamnolipid (biosurfactant) effects on cell aggregation and biodegradation of residual hexadecane under saturated flow conditions. Appl Environ Microbiol. 1997;63:3622–3627. doi: 10.1128/aem.63.9.3622-3627.1997. [DOI] [PMC free article] [PubMed] [Google Scholar]
- 9.Hisatsuka K, Nakahara T, Sano N, Yamada K. Formation of rhamnolipid by Pseudomonas aeruginosa and its function in hydrocarbon fermentation. Agric Biol Chem. 1971;35:686–692. [Google Scholar]
- 10.Hitchcock P J, Brown T M. Morphological heterogeneity among Salmonella lipopolysaccharide chemotypes in silver-stained polyacrylamide gels. J Bacteriol. 1983;154:269–277. doi: 10.1128/jb.154.1.269-277.1983. [DOI] [PMC free article] [PubMed] [Google Scholar]
- 11.Ikemoto S, Kuraishi H, Komagata K, Azuma R, Suto T, Murooka H. Cellular fatty acid composition in Pseudonomas species. J Gen Appl Microbiol. 1978;24:199–213. [Google Scholar]
- 12.Itoh S, Suzuki T. Effect of rhamnolipids on growth of Pseudomonas aeruginosa mutant deficient in n-paraffin-utilizing ability. Agric Biol Chem. 1972;36:2233–2235. [Google Scholar]
- 13.Koch A K, Kappeli O, Fiechter A, Reiser J. Hydrocarbon assimilation and biosurfactant production in Pseudomonas aeruginosa mutants. J Bacteriol. 1991;173:4212–4219. doi: 10.1128/jb.173.13.4212-4219.1991. [DOI] [PMC free article] [PubMed] [Google Scholar]
- 14.Kropinski A M B, Chan L, Milazzo F H. Susceptibility of lipopolysaccharide-defective mutants of Pseudomonas aeruginosa strain PAO to dyes, detergents, and antibiotics. Antimicrob Agents Chemother. 1978;13:494–499. doi: 10.1128/aac.13.3.494. [DOI] [PMC free article] [PubMed] [Google Scholar]
- 15.Leive L. Release of lipopolysaccharide by EDTA treatment of E. coli. Biochem Biophys Res Commun. 1965;21:290–296. doi: 10.1016/0006-291x(65)90191-9. [DOI] [PubMed] [Google Scholar]
- 16.Leive L. The barrier function of the gram-negative envelope. Ann N Y Acad Sci. 1974;235:109–127. doi: 10.1111/j.1749-6632.1974.tb43261.x. [DOI] [PubMed] [Google Scholar]
- 17.Lowry O H, Rosebrough N J, Farr A L, Randall R J. Protein measurement with the Folin phenol reagent. J Biol Chem. 1951;193:265–275. [PubMed] [Google Scholar]
- 18.Makin S A, Beveridge T J. The influence of A-band and B-band lipopolysaccharide on the surface characteristics and adhesion of Pseudomonas aeruginosa to surfaces. Microbiology. 1996;142:299–307. doi: 10.1099/13500872-142-2-299. [DOI] [PubMed] [Google Scholar]
- 19.Martell A E, Smith R M. Critical stability constants. Vol. 1. New York, N.Y: Plenum Press; 1976. [Google Scholar]
- 20.Miller R M. Surfactant-enhanced bioavailability of slightly soluble organic compounds. In: Skipper H, Turco R, editors. Bioremediation—science & applications. Madison, Wis: Soil Science Society of America; 1995. pp. 33–54. [Google Scholar]
- 21.Morrison W R, Smith L M. Preparation of fatty acid methyl esters and dimethylacetals from lipids with boron fluoride-methanol. J Lipid Res. 1964;5:600–608. [PubMed] [Google Scholar]
- 22.Nakahara T, Erickson L E, Gutierrez J R. Characteristics of hydrocarbon uptake in cultures with two liquid phases. Biotechnol Bioeng. 1977;19:9–25. doi: 10.1002/bit.260190103. [DOI] [PubMed] [Google Scholar]
- 23.Nikaido H. Outer membrane of Salmonella typhimurium: transmembrane diffusion of some hydrophobic substances. Biochim Biophys Acta. 1976;433:118–132. doi: 10.1016/0005-2736(76)90182-6. [DOI] [PubMed] [Google Scholar]
- 24.Nikaido H, Nakae T. The outer membrane of gram-negative bacteria. Adv Microb Physiol. 1979;20:163–250. doi: 10.1016/s0065-2911(08)60208-8. [DOI] [PubMed] [Google Scholar]
- 25.Nikaido H, Varra M. Molecular basis of bacterial outer membrane permeability. Microbiol Rev. 1985;49:1–32. doi: 10.1128/mr.49.1.1-32.1985. [DOI] [PMC free article] [PubMed] [Google Scholar]
- 26.Ochoa-Loza F J. Physico-chemical factors affecting rhamnolipid (biosurfactant) application for removal of metal contaminants from soil. Ph.D. dissertation. Tucson: University of Arizona; 1998. [Google Scholar]
- 27.Osborn M J, Gander J E, Parisi E, Carson J. Mechanism of assembly of the outer membrane of Salmonella typhimurium. Isolation and characterization of cytoplasmic and outer membrane. J Biol Chem. 1972;247:3962–3972. [PubMed] [Google Scholar]
- 28.Poxton I R. Prokaryote envelope diversity. J Appl Bacteriol. 1993;74(Suppl.):S1–S11. doi: 10.1111/j.1365-2672.1993.tb04337.x. [DOI] [PubMed] [Google Scholar]
- 29.Roantree R J, Kuo T-T, MacPhee D G. The effect of defined lipopolysaccharide core defects upon antibiotic resistance of Salmonella typhimurium. J Gen Microbiol. 1977;103:223–234. doi: 10.1099/00221287-103-2-223. [DOI] [PubMed] [Google Scholar]
- 30.Rogers S W, Gilleland H E, Jr, Eagon R G. Characterization of a protein-lipopolysaccharide complex released from cell walls of Pseudomonas aeruginosa by ethylenediaminetetraacetic acid. Can J Microbiol. 1969;15:743–748. doi: 10.1139/m69-130. [DOI] [PubMed] [Google Scholar]
- 31.Rottem S, Markowitz O, Hasin M, Razin S. Outer membrane proteins of smooth and rough strains of Proteus mirabilis. Eur J Biochem. 1979;97:141–146. doi: 10.1111/j.1432-1033.1979.tb13095.x. [DOI] [PubMed] [Google Scholar]
- 32.Sanderson K E, MacAlister T, Costerton J W. Permeability of lipopolysaccharide-deficient (rough) mutants of Salmonella typhimurium to antibiotics, lysozyme, and other agents. Can J Microbiol. 1974;20:1135–1145. doi: 10.1139/m74-176. [DOI] [PubMed] [Google Scholar]
- 33.Shreve G S, Inguva S, Gunnam S. Rhamnolipid biosurfactant enhancement of hexadecane biodegradation by Pseudomonas aeruginosa. Mol Mar Biol Biotechnol. 1995;4:331–337. [PubMed] [Google Scholar]
- 34.Tan H, Champion J T, Artiola J F, Brusseau M L, Miller R M. Complexation of cadmium by a rhamnolipid biosurfactant. Environ Sci Technol. 1994;28:2402–2406. doi: 10.1021/es00062a027. [DOI] [PubMed] [Google Scholar]
- 35.Zhang Y, Miller R M. Enhanced octadecane dispersion and biodegradation by a Pseudomonas rhamnolipid surfactant (biosurfactant) Appl Environ Microbiol. 1992;58:3276–3282. doi: 10.1128/aem.58.10.3276-3282.1992. [DOI] [PMC free article] [PubMed] [Google Scholar]
- 36.Zhang Y, Miller R M. Effect of a Pseudomonas rhamnolipid biosurfactant on cell hydrophobicity and biodegradation of octadecane. Appl Environ Microbiol. 1994;60:2101–2106. doi: 10.1128/aem.60.6.2101-2106.1994. [DOI] [PMC free article] [PubMed] [Google Scholar]
- 37.Zhang Y, Maier W J, Miller R M. Effect of rhamnolipids on the dissolution, bioavailability and biodegradation of phenanthrene. Environ Sci Technol. 1997;31:2211–2217. [Google Scholar]


