

Abstract
Global gene co-expression networks (GCNs) are powerful tools for functional genomics whereby putative functions and regulatory mechanisms can be inferred by gene co-expression. Cereal crops, such as Hordeum vulgare (barley) and Sorghum bicolor (sorghum), are among the most important plants to civilization. However, co-expression network tools for these plants are lacking. Here, we have constructed global GCNs for barley and sorghum using existing RNA-seq data sets. Meta-information was manually curated and categorized by tissue type to also build tissue-specific GCNs. To enable GCN searching and visualization, we implemented a website and database named PlantNexus. PlantNexus is freely available at https://plantnexus.ohio.edu/.
Keywords: Barley, Database, Gene co-expression, RNA-seq, Sorghum, Transcriptomics
Introduction
Next-generation RNA sequencing (RNA-seq) technology has become the preferred way of generating gene expression profiles in a high-throughput manner. RNA-seq data sets encode important information of cellular processes. These transcriptomic data sets can be decoded for many purposes with appropriate techniques. Large-scale RNA-seq data can be used to study gene functions and regulatory mechanisms (Ballouz et al. 2015, Serin et al. 2016) through gene co-expression networks (GCNs). GCNs allow simultaneous identification and classification of many genes with similar expression characteristics (Serin et al. 2016). For example, GCNs have been used to understand the genetic basis of plant natural products (Wisecaver et al. 2017), nitrogen metabolism for plant growth (Gaudinier et al. 2018) and cell wall development (Rao et al. 2019).
GCNs have been constructed for several plants, such as rice (Sato et al. 2013, Obayashi et al. 2014), maize (Yu et al. 2017), wheat (Zhang et al. 2016) and soybean (Aoki et al. 2016). Several plant co-expression databases have been published, for example, ATTED-II (Obayashi et al. 2018), RiceFREND (Sato et al. 2013), PLANEX (Yim et al. 2013), PlaNet (Proost and Mutwil 2017), BarleyNet (Lee et al. 2020) and MOROKOSHI (Makita et al. 2015) for the exploration of gene co-expressions. However, GCN tools are limited by outdated datasets or are not currently available for some plant species, for example, Sorghum bicolor (sorghum). Barley and sorghum are among the most important cereal crops to humanity. They are used for human diet, livestock feed and alcoholic beverage production, etc. It is estimated that a 70% increase in agricultural output will be required to feed the world’s population by 2050 (Tester and Langridge 2010). A better understanding of gene functions and regulatory mechanisms is essential for developing strategies to increase grain yield and nutrient qualities. Original barley GCNs were constructed using microarray-based data (Mochida et al. 2011), were local GCNs constructed from certain conditions or treatments (Cantalapiedra et al. 2017, Yuan et al. 2017) or were constructed using relatively few RNA-seq data (Hennet et al. 2020, Lee et al. 2020).
In this study, we used all available high-quality RNA-seq-based transcriptomic data sets across various tissue types, developmental stages and treatment conditions to construct global GCNs for barley and sorghum. These GCNs are freely accessible through a web interface with interactive visualization tools hosted at PlantNexus at https://plantnexus.ohio.edu/ (Fig. 1A).
Fig. 1.
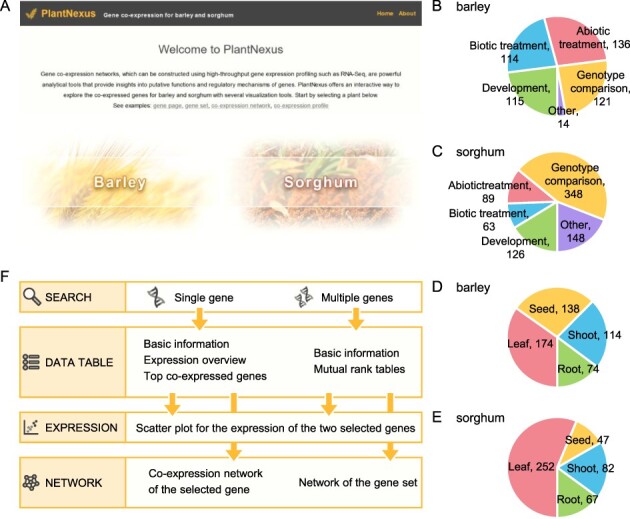
PlantNexus is a new web service for querying and visualizing gene expression and co-expression for barley and sorghum. (A) The home page of PlantNexus. (B) Study type distribution for the barley RNA-seq data sets in PlantNexus. (C) Study type distribution for the sorghum RNA-seq data sets in PlantNexus. (D) Tissue type distribution for the barley RNA-seq data sets in PlantNexus. (E) Tissue type distribution for the sorghum RNA-seq data sets in PlantNexus. Numbers show the RNA-seq data sets for the corresponding category. Data sets with known study types or tissue types are included in the distribution plots. (F) Information architecture of PlantNexus.
Construction and Content
RNA-seq data collection
We queried the NCBI SRA database for RNA-seq data sets for barley (on January 2018) and sorghum (on January 2019) using the term ‘(hordeum_vulgare[Organism] OR sorghum_bicolor[Organism]) AND (biomol_transcript[properties] OR study_type_transcriptome_analysis[properties] OR strategy_rna_seq[properties] OR strategy_FL_cDNA[properties])’. We identified transcriptomic data sets that utilized an RNA-seq strategy. We also manually extracted meta-information including tissue types, developmental stages and treatments, etc., based on the NCBI SRA database and the original publications of these data sets. A total of 735 barley RNA-seq data sets and 1,225 sorghum RNA-seq data sets were downloaded.
RNA-seq data processing pipeline
SRA files were converted to FASTQ format using the fastq-dump command from the SRA toolkit v2.8.2. The quality of raw RNA-seq data sets was examined using FastQC v0.11.5 (Andrews 2010). Low-quality samples, such as those with low average quality scores and overrepresented sequences were excluded. All data sets were trimmed by Trimmomatic v0.36 (Bolger et al. 2014) using default parameters ‘LEADING:3 TRAILING:3 SLIDINGWINDOW:4:15 MINLEN:36’. All trimmed data sets were mapped to barley genome v36 and sorghum v41 from Ensembl Plant (Yates et al. 2020) using STAR v2.5.3 (Dobin et al. 2013) with default parameters ‘–quantMode GeneCounts –outSAMtype None –outSAMmode None –readFilesCommand zcat’. Genome indexes for mapping with STAR were generated using parameters ‘–sjdbOverhang 100 –genomeChrBinNbits 14 –genomeSAindexNbases 12 –genomeSAsparseD 3’. Gene-level expression read counts were directly generated by STAR.
RNA-seq data sets that met the following criteria were used for the construction of barley and sorghum GCNs (van Dam et al. 2018): (i) that >70% of the reads survived after trimming; (ii) that >70% of the reads mapped to the barley or sorghum genomes uniquely; (iii) that they contain at least 10 million uniquely mapped reads. A total of 500 barley data sets and 774 sorghum data sets met these criteria. Raw gene count was normalized using transcripts per kilobase million (TPM) and log2 transformed.
Co-expression network construction
Next, we constructed a global GCN using these selected RNA-seq data sets. Tissue-specific GCNs were also constructed using RNA-seq data sets for specific tissue types for barley and sorghum. To ensure the genes being evaluated for co-expression had adequate expression levels, we filtered the genes and kept those that had a count per million (CPM) ≥ 1 in at least 20 data sets, which resulted in 23,728 barley genes and 26,638 sorghum genes. The expression data for all individual genes, however, are still available in PlantNexus.
Gene co-expression was computed using the widely used method, Pearson correlation coefficient (PCC). We computed a PCC score for each gene pair.
 |
The process was repeated 1,000 times, each time randomly using 80% of the data sets. The PCC scores of the 1,000 repeats were averaged to get a final correlation for each gene pair. The PCC scores were further transformed by mutual rank (MR) (Obayashi and Kinoshita 2009):
 |
where  is the rank of gene y in gene x’s
  list and
  is the rank of gene x in gene y’s
  list. The MR scores were used to rank the co-expressions of genes.
Web service implementation
PlantNexus was implemented with Python (3.8) (https://www.python.org/) framework Django (3.1) (https://www.djangoproject.com/) for the server backend. For the database, SQLite (https://www.sqlite.org/) was used. The front end was implemented with HTML, CSS and JavaScript. The website was designed in a way that any data query to the database was transferred to the frontend by AJAX asynchronously in JSON format. This provides a smooth experience with highly interactive visualization tools and enables users to access all our data through user programs so that PlantNexus can be integrated into their pipelines. Network visualization was implemented using Cytoscape.js (Franz et al. 2016). PlantNexus is hosted by Ohio University.
Utility and Discussion
Overall design of PlantNexus
PlantNexus is focused on the global expression and co-expression patterns of genes for barley and sorghum. To achieve this, we queried the NCBI SRA database and retrieved RNA-seq based transcriptomic profiles for barley and sorghum. After processing a large number of relevant RNA-seq data sets (see Construction and Content), we identified 500 data sets for barley and 774 data sets for sorghum. We manually curated meta information for these data sets and categorized them into four major tissue types, namely leaf, seed, shoot and root. We examined the distributions in terms of study types (Fig. 1B, C) and tissue types (Fig. 1D, E). The major study types were biotic treatment, abiotic treatment, developmental and genotype comparison. For barley, these study types had similar numbers of data sets. For sorghum, genotype comparison accounted for 45% of the RNA-seq data sets we retrieved and processed. In terms of tissue types, the leaf was the most popular tissue type for both barley and sorghum. Yet, all tissue types had an adequate number of data sets, with the minimum being the seed for sorghum (47 data sets). This enabled us to simultaneously construct tissue-specific GCNs while building global GCNs using all data sets.
To build GCNs, we computed a co-expression score for each gene pair using PCC. The computation was repeated 1,000 times, each time using 80% randomly selected data sets. The results were averaged. After we obtained an average PCC score for each gene pair, we transformed the scores using MR. MR considers the rank of two genes in each other’s list ranked by PCCs and is the geometric average of the two ranks. MR is the default co-expression ranking method in many co-expression databases, such as ATTED-II (Obayashi et al. 2018) and RiceFREND (Sato et al. 2013). All results were integrated into a relational database (Fig. 1F), which includes the expression of each gene across the data sets, top co-expressed genes for each gene, basic information such as gene ontology terms extracted from the genome annotation and percent of data sets that express a certain gene, etc. The expression and co-expression results are available at the global level (using all data sets) and at the tissue level (using corresponding data sets).
Compared to other platforms, PlantNexus has several strengths: (i) it has a large amount of RNA-seq data sets that were processed with the same pipeline in a consistent manner; (ii) in addition to the global GCNs, PlantNexus offers tissue level co-expression results; and (iii) PlantNexus has a highly centralized web interface with interactive visualizations for easy navigation of GCNs and expression levels.
Web interface and visualizations
To serve the data, we implemented a web service named PlantNexus. The entry points to the data are ‘single gene’ and ‘multiple gene’ searches (Fig. 2A), which is similar to other plant gene co-expression databases. However, one of the key strengths is that the web interface is highly centralized, meaning that users will be able to easily navigate to and keep track of the data and visualizations. This eliminates the need to switch between browser tabs. On the left side of the web page, users can find search boxes (Fig. 2A) and a result list (Fig. 2B). The right-side area is organized by four tabs (Fig. 2C), ‘Getting Started’, ‘Data Table’, ‘Expression’ and ‘Network’. The ‘Data Table’ shows the data table for a single gene or a gene set. ‘Expression’ and ‘Network’ contain visualization tools. When users click any internal links or buttons, the results will be loaded directly on the same web page and a new button will be added to the result list on the left. The users can switch between previous results and newly opened results using the buttons in the result list. The buttons are organized in tree form such that the browsing order is preserved (Fig. 2B). Data tables and visualization tools are explained using two examples in the following sections. Examples 1 and 2 help validate the co-expression results based on literature evidence. Additionally, a third example is provided to supplement data validation using a case study that compares the co-expression across species (barley in PlantNexus and A. thaliana in ATTED-II).
Fig. 2.

Example use of PlantNexus for a single gene as input. (A) Two search modes are available, ‘single gene’ and ‘multiple genes’. (B) The search results and data loaded through user interactions are organized in button trees. By clicking these buttons, users can switch the display of different results on the same web page. (C) An example data table for a single gene. For each gene, the average expression (box plots) and percent of data sets that express it (pie plots) are visualized. By clicking the corresponding buttons from this page, users can view the co-expression network (D), co-expressed genes (E) and expression plot (F). The network viewer allows users to export the networks, change node and edge color individually or in batches, load selected node (as a gene data table) and edge (as an expression plot), annotate the node and filter the network by various mutual rank cutoffs. The expression plot allows users to filter the plot by tissue types.
Example-1: single gene search
A data table of a single gene, such as the one shown in Fig. 2C, is displayed when users click any gene ID in PlantNexus. Here, the barley gene HORVU1Hr1G039250 is used as an example. This gene is also known as Hordeum vulgare cellulose synthase gene A4 (HvCesA4), which participates in cellulose synthesis in the secondary cell wall of barley (Burton et al. 2004). A query of HORVU1Hr1G039250 returns basic information including its name, gene ontology terms, and external links to Ensembl (Yates et al. 2020) and Uniprot (UniProt 2021). It also has box plots that represent the expression level of HORVU1Hr1G039250 in all samples and across individual tissue types and pie plots that represent the percentage of data sets that show HvCesA4 expression. From the latter, we see that HvCesA4 is expressed in all root data sets and a high percentage of other tissue type data sets (>78.9%) (Fig. 2C, pie plots). In the box plots, we see that the overall expression of HvCesA4 in root data sets (medium log2(TPM + 1) = 7.01) is also higher than other tissues. These results are consistent with previous qPCR observations (Burton et al. 2004). By clicking the ‘All’ button in the ‘Co-expressed genes’ section, users can view the top co-expressed genes with HvCesA4 among all datasets sorted by MR. A data table can be exported (.csv) by clicking a button at the end of the table. As expected, among the top five genes co-expressed with HvCESA4 are HORVU3Hr1G071770 (HvCesA7, MR = 2) and HORVU5Hr1G064230 (HvCesA8, MR = 1), which are both thought to participate in protein:protein interactions with HvCESA4 to form the barley secondary cell wall cellulose synthase complex (Burton et al. 2004). The same analysis can be performed using individual tissue type datasets by clicking either ‘leaf’, ‘root’, ‘shoot’ or ‘flower/seed’.
Clicking the buttons next to the ‘Co-expression network’ section will open the GCNs for HvCesA4 in the ‘Network’ tab (Fig. 2D). The network viewer provides basic functions such as exporting as a network file (which can be loaded into software such as Cytoscape) or an image file. Layout, node/edge colors and node sizes can all be modified. Users can load a specific node, which opens a new data table for the gene, or an edge, which opens the expression plot for the two connecting genes. Importantly, the network can be filtered by MR cutoff (e.g. MR ≤ 5, MR ≤ 10, MR ≤ 20, …). This function allows the user to filter the network to show only the most co-expressed gene pairs. A table below the network lists all the co-expressions in the network with MR values. In addition to the network viewer, users can also visualize the expression of a selected co-expressed gene and HvCesA4 by clicking the plot button in the co-expression table (Fig. 2E) or by loading an edge in the GCNs of HvCesA4 (Fig. 2F). The tissue types are color-coded in the expression plot and their visibility can be controlled separately.
Example-2: gene set search
To demonstrate a multiple gene search, the following genes were queried as an example: HORVU6Hr1G050750 (HvCesA1), HORVU5Hr1G118270 (HvCesA2), HORVU0Hr1G038120 (HvCesA6), HORVU1Hr1G039250 (HvCesA4), HORVU3Hr1G071770 (HvCesA7), HORVU5Hr1G064230 (HvCesA8) and HORVU5Hr1G110000 (HvCesA3) (Fig. 3A, B). The data table tab for a set of genes contains a link to each gene and its description. An arrayed MR table for all data sets and each tissue type can be opened by clicking the corresponding button (Fig. 3C). In the MR table, the length of the bar under each MR value is inversely proportional to the value. Clicking an individual cell opens the associated expression plot (Fig. 3D). The bottom button ‘Plot the network of these genes’ allows one to plot the network for the gene set (Fig. 3E). As expected, the selected genes form two distinct networks. Cellulose synthesis in vascular plants is catalyzed by cellulose synthase complex in a hexameric rosette structure consisting of multiple CesA genes (Hill et al. 2014). In barley, HvCesA1, HvCesA2 and HvCesA6 are responsible for cellulose synthesis in the primary cell wall, while HvCesA4, HvCesA7 and HvCesA8 are responsible for secondary wall cellulose synthesis (Burton et al. 2004). The MR table shows high co-expression (low MR value) among the first group of HvCesA1, HvCesA2 and HvCesA6 and the second group of HvCesA4, HvCesA7 and HvCesA8, yet there is no co-expression among these two groups (Fig. 3C, E). HvCesA3 has a different expression pattern from these genes and is not a component of these two groups (Burton et al. 2004). The results indeed show that HvCesA3 has a high MR (>1,000) with all other six genes (Fig. 3C) and is absent from the network (Fig. 3E). These results are consistent with previous publications.
Fig. 3.

Example use of PlantNexus for a gene set as input. (A) An example search of multiple genes. (B) Search results of multiple genes from (A). (C) A mutual rank table is displayed when users query a set of genes. (D) Expression plot can be loaded directly by clicking the mutual rank in the table. (E) The co-expression of the genes in the gene set can be visualized in a network. In this example, cellulose synthesis genes in primary cell wall and secondary cell wall are disconnected among the two groups, but fully connected within groups.
Example-3: co-expression of PAL1
Phenylalanine ammonia-lyase (PAL) catalyzes the deamination of L-phenylalanine to form trans-cinnamic acid, which is the first step in the phenylpropanoid pathway leading to lignin biosynthesis (Cochrane et al. 2004, Weng and Chapple 2010). Genes involved in this pathway are co-expressed in both Arabidopsis (Mutwil et al. 2008) and grass species (Mutwil et al. 2008, Sibout et al. 2017, Delli-Ponti et al. 2021). Here we have compared the co-expression of the PAL1 gene in barley using PlantNexus and in A. thaliana using ATTED-II (Supplementary Fig. S1 and Supplementary Table S1). In A. thaliana, four PAL genes have been identified: AtPAL1, AtPAL2, AtPAL3 and AtPAL4 (Cochrane et al. 2004, Dressen et al. 2017). AtPAL1, AtPAL2 and AtPAL4 are co-expressed in the co-expression network of AtPAL1 (Supplementary Fig. S1A, green circle) from ATTED-II. The same was found in barley using PlantNexus (Supplementary Fig. S1B, green circle). Other genes involved in lignin biosynthesis, including EMB1144 (chorismite synthase), 4CL (4-hydroxycinnamoyl-CoA ligase), C4H (cinnamate 4-hydroxylase, CYP73A5/CYP98A3), HCT (hydroxycinnamoyl-CoA shikimate/quinate hydroxycinnamoyltransferase) and CCoAOMT1 (S-adenosyl-L-methionine-dependent caffeoyl-CoA O-methyl transferase), were also among the top co-expressed genes in both databases (Supplementary Fig. S1 and Supplementary Table S1). These case studies help further validate the co-expression results for PlantNexus.
Limitation
We acknowledge several limitations of PlantNexus. First, our database is limited both in terms of species and directions of analysis. However, a co-expression network is an important tool for understanding gene functions and such tools are still lacking for barley and sorghum. To build a comprehensive co-expression database, we have processed more than 2,000 RNA-seq SRA libraries from 70 studies across many tissue and study types and curated available metadata information. Second, we did not use developmental stages and treatments information for the construction of the GCNs. These data are not always available and are highly heterogeneous. Although we did not utilize them, we provide all the curated metadata on the website through visualizations or direct download, and users may conduct more in-depth analysis using the data we provide.
Conclusions
In this study, we present PlantNexus, a new web service and database for gene co-expression exploration for barley and sorghum, using a large number of high-quality RNA-seq data sets across many tissue types, developmental stages and treatment conditions. PlantNexus will be updated annually or when a large number of new data sets are available and add new features based on user feedback. We believe PlantNexus will be a valuable resource for the plant research community focusing on barley and sorghum due to 1-the large amount of expression and co-expression data it hosts, 2-consistent RNA-seq processing pipelines used for all data sets, 3-manually curated rich meta-information which enables tissue-level co-expression analyses and 4-a highly centralized and interactive web interface.
Supplementary Material
Acknowledgements
We thank the Ohio Supercomputer Center for providing computing resources. We thank Ohio University OIT for hosting PlantNexus.
Contributor Information
Yadi Zhou, Department of Chemistry and Biochemistry, Ohio University, Athens, OH 45701, USA.
Abhijit Sukul, Department of Chemistry and Biochemistry, Ohio University, Athens, OH 45701, USA.
John W Mishler-Elmore, Department of Chemistry and Biochemistry, Ohio University, Athens, OH 45701, USA.
Ahmed Faik, Department of Environmental and Plant Biology, Ohio University, Athens, OH 45701, USA; Molecular and Cellular Biology Program, Ohio University, Athens, OH 45701, USA.
Michael A Held, Department of Chemistry and Biochemistry, Ohio University, Athens, OH 45701, USA; Molecular and Cellular Biology Program, Ohio University, Athens, OH 45701, USA.
Supplementary Data
Supplementary data are available at PCP online.
Data Availability
All the SRA files are found in the NCBI SRA database. All the data in PlantNexus can be freely accessed without registration requirement at https://plantnexus.ohio.edu/.
Funding
This project was conducted in a facility constructed with support from Research Facilities Improvement Program Grant Number C06 RR-014575-01 from the National Center for Research Resources, National Institutes of Health.
Author Contributions
Y.Z. and M.H. conceived the study. M.H. and A.F. supervised the study. Y.Z. constructed the database and developed the website. Y.Z., A.S. and J.M-E. performed data gathering and processing. Y.Z. and M.H. wrote the manuscript, and all authors critically revised the manuscript and gave final approval.
Disclosures
The authors declare that they have no competing interests.
References
- Andrews S. FastQC: A Quality Control Tool for High Throughput Sequence Data. 2010. http://www.bioinformatics.babraham.ac.uk (January, 2018, date last accessed).
- Aoki Y., Okamura Y., Tadaka S., Kinoshita K. and Obayashi T. (2016) ATTED-II in 2016: a plant coexpression database towards lineage-specific coexpression. Plant Cell Physiol. 57: e5. [DOI] [PMC free article] [PubMed] [Google Scholar]
- Ballouz S., Verleyen W. and Gillis J. (2015) Guidance for RNA-seq co-expression network construction and analysis: safety in numbers. Bioinformatics 31: 2123–2130. [DOI] [PubMed] [Google Scholar]
- Bolger A.M., Lohse M. and Usadel B. (2014) Trimmomatic: a flexible trimmer for Illumina sequence data. Bioinformatics 30: 2114–2120. [DOI] [PMC free article] [PubMed] [Google Scholar]
- Burton R.A., Shirley N.J., King B.J., Harvey A.J. and Fincher G.B. (2004) The CesA gene family of barley. Quantitative analysis of transcripts reveals two groups of co-expressed genes. Plant Physiol. 134: 224–236. [DOI] [PMC free article] [PubMed] [Google Scholar]
- Cantalapiedra C.P., Garcia-Pereira M.J., Gracia M.P., Igartua E., Casas A.M. and Contreras-Moreira B. (2017) Large differences in gene expression responses to drought and heat stress between elite barley cultivar Scarlett and a Spanish landrace. Front. Plant Sci. 8: 647. [DOI] [PMC free article] [PubMed] [Google Scholar]
- Cochrane F.C., Davin L.B. and Lewis N.G. (2004) The Arabidopsis phenylalanine ammonia lyase gene family: kinetic characterization of the four PAL isoforms. Phytochemistry 65: 1557–1564. [DOI] [PubMed] [Google Scholar]
- Delli-Ponti R., Shivhare D. and Mutwil M. (2021) Using gene expression to study specialized metabolism—a practical guide. Front. Plant Sci. 11: 2074. [DOI] [PMC free article] [PubMed] [Google Scholar]
- Dobin A., Davis C.A., Schlesinger F., Drenkow J., Zaleski C., Jha S., et al. (2013) STAR: ultrafast universal RNA-seq aligner. Bioinformatics 29: 15–21. [DOI] [PMC free article] [PubMed] [Google Scholar]
- Dressen A., Hilberath T., Mackfeld U., Billmeier A., Rudat J. and Pohl M. (2017) Phenylalanine ammonia lyase from Arabidopsis thaliana (AtPAL2): a potent MIO-enzyme for the synthesis of non-canonical aromatic alpha-amino acids: part I: comparative characterization to the enzymes from Petroselinum crispum (PcPAL1) and Rhodosporidium toruloides (RtPAL). J. Biotechnol. 258: 148–157. [DOI] [PubMed] [Google Scholar]
- Franz M., Lopes C.T., Huck G., Dong Y., Sumer O. and Bader G.D. (2016) Cytoscape.js: a graph theory library for visualisation and analysis. Bioinformatics 32: 309–311. [DOI] [PMC free article] [PubMed] [Google Scholar]
- Gaudinier A., Rodriguez-Medina J., Zhang L., Olson A., Liseron-Monfils C., Bagman A.M., et al. (2018) Transcriptional regulation of nitrogen-associated metabolism and growth. Nature 563: 259–264. [DOI] [PubMed] [Google Scholar]
- Hennet L., Berger A., Trabanco N., Ricciuti E., Dufayard J.F., Bocs S., et al. (2020) Transcriptional regulation of sorghum stem composition: key players identified through co-expression gene network and comparative genomics analyses. Front. Plant Sci. 11: 224. [DOI] [PMC free article] [PubMed] [Google Scholar]
- Hill J.L. Jr., Hammudi M.B. and Tien M. (2014) The Arabidopsis cellulose synthase complex: a proposed hexamer of CESA trimers in an equimolar stoichiometry. Plant Cell 26: 4834–4842. [DOI] [PMC free article] [PubMed] [Google Scholar]
- Lee S., Lee T., Yang S. and Lee I. (2020) BarleyNet: a network-based functional omics analysis server for cultivated barley, Hordeum vulgare L. Front. Plant Sci. 11: 98. [DOI] [PMC free article] [PubMed] [Google Scholar]
- Makita Y., Shimada S., Kawashima M., Kondou-Kuriyama T., Toyoda T. and Matsui M. (2015) MOROKOSHI: transcriptome database in Sorghum bicolor. Plant Cell Physiol. 56: e6. [DOI] [PMC free article] [PubMed] [Google Scholar]
- Mochida K., Uehara-Yamaguchi Y., Yoshida T., Sakurai T. and Shinozaki K. (2011) Global landscape of a co-expressed gene network in barley and its application to gene discovery in Triticeae crops. Plant Cell Physiol. 52: 785–803. [DOI] [PMC free article] [PubMed] [Google Scholar]
- Mutwil M., Øbro J., Willats W.G. and Persson S. (2008) GeneCAT—novel webtools that combine BLAST and co-expression analyses. Nucleic Acids Res. 36: W320–W326. [DOI] [PMC free article] [PubMed] [Google Scholar]
- Obayashi T., Aoki Y., Tadaka S., Kagaya Y. and Kinoshita K. (2018) ATTED-II in 2018: a plant coexpression database based on investigation of the statistical property of the mutual rank index. Plant Cell Physiol. 59: e3. [DOI] [PMC free article] [PubMed] [Google Scholar]
- Obayashi T. and Kinoshita K. (2009) Rank of correlation coefficient as a comparable measure for biological significance of gene coexpression. DNA Res. 16: 249–260. [DOI] [PMC free article] [PubMed] [Google Scholar]
- Obayashi T., Okamura Y., Ito S., Tadaka S., Aoki Y., Shirota M., et al. (2014) ATTED-II in 2014: evaluation of gene coexpression in agriculturally important plants. Plant Cell Physiol. 55: e6. [DOI] [PMC free article] [PubMed] [Google Scholar]
- Proost S. and Mutwil M. (2017) PlaNet: comparative co-expression network analyses for plants. Methods Mol. Biol. 1533: 213–227. [DOI] [PubMed] [Google Scholar]
- Rao X., Chen X., Shen H., Ma Q., Li G., Tang Y., et al. (2019) Gene regulatory networks for lignin biosynthesis in switchgrass (Panicum virgatum). Plant Biotechnol. J. 17: 580–593. [DOI] [PMC free article] [PubMed] [Google Scholar]
- Sato Y., Namiki N., Takehisa H., Kamatsuki K., Minami H., Ikawa H., et al. (2013) RiceFREND: a platform for retrieving coexpressed gene networks in rice. Nucleic Acids Res. 41: D1214–D1221. [DOI] [PMC free article] [PubMed] [Google Scholar]
- Serin E.A., Nijveen H., Hilhorst H.W. and Ligterink W. (2016) Learning from co-expression networks: possibilities and challenges. Front. Plant Sci. 7: 444. [DOI] [PMC free article] [PubMed] [Google Scholar]
- Sibout R., Proost S., Hansen B.O., Vaid N., Giorgi F.M., Ho-Yue-Kuang S., et al. (2017) Expression atlas and comparative coexpression network analyses reveal important genes involved in the formation of lignified cell wall in Brachypodium distachyon. New Phytol. 215: 1009–1025. [DOI] [PubMed] [Google Scholar]
- Tester M. and Langridge P. (2010) Breeding technologies to increase crop production in a changing world. Science 327: 818–822. [DOI] [PubMed] [Google Scholar]
- UniProt C. (2021) UniProt: the universal protein knowledgebase in 2021. Nucleic Acids Res. 49: D480–D489. [DOI] [PMC free article] [PubMed] [Google Scholar]
- van Dam S., Vosa U., van der Graaf A., Franke L. and de Magalhaes J.P. (2018) Gene co-expression analysis for functional classification and gene-disease predictions. Brief. Bioinformatics 19: 575–592. [DOI] [PMC free article] [PubMed] [Google Scholar]
- Weng J.K. and Chapple C. (2010) The origin and evolution of lignin biosynthesis. New Phytol. 187: 273–285. [DOI] [PubMed] [Google Scholar]
- Wisecaver J.H., Borowsky A.T., Tzin V., Jander G., Kliebenstein D.J. and Rokas A. (2017) A global coexpression network approach for connecting genes to specialized metabolic pathways in plants. Plant Cell 29: 944–959. [DOI] [PMC free article] [PubMed] [Google Scholar]
- Yates A.D., Achuthan P., Akanni W., Allen J., Allen J., Alvarez-Jarreta J., et al. (2020) Ensembl 2020. Nucleic Acids Res. 48: D682–D688. [DOI] [PMC free article] [PubMed] [Google Scholar]
- Yim W.C., Yu Y., Song K., Jang C.S. and Lee B.M. (2013) PLANEX: the plant co-expression database. BMC Plant Biol. 13: 83. [DOI] [PMC free article] [PubMed] [Google Scholar]
- Yu H., Jiao B. and Liang C. (2017) Systematic analysis of RNA-seq-based gene co-expression across multiple plants. bioRxiv 139923. [Google Scholar]
- Yuan H., Zeng X., Ling Z., Wei Z., Wang Y., Zhuang Z., et al. (2017) Transcriptome profiles reveal cold acclimation and freezing tolerance of susceptible and tolerant hulless barley genotypes. Acta Physiol. Plant 39: 275. [Google Scholar]
- Zhang J., Zheng H., Li Y., Li H., Liu X., Qin H., et al. (2016) Coexpression network analysis of the genes regulated by two types of resistance responses to powdery mildew in wheat. Sci. Rep. 6: 23805. [DOI] [PMC free article] [PubMed] [Google Scholar]
Associated Data
This section collects any data citations, data availability statements, or supplementary materials included in this article.
Supplementary Materials
Data Availability Statement
All the SRA files are found in the NCBI SRA database. All the data in PlantNexus can be freely accessed without registration requirement at https://plantnexus.ohio.edu/.