Abstract
Directed transfer of carriers, akin to excited charges in photosynthesis, in semiconductors by structural design is challenging. Here, TiO2 nanosheets with interlayered sp2 carbon and titanium vacancies are obtained by low-temperature controlled oxidation calcination. The directed transfer of carriers from the excited position to Ti-vacancies to interlayered carbon is investigated and proven to greatly increase the charge transport efficiency. The TiO2/C obtained demonstrates excellent photocatalytic and photoelectrochemical activity and significant lithium/sodium ion storage performance. Further theoretical calculations reveal that the directional excited position/Ti-vacancies/interlayered carbon facilitate the spatial inside-out cascade electron transfer, resulting in high charge transfer kinetics.
Directional charge transfer in TiO2 nanosheets is achieved by design of TiO2 lattice-Ti vacancy-interlayered sp2 carbon at the interface.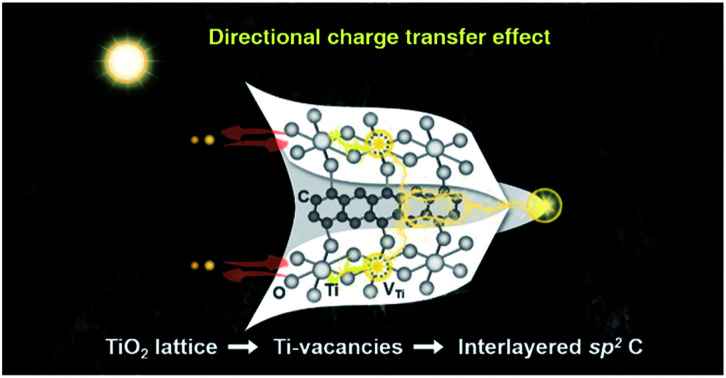
1. Introduction
Semiconductors are able to generate excited carriers that diffuse to the surface for photo/electro chemical reactions. The fast transfer and efficient utilization of carriers are critical to high performance in the desired application.1–4 Generally, the electron transfer at the single nanocrystal or interface of nanocrystals is random, often resulting in the electron dissipation and/or recombination before the electrons reach the surface of semiconductors for the redox reaction.5,6 Therefore, directed transfer of carriers, akin to excited charges in photosynthesis, enables a minimum of energy-loss and a maximum of energy-utilization. However, realizing directional charge transfer in semiconductors by structural design is challenging.
Titanium oxide (TiO2) has gained great attention as one of the most promising semiconductors for various photo and electrochemical applications.7,8 Carbon has been widely used to composite TiO2 as an electron acceptor for enhancement of the charge transfer.9–11 Carbonization in an inert atmosphere is a common way to fabricate the composition and doping structure.12,13 However, it will inevitably also form undesired carbon species such as low conductive sp3 carbon on the surface. Nanocarbon with a rich sp2 carbon structure, such as graphene sheets, enhances the conductivity and enables efficient charge transfer conductive performance in TiO2-based composites.14,15 However, the directed transfer of electrons only occurs in a limited range of the interfacial junction between TiO2 and nanocarbon in most cases.Recently, we have designed a spatially inside-out heterojunction with directed transfer of carriers, in which CQDs act as a bridge for interfacial charge transfer and graphene as a net for charge collection.11 It has to be pointed out that this ternary structure requires very careful adjustment and pre-formed nanocarbon with the sp2 structure. At high calcination temperature (over 1000 °C),16 the hydrocarbon precursor starts to transform into the graphitic sp2 structure, but at this temperature the size of the semiconductor particles, their crystal phases and morphologies would be greatly changed and even fused. Therefore, the common calcination method in an inert atmosphere is not suitable for the preparation of rich sp2 carbon in TiO2via precursor carbonization. Note that the calcination in air (so-called oxidative calcination) could easily lead to the removal of the surface carbon species of nanocomposites by oxidation at mild temperature (300–600 °C),17 but not to the removal of the carbon species from the crystal framework. Therefore, one theoretical possibility arises, namely that the oxidative calcination not only transforms titanium compounds into TiO2 and remove the unsatisfied surface carbon, but also forms inner rich-sp2 carbon confined by TiO2. The nanosheet structure recently developed is very elegant, which enables an abundance of vacancies and coordinatively unsaturated sites, shortens the mass diffusion length and greatly improves charge transfer performance.18–20 The rich-sp2 carbon structure in TiO2 nanosheets would therefore be a very effective design for directional charge transfer.
In this study, lamellar titanium glycerolate is chosen as the precursor for the synthesis of anatase TiO2 nanosheets with interlayered rich-sp2 carbon using a well-defined oxidization calcination process. The oxygen-rich environment contributes to the formation of titanium vacancies (Ti-vacancies). The directed transfer of carriers from the excited position to Ti-vacancies to interlayered carbon is investigated and proven to greatly increase the charge transport efficiency and electrical conductivity. Consequently, TiO2/C demonstrates significant photocatalytic and photoelectrochemical activity and excellent lithium/sodium ion storage.
2. Results and discussion
TGA-DTA of titanium glycerolate (denoted as Ti-G) (Fig. S1, ESI†) indicates the removal of surface carbon in the range of 300–339 °C and the phase transformation from anatase to the rutile structure at 435 °C. Therefore, we choose 350 °C for the synthesis of the metastable anatase phase TiO2/C composite without surface carbon, while the interlayered carbon species are still coordinated to TiO2 (detailed description in the ESI†). SEM images (Fig. S2a, ESI†) show that Ti-G is a flower-like particle with a uniform size of around 3 μm, and calcination leads to aggregation of nanocrystals in the branches (Fig. S2, ESI†). XRD patterns (Fig. S3, ESI†) and Raman spectra (Fig. S4, ESI†) indicate that calcination at 350 °C in air results in the phase transformation from titanium glycerolate to anatase TiO2. And calcination at 550 °C could lead to the formation of the rutile phase. N2 adsorption–desorption measurements (Fig. S5, ESI†) of the TiO2 sample calcined at 350 °C in air disclose a type II isotherm (indicative of non- or macroporous adsorbents) with an H3 hysteresis loop (due to non-rigid aggregates of plate-like particles).21 It also shows mesopores of around 3 nm and a large fraction of mesopores larger than 10 nm by the packing of the TiO2 nanocrystals, with a tube structure of 25 nm. Notably, the sample calcined at 350 °C in Ar has only 24 m2 g−1 of BET surface area with no obvious porous structure (Fig. S5 and Table S1, ESI†), because it has surface carbon that could block the pores.
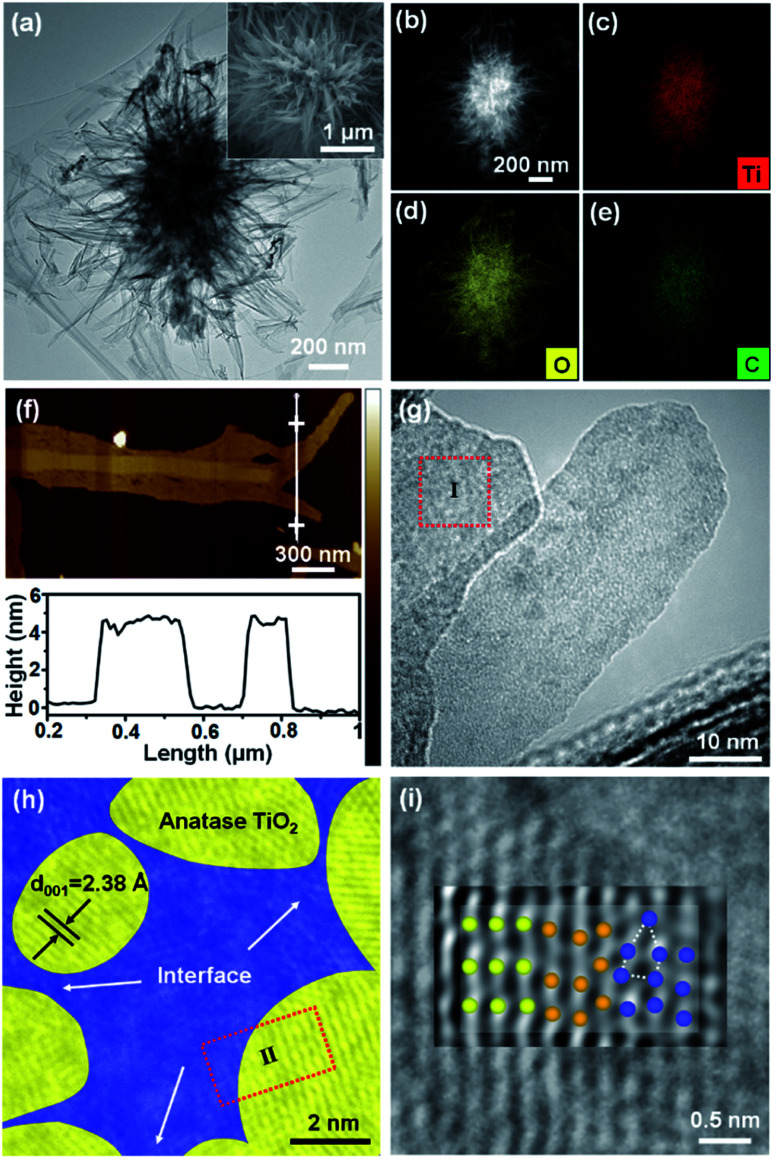
As shown in Fig. 1a and the inset, the flower-like structure of TiO2/CInter is assembled by very thin nanosheets. The STEM image and the corresponding EDX spectral mapping images (Fig. 1b–e) indicate the uniform distribution of Ti, C and O elements. The AFM tomography studies (Fig. 1f) show that the branches of the particle are nanosheets with a thickness of around 4–5 nm, which is in accordance with the magnified TEM image (Fig. S6, ESI†). The HRTEM image (Fig. 1h, S7a and b, ESI†) shows the lattice fringes with an interplanar spacing of 0.35 nm, which agrees with the (101) planes of anatase TiO2. The anatase TiO2 nanocrystals (Fig. 1h, yellow areas) are surrounded by an amorphous phase (Fig. 1h, blue areas). In the HRTEM image and the inverse FFT image (Fig. 1i and S7b–d, ESI†), the ordered lattice fringes (light yellow, left), the lattice distortions (dark yellow, middle) and the disordered amorphous phase (blue, right, probably involving amorphous TiO2 and carbon) are clearly recognized. This kind of crystalline/semi-crystalline/amorphous interface is coherent at the atomic scale and thus becomes a platform for the inner carbon and defect generation and minimizes interface loss of energy.
Fig. 1. (a) TEM image, inset: SEM image, (b) STEM image and the corresponding EDX mapping image of (c) Ti, (d) O, and (e) C elements, (f) AFM topography image and the corresponding height information of TiO2/CInter (g) TEM image, (h) magnified TEM image of region I and (i) original image and inverse FFT image of region II, and the corresponding atomic models of the highly crystalline phase (ordered lattice, light yellow, left), nanofusion phase (dark yellow, middle), and semi-crystalline/amorphous phase (disordered defects, blue, right) of TiO2/CInter. Fig. parts (h) and (i) are given in Fig. S7, ESI† as originals without the interpreting color overlay.
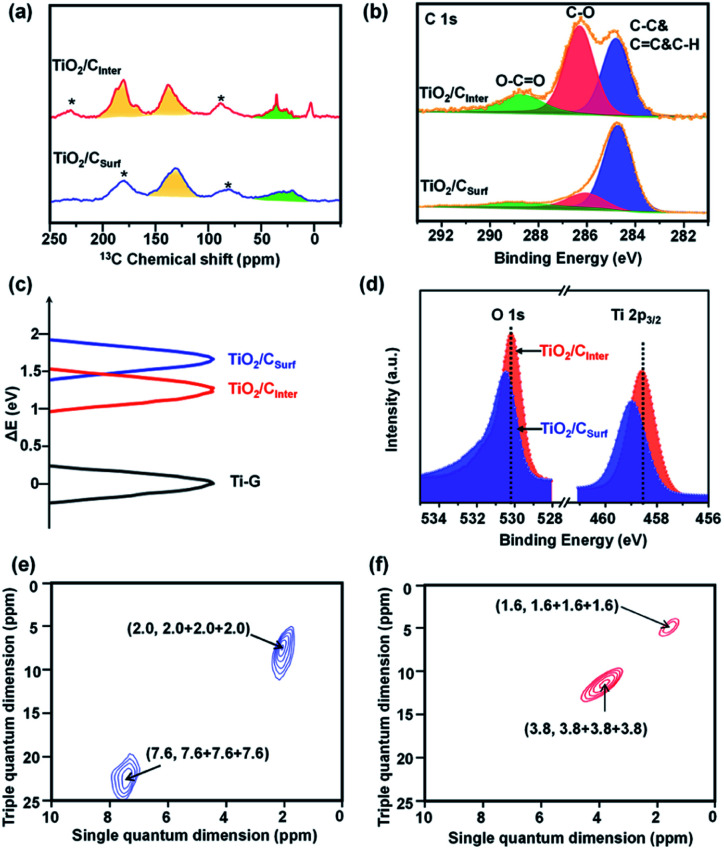
13C cross-polarization/magic-angle spinning NMR is an effective method to investigate carbon species comprehensively and quantitatively.22–24 For comparison, TiO2 mainly with surface carbon (named TiO2/CSurf, by calcination from Ti-G at 350 °C in an Ar atmosphere) is also characterized. Ti-G shows three well resolved peaks between 69 and 90 ppm (Fig. S8, ESI†), indicating the successful coordination of glycerol.25,26 The peaks near 138 ppm in TiO2/CInter (Fig. 2a and S9, ESI†) and 135 ppm in TiO2/CSurf are assigned to sp2 hybridized C atoms.24,27 The peaks around 30–50 ppm are assigned to sp3 C atoms.27 Besides, TiO2/CInter shows an additional peak at around 180 ppm, which can be ascribed to C O with sp2 hybridized carbon. Very interestingly, the ratio of sp2 and sp3 in TiO2/CInter is about 2.6-fold that of the TiO2/CSurf (Fig. S9 and Table S2, detailed description in the ESI†), suggesting a high level of sp2 carbon in TiO2/CInter. Raman spectra (Fig. S10, ESI†) show only graphite carbon in TiO2/CInter and the weak peak indicates the low content and inner structure of carbon species.28 The high-resolution C 1s spectra (Fig. 2b) could be deconvoluted as the C–C bond (around 284.8 eV), C–O–(Ti) bond (around 286.3 eV) and O–C O (around 288.7 eV).29,30 There is an obvious difference of the peak area ratio of the C–C bond and C–O–(Ti) bond between TiO2/CInter (0.84) and TiO2/CSurf (4.52) (Fig. 2b). Further evidence is provided by the surface carbon content and C/Ti ratio calculated from Ti 2p and C 1s XPS data (Fig. S11 and Table S3, detailed description in the ESI†). TiO2/CInter shows a low surface carbon content (15.0 at%) near to the sample calcined at 550 °C (15.5 at%), while TiO2/CSurf shows a relatively high carbon content (44.7 at%) similar to the original carbon content in Ti-G (47.0 at%). These observations suggest that the surface carbon content can be reduced by oxidization calcination but the inner carbon species in TiO2/CInter would remain. This can also be observed in the FT-IR spectra (Fig. S12, detailed description in the ESI†). After low temperature calcination, TiO2/CInter exhibits a grey color with enhanced visible-light absorption and a narrower bandgap (Fig. S13, ESI†). The more positive Ti 2p chemical shifts of TiO2/CInter and TiO2/CSurf indicate the increase of the electron–electron repulsion around the Ti atoms by strong interactions of the Ti–O–C bonds (Fig. 2c and d). The O 1s core-level XPS spectrum of TiO2/CInter (Fig. S11c, ESI†) displays the major peaks caused by the O2− ions in the O–Ti–O lattice (around 530.0 eV).31,32 The O− species (around 532.0 eV) are considered to correlate with the Ti-vacancies to compensate for the Ti4+ deficiencies.33–35 The formation of Ti-vacancies can be deduced from the surface O/Ti ratio of the samples (Fig. S11e and Table S3, detailed description in the ESI†). The EPR spectrum of TiO2/CInter (Fig. S14, ESI†) shows a strong signal at g = 1.998, which could be assigned to Ti-vacancies.36,37
Fig. 2. (a) 13C NMR spectra of TiO2/CInter and TiO2/CSurf, * indicates the signal of the rotor cap, (b) XPS C 1s spectra of TiO2/CInter and TiO2/CSurf, (c) Ti 2p3/2 chemical shift among Ti-G, TiO2/CInter and TiO2/CSurf. (d) Ti 2p3/2 and O 1s XPS spectra of TiO2/CInter and TiO2/CSurf, and (e and f) 1H TQ-SQ MAS NMR spectra of (e) TiO2/CInter, and (f) TiO2/CSurf.
The two-dimensional (2D) 1H TQ-SQ MAS NMR method is an effective way to identify the local structure and interactions in TiO2 by the investigation of titanol (Ti–OH) sites.38,39 The dipolar interactions of 1H can directly probe the spatial proximities of Ti–OH groups such as surface Ti–OH, Ti–OH from broken Ti–O–Ti bonds and Ti–OH nests from Ti vacancies. More importantly, the interlayered carbon could also affect the chemical state of the Ti–OH groups. The signal of surface Ti–OH groups in mutual spatial proximity is observed in both TiO2/CSurf (2.0, 2.0 + 2.0 + 2.0) (Fig. 2e) and TiO2/CInter (1.6, 1.6 + 1.6 + 1.6) (Fig. 2f). Besides, TiO2/CSurf shows a signal at (7.6, 7.6 + 7.6 + 7.6), which indicates that the Ti–OH species from broken Ti–O–Ti bonds are spatially close. Meanwhile, TiO2/CInter shows a signal at (3.8, 3.8 + 3.8 + 3.8), which can be assigned to the Ti–OH nests caused by titanium vacancies. Notably, the chemical shift of the Ti–OH nests in TiO2/CInter moves to a high field,35 indicating that the interlayered carbon species have strong interactions with the Ti–OH nests. It can be deduced that low-temperature calcination in air could remove the surface carbon species and maintain the interlayered carbon, meanwhile contributing to the formation of titanium vacancies.
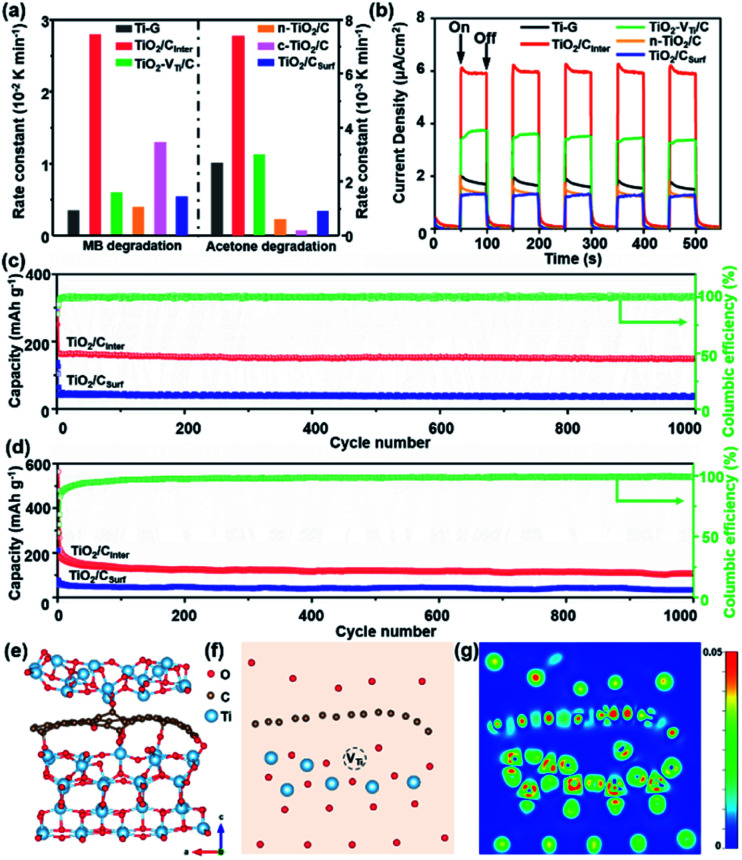
To further investigate the role of interlayered carbon in TiO2/CInter, photodegradation of an organic pollutant in liquid and gas phases (methylene blue, MB and acetone, respectively) was performed. For comparison, the performance of Ti-G, TiO2 with titanium vacancies and mixed carbon (named TiO2–VTi/C), normal TiO2 without titanium vacancies but with carbon (named n-TiO2/C), commercial TiO2 nanotubes with carbon (named c-TiO2/C) and TiO2/CSurf was also investigated. TiO2/CInter exhibits the highest photocatalytic activity (Fig. 3a) compared to other TiO2/C composites in MB and acetone degradation. The photocatalytic stability test of TiO2/CInter shows that around 97% of photocatalytic activity is retained after five cycles of photocatalysis (Fig. S15a, ESI†), and a strong signal of Ti-vacancies from EPR can be clearly observed (Fig. S15b, ESI†), suggesting the high stability of Ti-vacancies. Photoelectrochemical studies (Fig. 3b) reveal that TiO2/CInter exhibits the highest photocurrent intensity of 6 μA cm−2, which is 3-fold, 1.5-fold, 3.7-fold and 3.8-fold that of Ti-G, TiO2–VTi/C, n-TiO2/C, and TiO2/CSurf, respectively. The EIS Nyquist plots of TiO2/CInter after irradiation with UV-Vis light display the smallest semicircle among all the samples (Fig. S16, ESI†), indicating that titanium vacancies and interlayered carbon are beneficial for the hole transfer to the electrolyte and thus greatly reduce the charge transfer resistance.40
Fig. 3. (a) Photocatalytic rate constants for degradation of methylene blue (MB) and acetone with (a) Ti-G, (b) TiO2/CInter, (c) TiO2–VTi/C, (d) n-TiO2/C (e) c-TiO2/C and (f) TiO2/CSurf, and (b) transient photocurrent response of Ti-G, TiO2/CInter, TiO2–VTi/C, n-TiO2/C and TiO2/CSurf. (c) Lithium-ion and (d) sodium-ion long cycle performance at a current density of 10 C. (e) The optimized model of TiO2 with interlayered carbon and titanium vacancies, (f) the section model of TiO2/CInter of the (010) facet and (g) the corresponding charge density difference.
TiO2/C samples were further applied as anode materials for lithium/sodium storage properties. It can be observed that TiO2/CInter exhibits the highest charge capacity after 300 cycles at 1 C in comparison with other TiO2/C anodes (Fig. S17, ESI†) and good structural stability (Fig. S18, detailed description in the ESI†). Further, TiO2/CInter has better reversible capacity and rate capability in comparison with TiO2/CSurf (Fig. S19, ESI†). At a current density of 10 C (1.7 A g−1), TiO2/CInter shows a high reversible specific capacity of 148 mA h g−1 for lithium storage and 108 mA h g−1 for sodium storage after 1000 cycles at 10 C (Fig. 3c and d), demonstrating its outstanding cycling performances in comparison with other TiO2/C-based electrodes (Table S4, ESI†).
To gain further insight into the decisive role of interlayered carbon in efficient charge transfer and the stability of TiO2/CInter from a theoretical point of view, density functional theory (DFT) calculations were performed. The charge density difference of an optimized model of TiO2 with interlayered carbon and titanium vacancies (Fig. 3e and S20a, ESI†) shows obvious accumulation of electrons at the interfacial carbon layer in comparison with TiO2 with surface carbon species or no carbon (Fig. S20b–d, ESI†). The sectional charge density difference gives a clear view of the charge accumulation around the titanium vacancies and interlayer carbon, which could act as a bridge for efficient cascade and directed charge transfer from inside the lattice to the outer surface (Fig. 3f and g). The calculated formation energy (Tables S5 and S6†) indicates the good stability of TiO2 with interlayered carbon and titanium vacancies (detailed description of theoretical calculations in the ESI†). The calculation results clearly indicate that interlayered carbon can significantly facilitate the charge transfer and therefore enhance the photo/electro-catalytic performance.
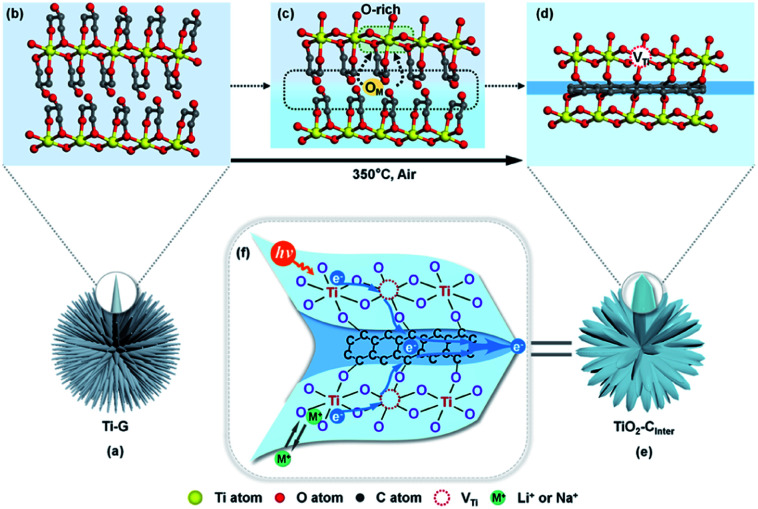
The formation process of TiO2/CInter we proposed is illustrated in Fig. 4. Ti-G with the oriented lamellar structure (Fig. 4a and b) starts to dehydrate and carbonize during the early stage of calcination at 350 °C. The surface carbon and inner carbon form, which contain sp2 and sp3 types of carbon. With prolongation of the calcination time, the surface carbon is oxidized and removed (Fig. 4c). At the same time, the inner carbon remains and further rearranges to the sp2 type because of the confinement effect by the lamellar structure of TiO2 (Fig. 4d).
Fig. 4. (a)–(e) Schematic illustration of the formation mechanism of TiO2/CInter, (b–d) the simulated atomic change process from Ti-G to TiO2/CInter, OM refers to migrating oxygen. (f) Schematic description of the fast electron-transfer pathway and the proposed mechanism.
In the meantime, the escaped oxygen from the inner phase would form an oxygen-rich environment at the interface, which is beneficial for the formation of titanium vacancies (Fig. 4c and d). The formation of titanium vacancies can be described as: where
where  represents a titanium vacancy, and h˙ represents a hole.
Finally, TiO2 nanosheets with interlayered carbon and titanium vacancies (Fig. 4d and e) are obtained by this low temperature calcination strategy (detailed description of the formation of interfacial defects in the ESI†).
The proposed mechanism of TiO2/CInter for photocatalysis and lithium/sodium storage is shown in Fig. 4f. The interlayer carbon and Ti-vacancies form a spatial inside-out electron transfer cascade from the lattice to the surface, which is not only beneficial to the charge separation in photocatalysis, but also enhances the interfacial conductivity for efficient electron transfer and Li+/Na+ insertion. Besides, the ultrathin nanosheet could shorten the diffusion length of electrons (including photogenerated electrons) and Li+/Na+, and the high specific area of nanosheets provides large contact area for photo/electrocatalytic reactions. Moreover, the amorphous TiO2/carbon interface is helpful to restrain the collapse of the nanostructure in the insertion/removal reactions, thus contributing to excellent stability.
3. Conclusions
In summary, TiO2 nanosheets with interfacial carbon and titanium vacancies have been prepared successfully by a controlled oxidation calcination. The confined carbon in the interlayer is crucial to a directional and efficient charge transfer, thus contributing to significantly increased photocatalytic activity and electrochemical performance. Our work provides a simple but effective way for high-performance design of semiconductors featuring low cost, high efficiency, and high stability.
Data availability
The data that supports the findings of this study are available within the ESI† and from the corresponding author upon reasonable request.
Author contributions
S. M. W. carried out the experiments of synthesis, photocatalytic performance and the lithium/sodium storage experiments. X. Y. Y. conceived the project, provided the idea, and guided the experiments. Y. T. W., Y. X. Z. S. T. X. helped with the experiments. X. F. Z. and L. Y. W. helped with the NMR measurements and corresponding analysis. S. M. W. and X. Y. Y. proposed the mechanisms. J. B. C. performed the DFT calculation and helped with the analysis. G. T. performed the measurements of TEM. S. M. W. and X. Y. Y. wrote and revised the paper. C. J., M. S. and D. W. B. revised the paper. All authors have given approval to the final version of the manuscript.
Conflicts of interest
There are no conflicts to declare.
Supplementary Material
Acknowledgments
This work was supported by a joint National Natural Science Foundation of China-Deutsche Forschungsgemeinschaft (NSFC-DFG) project (NSFC grant 51861135313, DFG JA466/39-1), Sino-German Center COVID-19 Related Bilateral Collaborative Project (C-0046), Shenzhen Science and Technology Program (JCYJ20210324142010029), Guangdong Basic and Applied Basic Research Foundation (2019A1515110435), Guangdong Province International Scientific and Technological Cooperation Projects (2020A0505100036), National 111 project (B20002) and PCSIRT (IRT_15R52). D.W.B. acknowledges financial support from Saint Petersburg State University (Research Grant 39054581). The authors would like to thank Prof. Reshef Tenne from Weizmann Institute of Science, Lu Wu from Hubei University for helpful discussion and the Nanostructure Research Centre (NRC) for the S/TEM work.
Electronic supplementary information (ESI) available. See https://doi.org/10.1039/d2sc01872a
Notes and references
- Zhang P. Wang T. Chang X. Gong J. Acc. Chem. Res. 2016;49:911. doi: 10.1021/acs.accounts.6b00036. [DOI] [PubMed] [Google Scholar]
- Cowan A. J. Durrant J. R. Chem. Soc. Rev. 2013;42:2281. doi: 10.1039/C2CS35305A. [DOI] [PubMed] [Google Scholar]
- Wang H. Zhang L. Chen Z. Hu J. Li S. Wang Z. Liu J. Wang X. Chem. Soc. Rev. 2014;43:5234. doi: 10.1039/C4CS00126E. [DOI] [PubMed] [Google Scholar]
- Zhang Y. C. Afzal N. Pan L. Zhang X. Zou J. J. Adv. Sci. 2019;6:1900053. doi: 10.1002/advs.201900053. [DOI] [PMC free article] [PubMed] [Google Scholar]
- Xu Q. Zhang L. Cheng B. Fan J. Yu J. Chem. 2020;6:1543. [Google Scholar]
- Chen F. Ma T. Zhang T. Zhang Y. Huang H. Adv. Mater. 2021;33:2005256. doi: 10.1002/adma.202005256. [DOI] [PubMed] [Google Scholar]
- Ma Y. Wang X. Jia Y. Chen X. Han H. Li C. Chem. Rev. 2014;114:9987. doi: 10.1021/cr500008u. [DOI] [PubMed] [Google Scholar]
- Guo Q. Zhou C. Ma Z. Yang X. Adv. Mater. 2019;31:1901997. doi: 10.1002/adma.201901997. [DOI] [PubMed] [Google Scholar]
- Leary R. Westwood A. Carbon. 2011;49:741. doi: 10.1016/j.carbon.2010.10.010. [DOI] [Google Scholar]
- Wang S. Xu M. Peng T. Zhang C. Li T. Hussain I. Wang J. Tan B. Nat. Commun. 2019;10:1. doi: 10.1016/j.carbon.2018.09.033. [DOI] [PMC free article] [PubMed] [Google Scholar]
- Lu Y. Liu X.-L. He L. Zhang Y.-X. Hu Z.-Y. Tian G. Cheng X. Wu S.-M. Li Y.-Z. Yang X.-H. Wang L. Y. Liu J. W. Janiak C. Chang G. G. Li W. H. Van Tendeloo G. Yang X. Y. Su B. L. Nano Lett. 2020;20:3122. doi: 10.1021/acs.nanolett.9b05121. [DOI] [PubMed] [Google Scholar]
- Qin Q. Zhao Y. Schmallegger M. Heil T. Schmidt J. Walczak R. Gescheidt-Demner G. Jiao H. Oschatz M. Angew. Chem., Int. Ed. 2019;58:13101. doi: 10.1002/anie.201906056. [DOI] [PubMed] [Google Scholar]
- Niu P. Wu T. Wen L. Tan J. Yang Y. Zheng S. Liang Y. Li F. Irvine J. T. Liu G. Adv. Mater. 2018;30:1705999. doi: 10.1002/adma.201705999. [DOI] [PubMed] [Google Scholar]
- Li B. Xi B. Feng Z. Lin Y. Liu J. Feng J. Qian Y. Xiong S. Adv. Mater. 2018;30:1705788. doi: 10.1002/adma.201705788. [DOI] [PubMed] [Google Scholar]
- Zhu Y. E. Yang L. Sheng J. Chen Y. Gu H. Wei J. Zhou Z. Adv. Energy Mater. 2017;7:1701222. doi: 10.1002/aenm.201701222. [DOI] [Google Scholar]
- Ding Y. Zeng M. Fu L. Sci. Bull. 2019;64:1817. doi: 10.1016/j.scib.2019.10.009. [DOI] [PubMed] [Google Scholar]
- Li W. Wu Z. X. Wang J. X. Elzatahry A. A. Zhao D. Y. Chem. Mater. 2014;26:287. doi: 10.1021/cm4014859. [DOI] [Google Scholar]
- Zhang S. Zhao Y. Shi R. Zhou C. Waterhouse G. I. Wu L. Z. Tung C. H. Zhang T. Adv. Energy Mater. 2020;10:1901973. doi: 10.1002/aenm.201901973. [DOI] [Google Scholar]
- Zhao Y. Zheng L. Shi R. Zhang S. Bian X. Wu F. Cao X. Waterhouse G. I. Zhang T. Adv. Energy Mater. 2020;10:2002199. doi: 10.1002/aenm.202002199. [DOI] [Google Scholar]
- Zhou P. Chao Y. Lv F. Lai J. Wang K. Guo S. Sci. Bull. 2020;65:720. doi: 10.1016/j.scib.2019.12.025. [DOI] [PubMed] [Google Scholar]
- Tommes M. Kaneko K. Neimark A. V. Olivier J. P. Rodriguez-Reinoso F. Rouquerol J. Sing K. S. W. Pure Appl. Chem. 2015;87:1051. doi: 10.1515/pac-2014-1117. [DOI] [Google Scholar]
- Fan S.-S. Shen L. Dong Y. Tian G. Wu S.-M. Chang G.-G. Janiak C. Wei P. Wu J.-S. Yang X.-Y. J. Energy Chem. 2021;57:189. doi: 10.1016/j.jechem.2020.09.020. [DOI] [Google Scholar]
- Atalla R. VanderHart D. L. Solid State Nucl. Magn. Reson. 1999;15:1. doi: 10.1016/S0926-2040(99)00042-9. [DOI] [PubMed] [Google Scholar]
- Duan P. Li X. Wang T. Chen B. Juhl S. J. Koeplinger D. Crespi V. H. Badding J. V. Schmidt-Rohr K. J. Am. Chem. Soc. 2018;140:7658. doi: 10.1021/jacs.8b03733. [DOI] [PubMed] [Google Scholar]
- Pan L. Ai M. Huang C. Yin L. Liu X. Zhang R. Wang S. Jiang Z. Zhang X. Zou J.-J. Nat. Commun. 2020;11:1. doi: 10.1038/s41467-019-13993-7. [DOI] [PMC free article] [PubMed] [Google Scholar]
- Chen Y. Tian G. Ren Z. Tian C. Pan K. Zhou W. Fu H. Eur. J. Inorg. Chem. 2011;5:754. doi: 10.1002/ejic.201000999. [DOI] [Google Scholar]
- Ai K. Liu Y. Ruan C. Lu L. Lu G. Adv. Mater. 2013;25:998. doi: 10.1002/adma.201203923. [DOI] [PubMed] [Google Scholar]
- Ferrari A. C. Robertson J. J. Phys. Rev. B. 2000;61:14095. doi: 10.1103/PhysRevB.61.14095. [DOI] [Google Scholar]
- Lu Y. Cheng X. Tian G. Zhao H. He L. Hu J. Wu S.-M. Dong Y. Chang G.-G. Lenaerts S. Siffert S. Van Tendeloo G. Li Z. F. Xu L. L. Yang X. Y. Su B.-L. Nano Energy. 2018;47:8. doi: 10.1016/j.nanoen.2018.02.021. [DOI] [Google Scholar]
- An G. Ma W. Sun Z. Liu Z. Han B. Miao S. Miao Z. Ding K. Carbon. 2007;45:1795. doi: 10.1016/j.carbon.2007.04.034. [DOI] [Google Scholar]
- Dupin J.-C. Gonbeau D. Vinatier P. Levasseur A. Phys. Chem. Chem. Phys. 2000;2:1319. doi: 10.1039/A908800H. [DOI] [Google Scholar]
- McCafferty E. Wightman J. Surf. Interface Anal. 1998;26:549. doi: 10.1002/(SICI)1096-9918(199807)26:8<549::AID-SIA396>3.0.CO;2-Q. [DOI] [Google Scholar]
- Nowotny J. Alim M. A. Bak T. Idris M. A. Ionescu M. Prince K. Sahdan M. Z. Sopian K. Teridi M. A. M. Sigmund W. Chem. Soc. Rev. 2015;44:8424. doi: 10.1039/C4CS00469H. [DOI] [PubMed] [Google Scholar]
- Nowotny M. K. Bak T. Nowotny J. J. Phys. Chem. B. 2006;110:16270. doi: 10.1021/jp0606210. [DOI] [PubMed] [Google Scholar]
- Bak T. Nowotny J. Rekas M. Sorrell C. C. J. Phys. Chem. Solids. 2003;64:1069. doi: 10.1016/S0022-3697(02)00481-X. [DOI] [Google Scholar]
- Wang S. Pan L. Song J.-J. Mi W. Zou J.-J. Wang L. Zhang X. J. Am. Chem. Soc. 2015;137:2975. doi: 10.1021/ja512047k. [DOI] [PubMed] [Google Scholar]
- Zhang Y.-X. Wu S.-M. Tian G. Zhao X.-F. Wang L.-Y. Yin Y.-X. Wu L. Li Q.-N. Zhang Y.-X. Wu J.-S. Janiak C. Ozoemena K. I. Shalom M. Yang X.-Y. Chem.–Eur. J. 21;27:14202. doi: 10.1002/chem.202101817. [DOI] [PubMed] [Google Scholar]
- Wu S.-M. Liu X. L. Lian X. L. Tian G. Janiak C. Zhang Y.-X. Lu Y. Yu H.-Z. Hu J. Wei H. Zhao H. Chang G.-G. Tendeloo G. Wang L.-Y. Yang X.-Y. Su B.-L. Adv. Mater. 2018;30:1802173. doi: 10.1002/adma.201802173. [DOI] [PubMed] [Google Scholar]
- Xiao S.-T. Wu S.-M. Dong Y. Liu J.-W. Wang L.-Y. Wu L. Zhang Y.-X. Tian G. Janiak C. Shalom M. Wang Y. T. Li Y. Z. Jia R. K. Bahnemann D. W. Yang X. Y. Chem. Eng. J. 2020;400:125909. doi: 10.1016/j.cej.2020.125909. [DOI] [Google Scholar]
- Karjule N. Singh C. Barrio J. Tzadikov J. Liberman I. Volokh M. Palomares E. Hod I. Shalom M. Adv. Funct. Mater. 2021;31:2101724. [Google Scholar]
Associated Data
This section collects any data citations, data availability statements, or supplementary materials included in this article.
Supplementary Materials
Data Availability Statement
The data that supports the findings of this study are available within the ESI† and from the corresponding author upon reasonable request.


