Fig. 1.
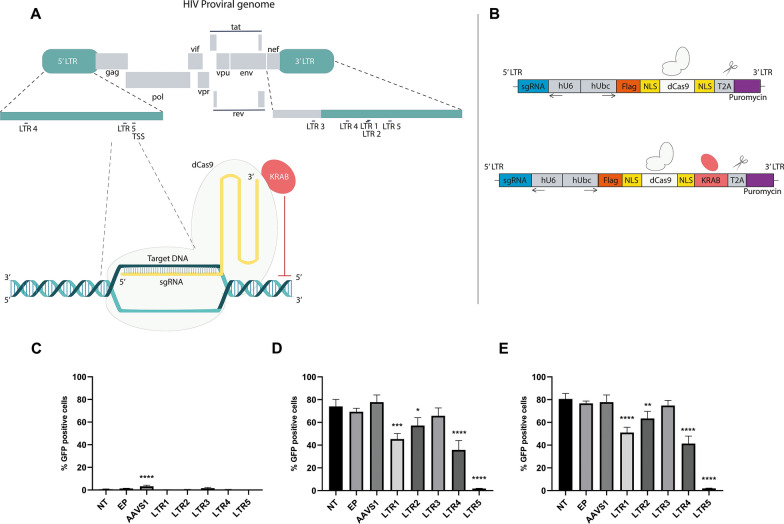
CRISPR sgRNAs constructs repress GFP expression in J.Lat 10.6 cells. A A schematic representation of HIV-1 provirus genome (HXB2) indicating the five predicted sgRNA ligation sites and a illustrative scheme of the used CRISPR system: CRISPR sgRNA, dCas9 and KRAB domain B Schematic representation of vector construct (pdSpCas9KRAB and pdSpCas9Ko/KRAB) C GFP background expression of each previous sgRNA (LTR1-LTR5) transduced untreated control J.Lat 10.6 cells. D GFP expression of each sgRNA (LTR1-LTR5) transduced J.Lat 10.6 cells treated with 1 µM PMA. E GFP expression of each sgRNA (LTR1-LTR5) transduced J.Lat 10.6 cells treated with 1 µM IngB. The statistical analysis was done using one-way ANOVA comparing mean of NT with AAVS1 and LTR1 to LTR5 (*p < 0.03; **p < 0.0053; ***p < 0.0003; ****p < 0.0001). The mean values of two technical measures of three independent biological experiments are shown

