

Research work in the life of a majority of medical students starts at the postgraduate level with the thesis work. First month into joining as a postgraduate at the medical college and “Submit your thesis plan within a week,” ordered the guide – quite a common scenario. As a student, it would take many more weeks of struggle to find out what a thesis meant. Being on the other side of the table today, we can really understand the pitiful status of residents who join in 1st year and find out that they need to do research work.
Although this whole scenario is a monstrous task, there is one very common problem encountered by almost all the students. One day you would find them running to find out the number of samples to be included in the research work. Some of them land up to the “Community Medicine” department to inquire the magic number they require to satisfy the requirements of their plan. And repeatedly over the years, our answer has been – ”I don’t have a magic wand to generate a figure. It needs to be calculated. So, sit down and answer a few of the questions.”
The process of arriving at the appropriate sample size is scientific. There are a few prerequisite questions, which need to be answered and only based on that a figure can be arrived at. At the postgraduate level, this has been an ignored concept, both by the students, their supervisors as well as the evaluators. As we all agree that the thesis is probably the first research work taken up by a majority of medical doctors (barring a few who do some at the undergraduate level); hence, the basis of taking decisions regarding sample size should be clear. Otherwise, this incompetency is going to haunt you for a lifetime.
Conducting research by calculated sample size helps to produce reliability and generalizability of the study results. Studies conducted using an insufficient sample size may produce erroneous results and lead to evidence that has no relevance in real situations. On the contrary, using excessive samples will lead to unnecessary wastage of resources, time, and efforts without any added benefits.
Thus, there is no magic number, but the estimation has to be arrived at by following the scientific basis. The authors have tried to compile the very basic concepts and formulas based on the personal review and experience over the years of reviewing the research work in the Institute.
Basic Preconcepts
As per the research guidelines, the steps in “Methodology” section of any research plan are depicted in Figure 1.
Figure 1.

Methodology of research
Hence, before a researcher proceeds to calculate desired sample size, he must be having clarity in the above steps. The prerequirements for sample determination are tabulated in Box 1.
Box 1.
Prerequisites for sample size calculation
| What is the type of study? (Determination of estimate OR hypothesis testing) |
| What is the primary outcome variable? |
| What is the estimated value of the primary outcome variable, and acceptable precision? |
| What is acceptable type I and II error? |
| What is the desired effect size? |
In order to understand the process of answering the above questions, let us go through some of the basic concepts in research and statistics.
Prerequisite 1: what is the type of study? (determination of estimate or hypothesis testing)
Action proposed
The study type has to be decided based on the design which suits best to achieve the desired aim. If the researcher just wants to describe or report some phenomenon/values in his study population, the design goes into the determination of the estimate. The sampling units in the population will be examined once. The estimate needed may be – what is the percentage of adults suffering from hypertension in the community X? or what is the prevalence of hypertension in the adults in the community X? or what is the average (mean) levels of hemoglobin (Hb) in the adolescents in the community Y?
In case the denominator on which the results are to be extrapolated is known, then it qualifies for finite population; otherwise, the infinite denominator may be used.
Hypothesis needs to be framed, both null and alternative, in the case of experimental or correlational observational or comparative studies. Whereas the null hypothesis is accepted in case of no observed difference, vice versa is true for the alternative hypothesis. This means, there are clearly two comparative data either from the same population or two or more different populations.
Prerequisite 2: what is the primary outcome variable?
Action proposed
The primary objective needs to be identified. In the above examples, they are single, i.e., prevalence of hypertension, or mean levels of Hb.
For these primary objectives, the primary outcome variable needs to be chosen – percentage of population with raised blood pressure (BP) levels, or the mean and standard deviation (SD) of Hb levels of the population.
The data type of this variable needs to be categorized as:
• Nominal – data as qualitative categories, for example, male/female, urban/rural
• Ordinal – data placed in meaningful order as categories but the difference in categories not same, for example, mild/moderate/severe, 1st/2nd/3rd, Likert-type scale data
• Interval – data placed in meaningful order as well as meaningful interval and measures quantities, however, lack absolute zero, for example, the temperature on the Celsius scale
• Ratio has absolute zero, meaningful ratios exist, for example, weight in grams, BP in mmHg, and pulse rate
• Discrete variables can take only one value, not in between, for example, days of hospital stay
• Continuous variables can take any value. Most biomedical parameters, for example, BP, age, weight, and Hb.
Prerequisite 3: what is the estimated value of the primary outcome variable, and acceptable precision?
Action proposed
Next, the estimate of these primary outcomes needs to be founded from the literature review. The nearest estimates in terms of age, sex, ethnicity, etc., should be preferred; for example, estimates can be like the prevalence of hypertension say 40%, or mean and SD of Hb levels say 10 ± 2 g/dl.
In case it is a novel study and no estimate is available even in foreign countries, a pilot study taking 10% of the estimated population size needs to be conducted. The results projected from that pilot study can be used as estimates for further calculating the desired sample size. However, in no case, the pilot samples should be included in the main study.
In case more than one primary outcome variable is there, the sample size needs to be calculated using all primary variables, and the maximum number thus calculated has to be adopted. Secondary variables need not be used to estimate sample size. Precision needs to be defined in terms of either absolute i.e. by convention taken as 5% or relative percentage of the estimated outcome, when the estimated prevalence is low.
Prerequisite 4: what is acceptable type I and II error?
Action proposed
The Level of Significance may be decided based on the study needs. By convention, a 95% confidence interval (CI) is taken as standard. It may be adjusted to increase or decrease depending on the researcher’s requirement. The decision of the level affects the acceptance or rejection of the null hypothesis. Hence, with 95% CI , we can say that there could be a 5% probability that the results observed are due to chance.
The level of precision accepted is 5%, i.e., results so obtained have a margin of ±5% variability.
Type I error (alpha) by convention is taken at 95% CI, giving z = 1.96, and Type II error (beta) by convention is taken as 20%, giving the power of 80%. This power gives us the strength to generalize our study findings to the population at large. Still, we have 20% chances that we have missed a significant difference, though it really existed.
Prerequisite 5: what is the desired effect size?
Action proposed
Desired effect size needs to be decided based on the type of study design again. It actually indicates the magnitude of the relationship between the two variables in the study. Cohen guide for effect size <0.1 is considered small, 0.3–0.5 as medium, and >0.5 is considered as moderate-to-large difference. However, effect size and sample size are inversely proportional; hence deciding on an appropriate clinically significant level again affects the calculation of sample size.
A lot of software and online calculators, both free and paid, are available these days which would calculate the sample size at a click of a button, however, which calculator needs to be used has to be decided by the researcher, again depending on the answers to the above five questions. Hence, the calculator would be asking you to fill some values, based on which it would give you the answer and the formula used, which can be further quoted in the justification of the calculation.
Sample Size Calculations
Let us now delineate the step-wise formulas to calculate sample sizes manually.[1,2,3,4,5,6,7,8,9,10,11,12,13] This would give you a better understanding of checking whether the online calculator is providing you the right numbers. The sample size estimation for cross-sectional or descriptive studies, case–control studies, cohort studies, and comparative studies is given in Tables 1-5, respectively.
Table 1.
Sample size estimation for Cross-sectional or descriptive studies
| Population | Primary objective | Data type | Desired sample size | Explanation |
|---|---|---|---|---|
| Infinite | Calculating proportion/prevalence | Nominal/ Ordinal |

|
z1-α/2=Critical value and a standard value for the corresponding level of confidence. (At 95% CI or 5% level of significance (type-I error) it is 1.96 and at 99% CI it is 2.58) p=Expected prevalence or based on previous researc q=1-p d=Margin of error or precision (Commonly taken as 5%) of the expected prevalence |
| Infinite | Calculating a mean value | Interval/ Ratio |

|
z1-α/2=Standardized value for the corresponding level of confidence. (At 95% CI, it is 1.96 and at 99% CI or 1% type I error it is 2.58) d=Margin of error or rate of precision of the expected SD σ=SD which is based on previous study or pilot study |
| Finite |

|
N=Total population d=Margin of error or precision |
CI=Confidence interval, SD=Standard deviation
Table 5.
Constant values
| C | z1-α/2 (0.05) | z1-α/2 (0.01) |
|---|---|---|
| z1-β(0.8) | 7.85 | 11.68 |
| z1-β(0.9) | 10.51 | 14.88 |
C: Constant value
Table 2.
Sample size estimation for Case-control studies
| Parameter of study | Data type | Desired number of samples per group | Explanation |
|---|---|---|---|
| Proportion | Nominal/ordinal data |
|
r=Control to cases ratio (1 if same numbers of subject in both groups) p=Proportion of population=(P1+P2)/2 Z1-β=It is the desired power (0.84 for 80% power and 1.28 for 90% power) z1-α/2=Critical value and a standard value for the corresponding level of confidence. (At 95% CI or 5% type I error it is 1.96 and at 99% CI or 1% type I error it is 2.58) P1=Proportion in cases P2=Proportion in controls |
| Mean | Interval/ratio |

|
r=Control to cases ratio Z1-β=It is the desired power (0.84 for 80% power and 1.28 for 90% power) z1-α/2=Critical value and a standard value for the corresponding level of confidence. (At 95% CI it is 1.96 and at 99% CI or 1% type I error it is 2.58) σ=SD which is based on a previous study or pilot study d=Effect size (difference in the means from previous studies or pilot study) |
CI=Confidence interval, SD=Standard deviation
Table 3.
Sample size estimation for Cohort studies
| Desired number of samples per group | Explanation |
|---|---|

|
m=Number of subjects (control) per experimental subject Z1-β=It is the desired power (0.84 for 80% power and 1.28 for 90% power) z1-α/2=Critical value and a standard value for the corresponding level of confidence. (At 95% CI it is 1.96 and at 99% CI or 1% type I error it is 2.58) p0=Possibility of event in controls p1=Possibility of event in experimental p=p1+m p0/m+1 |
CI=Confidence interval
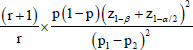
Table 4.
Sample size estimation for Comparative studies
| Parameter of study | Data type | Sample size for one group that we need to find out | Explanation |
|---|---|---|---|
| Proportion | Nominal/ordinal |

|
p1 and p2=Proportion in two groups C=Standard value for the corresponding level of α and β selected for the study. It is given in table 5 |
| Mean | Interval/ratio |

|
d=difference in means of two group (effect size) σ1=SD of Group 1 σ2=SD of Group 2 Z1-β=It is the desired power z1-α/2=Critical value and a standard value for the corresponding level of confidence. (At 95% CI it is 1.96 and at 99% CI, or 1% type I error it is 2.58) |
| Mean | Continuous variable | 1+2C (SD/d)2 | d=Detected difference in means of two group (effect size) σ=Common SD C=Constant value depends on the value of α andβselected for the study. It is given in below Table 5 |
SD=Standard deviation, CI=Confidence interval
Few of the constant values used in these formulas are given in Table 5. Many of the thesis research taken up is also related to diagnostic test evaluation. Here, the estimation of sensitivity and specificity is the study outcome. The manual calculation of these parameters is a little elaborate and complex to be taken up in this article; however, an online link for the calculation of sample size has been provided below.
Quick Finger Resources
Some of the sample calculator software and Internet links are provided for easy use by beginners [Box 2].[14,15,16,17,18,19,20] The only word of caution in using these is that the machine will calculate what you feed into it. Hence, the commands fed should be correct to get the right answers.
Box 2.
Electronic resources
| Software name | Link | Paid/free |
|---|---|---|
| Epi info | www.openepi.com | Free |
| IBM SPSS | https://www.ibm.com/in-en/analytics/spss-statistics-software | Paid |
| Raosoft software | http://www.raosoft.com/samplesize.html | Free |
| P value: A statistical tool app | https://play.google.com/store/apps/details?id=com.drkusumgaur.pvalue | Free on the play store for Android |
| Sample size calculators for designing clinical research | https://sample-size.net/ | Free |
| Statulator – online statistical calculator | https://statulator.com/ | Free |
| Sample size calculator by Wan Nor Arifin for diagnostic tests | http://wnarifin.github.io | Free |
We have tried to simplify the calculation of sample size for beginner researchers as well as early faculty researchers. Going step by step will enable the researcher to reach the scientifically appropriate sample size and quote it for the justification of achieved sample numbers. Conducting the study using a scientifically valid sample size will strengthen the results of the research work.
Financial support and sponsorship
Nil.
Conflicts of interest
There are no conflicts of interest.
References
- 1.Charan J, Biswas T. How to calculate sample size for different study designs in medical research? Indian J Psychol Med. 2013;35:121–6. doi: 10.4103/0253-7176.116232. [DOI] [PMC free article] [PubMed] [Google Scholar]
- 2.Charan J, Kantharia ND. How to calculate sample size in animal studies? J Pharmacol Pharmacother. 2013;4:303–6. doi: 10.4103/0976-500X.119726. [DOI] [PMC free article] [PubMed] [Google Scholar]
- 3.Naduvilath TJ, John RK, Dandona L. Sample size for ophthalmology studies. Indian J Ophthalmol. 2000;48:245–50. [PubMed] [Google Scholar]
- 4.Patra P. Sample size in clinical research, the number we need. Int J Med Sci Public Health. 2012;1:5–9. [Google Scholar]
- 5.Malterud K, Siersma VD, Guassora AD. Sample size in qualitative interview studies:Guided by information power. Qual Health Res. 2016;26:1753–60. doi: 10.1177/1049732315617444. [DOI] [PubMed] [Google Scholar]
- 6.Kirby A, Gebski V, Keech AC. Determining the sample size in a clinical trial. Med J Aust. 2002;177:256–7. doi: 10.5694/j.1326-5377.2002.tb04759.x. [DOI] [PubMed] [Google Scholar]
- 7.Noordzij M, Tripepi G, Dekker FW, Zoccali C, Tanck MW, Jager KJ. Sample size calculations:Basic principles and common pitfalls. Nephrol Dial Transplant. 2010;25:1388–93. doi: 10.1093/ndt/gfp732. [DOI] [PubMed] [Google Scholar]
- 8.Dell RB, Holleran S, Ramakrishnan R. Sample size determination. ILAR J. 2002;43:207–13. doi: 10.1093/ilar.43.4.207. [DOI] [PMC free article] [PubMed] [Google Scholar]
- 9.Zhong B. How to calculate sample size in randomized controlled trial? J Thorac Dis. 2009;1:51–4. [PMC free article] [PubMed] [Google Scholar]
- 10.Bujang MA, Adnan TH. Requirements for minimum sample size for sensitivity and specificity analysis. J Clin Diagn Res. 2016;10:YE01–6. doi: 10.7860/JCDR/2016/18129.8744. [DOI] [PMC free article] [PubMed] [Google Scholar]
- 11.Mishra P, Pandey MP, Singh U, Sharma V, Yadav SS, Kar R. Sample size estimation for clinical research studies using mean and proportion. Int J Sci Res. 2017;6:587–79. [Google Scholar]
- 12.Sakpal TV. Sample size estimation in clinical trial. Perspect Clin Res. 2010;1:67–9. [PMC free article] [PubMed] [Google Scholar]
- 13.Sharma SK, Mudgal SK, Thakur K, Gaur R. How to calculate sample size for observational and experimental nursing research studies? Natl J Physiol Pharm Pharmacol. 2020;10:1–8. [Google Scholar]
- 14.Epi Info. [Last accessed on 2021 Apr 20]. Available from:http://www.openepi.com .
- 15.IBM SPSS. [Last accessed on 2021 Apr 20]. Available from:https://www.ibm.com/in-en/analytics/spss-statistics-software .
- 16.Rao Soft Software. [Last accessed on 2021 Apr 20]. Available from:http://www.raosoft.com/samplesize.html .
- 17.P Value:A Statistical Tool App. [Last accessed on 2021 Apr 20]. Available from:https://play.google.com/store/apps/details?id=com.drkusumgaur.pvalue .
- 18.Sample Size Calculators for Designing Clinical Research. [Last accessed on 2021 Apr 20]. Available from:https://sample-size.net/
- 19.Statulator. [Last accessed on 2021 Apr 20]. Available from:https://statulator.com/
- 20.Sample Size Calculator by Wan Nor Arifin for Diagnostic Tests. [Last accessed on 2021 Apr 20]. Available from:http://wnarifin.github.io .