

Abstract
Black women are exposed to multiple endocrine disrupting chemicals (EDCs), but few studies have examined profiles of exposure to EDC mixtures. We identified biomarker profiles and correlates of exposure to EDC mixtures in a cross-sectional analysis of data from a prospective cohort study of 749 Black women aged 23-35 years. We quantified plasma concentrations of polychlorinated biphenyls (PCBs), polybrominated diphenyl ethers (PBDEs), organochlorine pesticides (OCPs) and per- and polyfluoroalkyl substances (PFAS) in non-fasting samples collected at baseline. Demographic, behavioral, dietary, and reproductive covariates were also collected at baseline. We used k-means clustering and principal components analysis (PCA) to describe concentration profiles of EDC mixtures (17 PCBs, 6 PBDEs, 4 OCPs, 6 PFAS), followed by multinomial logistic and multivariable linear regression to estimate odds ratios (ORs) of cluster membership and mean differences in PCA scores (β) with 95% confidence intervals (CIs). Older age (per 1-year increase: β =0.47, CI=0.39,0.54; OR=1.27, CI=1.20, 1.35), lower body mass index (per 1-kg/m2 increase: β=−0.14, CI=−0.17, −0.12; OR=0.91, CI=0.89, 0.94), and smoking (≥10 cigarettes/day compared with never smokers: β=1.37, CI=0.20, 2.55; OR=2.63, CI=1.07, 6.50) were associated with profiles characterized by higher concentrations of all EDCs. Other behaviors and traits, including dietary factors and years since last birth, were also associated with EDC mixtures.
Keywords: Endocrine disrupting chemicals, mixtures, Black women, polychlorinated biphenyls, polybrominated diphenyl ethers, pesticides, per- and polyfluoroalkyl substances, correlates
Graphical Abstract
INTRODUCTION
Endocrine disrupting chemicals (EDCs) are characterized by their capacity to interfere with hormonal systems.1 Some EDCs, including polychlorinated biphenyls (PCBs), polybrominated diphenyl ethers (PBDEs), organochlorine pesticides (OCPs) and per- and polyfluoroalkyl substances (PFAS), are persistent chemicals given their long half-lives,2–5 bioaccumulation,3,4,6–8 and resistance to environmental degradation.2–5 All of these chemical classes have been used for industrial or commercial purposes, but specific chemicals within each class have been banned or phased-out in the United States (U.S.).9–12 Exposure to some of these EDCs has been associated with type 2 diabetes,13 metabolic syndrome,14 cancer,15 thyroid dysfunction,16 immune dysregulation,17 and ulcerative colitis.18 For both in production and phased-out chemicals, low-level exposure remains a concern given their environmental persistence,2–5 propensity to leach from consumer products,9 and historical widespread use.
Humans are exposed to multiple persistent EDCs through several routes and media. Non-occupational exposure to PCBs and OCPs can occur through food, particularly foods that are high in fats, such as dairy, meats, and fish.19,20 Exposure to PBDEs can similarly occur through fish consumption.21 However, the main exposure pathway for PBDEs is ingestion or inhalation of contaminated indoor dust, given these chemicals were widely used as flame retardants in furniture.21 Exposure to PFAS is also ubiquitous and can occur through contaminated water, consumer products (e.g., clothing, furniture) and foods, particularly fish22,23 and foods kept in water- and oil-resistant packaging.24 Data from the National Health and Nutrition Examination Survey (NHANES) demonstrates that the majority of the U.S. population has body burdens of PCBs, PBDEs, OCPs and PFAS.25
Though studies have identified a multitude of correlates of exposure to individual PCBs, PBDEs, OCPs and PFAS,26–49 few have examined correlates of exposure to mixtures of these chemicals. One study examined correlates of exposure to persistent and non-persistent EDC mixtures using dimension reduction techniques (i.e., PCA and k-means clustering) in pregnant women.50 In this study, self-identified Black women (compared with white women) in the U.S. had lower urine, serum, and blood concentrations of chemicals that comprised two mixture profiles: the first included most phenols, some phthalates and metals, some pesticides, PCBs, and some PFAS, while the second included OCPs, phenols, and arsenic. Conversely, Black women had higher concentrations of a mixture profile that included lead, some pesticides and tobacco smoke biomarkers. The findings of this study suggest that patterns of exposure to EDC mixtures may differ by race, which we conceptualize throughout this paper as a social construct that determines patterns of privilege and disadvantage. In part, higher exposure to EDCs among Black Americans, reported in this study and elsewhere,13,51,52 likely reflects Black Americans disproportionately living closer to pollution sources13,53–55 and working in occupational settings with higher exposures.13,56 However, this study may have been limited by sample size, where only 118 of the 380 women were Black women.50
Black Americans tend to have higher body concentrations of several chemicals in the PCB, PBDE, OCP, and PFAS classes.57–62 Behavioral factors, like smoking, diet, and use of consumer products, may also contribute to exposure,63–65 and emerging evidence indicates that Black Americans may have higher exposure to certain EDCs through consumer products66,67 and food packaging.68 These behaviors, in turn, may result from racially unjust policies and ideas. For example, Black women may be exposed to higher EDCs in certain products specifically targeting Black women.66,67 Other upstream forces may also contribute to EDC exposure, such as, racially unjust environmental policies, including those that led to segregated neighborhoods with worse housing conditions and community infrastructure,13,54 shunting of Black workers to hazardous occupations,13,56 and placement of toxic sites53–55 and polluting industries13 in or in very close proximity to Black communities. Such racially unjust environmental policies may contribute to higher incidences of various adverse health outcomes in Black communities in the United States.59 Yet, Black women have been consistently underrepresented in studies examining correlates of exposure to environmental toxicants.
In the Study of Environment, Lifestyle and Fibroids (SELF),69 a prospective study of Black women, we have previously identified correlates of individual EDCs, including PCBs, PBDEs, and OCPs. All three chemical classes, measured in plasma, were positively associated with smoking, alcohol consumption, and having been breastfed in infancy, and inversely associated with body mass index (BMI).63–65 OCPs, PCBs, and PBB-153 were positively associated with age. Duration of lactation was inversely associated with OCPs and PCBs, parity inversely with OCPs, fish consumption positively associated with PCBs, education inversely with PBDEs, and dairy and egg consumption modestly, inversely with PBDEs.63–65 However, we are not aware of any study that has examined correlates of persistent EDC mixtures in a cohort of Black women.
In this study, we characterized profiles of mixtures of persistent EDC biomarkers and identified correlates of exposure among reproductive-aged Black women using a cross-sectional analysis of the SELF cohort.
METHODS
Study Population
SELF is a prospective cohort of Black women residing in the metropolitan area of Detroit, Michigan. Methods of SELF recruitment and follow-up have been described in greater detail elsewhere.69 Briefly, women (N=1,693) were recruited between 2010 and 2012 and were eligible for participation if they were aged 23-35 years had an intact uterus, self-identified as Black or African American, had no prior diagnosis of uterine leiomyomata (UL), and had no prior diagnosis of an autoimmune disease or cancer requiring regular medication use at recruitment. Pregnant women were eligible, but their enrollment was delayed until 3 months postpartum. Participants completed interviews or self-administered baseline questionnaires, including a food frequency questionnaire70 that assessed the frequency and serving sizes of normal intake of 110 foods and beverages in the last 12 months.71
The present cross-sectional analysis used a case-cohort design that was originally intended to assess associations between EDCs and UL. For this analysis, we used the available persistent EDC biomarker data to assess correlates of exposure. The sample size for this sub-study includes a random sub-cohort of women selected at baseline (n= 592) who were UL free and incident cases of UL detected during 60-months of follow up that were not part of the original sub-cohort (n= 162). Women were included in the present analysis if they were part of the case-cohort study population and had measurements for at least one EDC class at baseline (n= 749, Figure S1). The SELF protocol was approved by Institutional Review Boards at the Henry Ford Health System, National Institute of Environmental Health Sciences, and Boston University. The involvement of the Centers for Disease Control and Prevention (CDC) did not constitute engagement in human subjects’ research.
Quantification of Persistent EDCs Biomarkers
Participants provided non-fasting blood samples at baseline that were processed at the Henry Ford Health System (HFHS) to separate plasma by centrifuging at 1,300g and 4˚C for 10 minutes. Following short-term storage at HFHS at −80°C, samples were shipped on dry ice to the National Institute for Environmental Health Sciences (NIEHS) repository where they were aliquoted for long-term storage. Plasma used to quantify PBDE, PCB, and OCP concentrations was stored in polypropylene cryovials (Fisher Scientific) at −80°C at the NIEHS. In 2017-2018, plasma was shipped on dry ice in three batches to the CDC for quantification of 23 PCBs, 12 PBDEs/PBBs, and 9 OCPs using high-resolution gas chromatography/isotope dilution high-resolution mass spectrometry.72 Plasma used to quantify PFAS was stored in straws (Cryo Bio System) at −80°C at the NIEHS repository. In 2019, the plasma from straws was transferred to polypropylene cryovials and shipped on dry ice to the CDC in two batches for the quantification of 8 PFAS using online solid phase extraction-liquid chromatography-tandem mass spectrometry. Full methodology and quality assurance/quality control protocols for the quantification of these chemical classes have been described previously.63–65,73,74 A full list of all chemical biomarkers that were measured is provided in the Supporting Information.
Lipid plasma concentrations were measured using an enzymatic method75 and lipid-adjusted concentrations for PCBs, PBDEs, and OCPs were used for all analyses. PFAS plasma concentrations were not lipid-adjusted because PFAS are not considered lipophilic chemicals. The limits of detection (LODs) varied for PCB congeners (range: 0.11-5.40 ng/g lipid), PBDE congeners (0.2-1.1 ng/g lipid), and OCPs (1.1-1.4 ng/g lipid) (Table S1). The LODs for all PFAS, calculated as three times the standard deviation at zero concentrations,76 was 0.1 ng/mL.
Measurement of Covariates
We selected potential correlates of EDC biomarkers based on a priori knowledge from the literature. Information on correlates was measured through interviews or self-administered questionnaires at baseline. Socioeconomic and demographic variables included age (years, continuous), education (≤high school diploma or GED, some college/Associate’s degree/technical degree, or ≥Bachelor’s degree), annual household income (<$20,000, $20,000-$50,000, or >$50,000), employment (unemployed, employed <30 hours/week, or employed ≥30 hours/week), marital status (never married, previously married, or currently married) and born in the U.S. (yes or no). Behavioral variables included smoking status (never, former, current <10 cigarettes/day, or current ≥10 cigarettes/day) and alcohol consumption (low [less than 10 drinks in last year], moderate [more than low, but not heavy], or heavy [≥6 drinks on a day when drinking alcohol or ≥4 drinks at a single sitting twice per month or more]). Dietary variables ascertained via the semi-quantitative Block food frequency questionnaire included daily ounce intake of beef, pork or lamb (continuous), poultry (continuous), eggs (continuous), fish high in omega-3 (continuous), fish low in omega-3 (continuous), as well as daily servings of fruit (continuous), vegetables (continuous), and dairy (milk equivalent servings, continuous). Body mass index (BMI) was calculated from clinic-measured height and weight at baseline (continuous in kg/m2). Reproductive variables included age at menarche (≤10, 11, 12, 13, ≥14 years), parity (continuous), ever use oral contraceptives (yes or no), ever use progestin-only injectable (yes or no), current hormonal contraceptive use (yes or no), total months of breastfeeding (continuous), breastfed as an infant (never, <3 months, ≥3 months), years since last birth (nulliparous, <2 years, 2-4 years, 5-9 years and ≥10 years), and first born child to mother (yes or no). We included first born child to mother as a potential correlate of exposure because increasing parity has been previously associated with decreased concentrations of persistent chemicals among mothers.37,77,78 This indicates that first born children may be more highly exposed to these chemicals through placental transfer and/or breastfeeding.
Statistical Analyses
All analyses were performed in R version 3.6.1. EDC biomarkers with detection frequencies less than 65% were excluded from analyses. EDC biomarker concentrations below the LOD were imputed as the LOD divided by the .79 We natural log-transformed concentrations of all EDCs and converted to standardized z-scores to account for differing units between chemical classes.
We first assessed correlations between all biomarkers using Spearman pairwise correlation coefficients and compared arithmetic means of all chemical classes to pooled serum samples representative of non-Hispanic Black women aged 20-39 years from 2009-2010 NHANES for PCBs, PBDEs, OCPs.25 NHANES did not calculate pooled means for PFAS by age and race categories because individual (and not pooled) samples were analyzed. We downloaded the 2009-2010 NHANES data and calculated PFAS geometric means and standard deviations for individual samples. We also report means for non-Hispanic White women aged 20-39 from NHANES for all four persistent classes.
We used two dimension-reduction techniques to identify concentration patterns of EDC exposure biomarkers mixtures: k-means clustering and principal component analysis (PCA). K-means clustering analysis sorts women into clusters such that women within clusters are more similar based on their chemical biomarker concentrations. Specifically, k-means clustering calculates cluster centroids using Euclidian geometry, and observations are assigned to a cluster to minimize summed distances between observations and centroids.50,80 As few studies have examined correlates of mixtures using this method, we chose to evaluate the validity of using 2, 3, 4 and 5 clusters within our dataset. We a priori chose five as the maximum number of clusters to provide a range of possible clusters while keeping a reasonable sample size within each cluster. We used 23 selection indices previously described in the literature81 that identify the optimal number of clusters for the dataset by finding the number of clusters that minimize within-cluster variation.50,81,82 We performed sensitivity analyses with all other cluster numbers that were not identified by the indices to be the optimal number of clusters.
Next, we used PCA, which linearly transforms the original data into new variables (i.e., principal components, PCs) that are uncorrelated and statistically independent. Each PC explains a percentage of variance in the data, with the first PC explaining the most variance. PCA output includes loadings that describe the correlation between the unit-scaled PCs and chemical concentrations (i.e., how much each chemical contributes to a particular PC), and PC scores relate each observation with the PCs (i.e., describe the position of the observation in the new PC coordinate system). Scores for each PC for an observation are calculated by multiplying the loading value of each chemical with the original chemical concentration for the observation and summing across all chemicals for that PC.83 PC scores can then be used to represent profiles of chemical mixtures that can be analyzed with potential correlates of exposure in linear regression models. We a priori chose to select the number of PCs that explained ~75% of the total variance in the data and conducted sensitivity analyses with similar numbers of PCs that explained differing amounts of variance in the data.
We fit multinomial logistic regression models using k-means cluster membership as the dependent variable and correlates as independent variables. We estimated the association between each correlate with cluster membership using odds ratios (ORs). Similarly, we fit multivariable linear regression models using scores for each PC as the dependent variable and correlates as the independent variables. We estimated mean differences (β) in PC scores from linear models. Odds ratios and beta coefficients for each correlate were adjusted for all other correlates, an approach we have used in prior SELF correlates papers.63–65 Years since last pregnancy was assessed in a separate model that excluded parity and total breastfeeding duration due to high collinearity.
We performed four sensitivity analyses to assess potential biases in this analysis. First, we restricted the study sample to women who were randomly selected into the sub-cohort at baseline (N= 592) to assess the potential for selection bias by including UL cases that were not randomly selected. Next, we restricted our sample size to women that had measurements for all EDC classes (N= 590) to ensure that imputing missing chemical biomarker data did not induce bias in the main analyses. Because both PCA and k-means clustering are sensitive to outlier values,84,85 we performed a further sensitivity analysis using Rosner’s generalized extreme Studentized deviate test86 to determine if outlier biomarker concentrations affected overall correlate associations. Lastly, we re-ran our regression models with a reduced number of correlates, as we have done previously in SELF,87 to ensure our main findings were not biased by conditioning on mediators or colliders. We selected correlates for these models based on previously identified correlates of exposure in the SELF cohort.63–65
We imputed missing data for chemical biomarker concentrations and covariates using the Markov chain Monte Carlo method88 using all available chemical and covariate data. We generated 15 datasets and averaged imputed values. There was very little missing correlate data. We calculated the arithmetic mean of imputed values for all chemical concentrations and medians for categorical correlates, as has been done previously for PCA and k-means clustering with imputed data.50 We used average values in all subsequent analyses.
RESULTS
The mean age of participants was 29 years (range: 23-35), and the mean BMI was 34 kg/m2 (SD: 10 kg/m2). Nearly half (46%) of women had an annual household income of less than $20,000 and 57% of women had never been married. Thirty-nine percent of women were not employed at baseline and 28% had a Bachelor’s degree or higher. The majority (73%) of women reported being never smokers, and 29% reported no alcohol intake. Forty-two percent of women were the first child of their mother, most (71%) were not breastfed as infants, and 38% of women were nulliparous, with an average time spent breastfeeding their children of 3 months (SD: 6 months) (Table S2).
Detection frequencies for PCBs ranged from 18.8% to 99.5%, PBDEs ranged from 9.0% to 87.3%, OCPs from 2.4% to 97.3%, and PFAS from 13.4% to 99.6% (Table S1). Baseline concentrations of several PCBs, PBDEs, OCPs and PFAS in the SELF cohort were comparable to concentrations among Black women aged 20-39 years in 2009-2010 NHANES, though concentration of biomarkers in SELF tended to be lower than in NHANES. Concentrations of persistent EDCs in NHANES tended to be higher among Black women compared with White women, though PFAS concentrations were more comparable (Table 1).
Table 1.
Percent detection and distribution of plasma concentrations of PCBs, PBDEs, OCPs and PFAS at baseline in 749 SELF participants (2010-2012) included in this analysis and NHANES serum samples for non-Hispanic Black and non-Hispanic White females aged 20-39 years from the 2009-2010 survey year.25
| SELF participants | NHANES non-Hispanic Black femalesa | NHANES non-Hispanic White femalesa | ||||
|---|---|---|---|---|---|---|
|
| ||||||
| Percent detected (%), all participants (N= 749) | Arithmetic Mean Concentration (SD) | Median Concentration (Range) | 90th Percentile | Mean 2009-2010 (SE) | Mean 2009-2010 (SE) | |
| PBDEs, ng/g d | ||||||
| PBDE 17 | 12.6 | NCb | NCb | NCb | NCb | NCb |
| PBDE 28 | 92.7 | 1.14 (1.27) | 0.82 (0.10 – 15.21) | 2.04 | 1.37 (0.08) | 0.81 (0.08) |
| PBDE 47 | 97.3 | 26.50 (35.70) | 16.50 (0.51 – 348.21) | 51.60 | 36.3 (2.3) | 15.2 (1.6) |
| PBDE 66 | 9.0 | NCb | NCb | NCb | NCb | NCb |
| PBDE 99 | 96.3 | 5.69 (9.97) | 3.01 (0.16 – 109.60) | 11.40 | 8.51 (0.96) | 2.74 (0.48) |
| PBDE 100 | 97.2 | 5.42 (6.80) | 3.25 (0.11 – 58.75) | 11.10 | 7.49 (0.98) | 3.52 (0.44) |
| PBDE 153 | 97.3 | 7.86 (11.80) | 4.44 (0.64 – 155.70) | 16.00 | 10.1 (2.8) | 13.2 (3.0) |
| PBDE 209 | 71.7 | 2.61 (7.50) | 1.63 (0.54 – 169.70) | 3.84 | 2.22 (0.18) | 2.27 (0.48) |
| PCBs, ng/g d | ||||||
| PCB 28 | 80.8 | 0.98 (0.92) | 0.79 (0.17 – 13.53) | 1.57 | NCb | NCb |
| PCB 66 | 78.4 | 0.53 (0.45) | 0.42 (0.13 – 7.00) | 0.91 | NCb | NCb |
| PCB 74 | 97.1 | 1.69 (1.00) | 1.47 (0.41 – 11.52) | 2.68 | 1.69 (0.22) | 1.97 (0.1) |
| PCB 99 | 96.9 | 2.06 (1.67) | 1.68 (0.32 – 23.49) | 3.47 | 2.07 (0.28) | 1.83 (0.11) |
| PCB 105 | 92.7 | 0.93 (1.12) | 0.69 (0.13 – 22.02) | 1.62 | 0.69 (0.11) | 0.65 (0.05) |
| PCB 114 | 20.7 | NCb | NCb | NCb | NCb | NCb |
| PCB 118 | 99.5 | 3.53 (3.41) | 2.76 (0.73 – 56.59) | 5.88 | 2.94 (0.45) | 2.97 (0.18) |
| PCB 138/158 | 99.3 | 5.43 (4.02) | 4.30 (0.71 – 51.68) | 9.99 | 6.56 (0.92) | 6.31 (0.4) |
| PCB 146 | 92.7 | 0.94 (0.74) | 0.73 (0.11 – 6.09) | 1.81 | 1.23 (0.24) | 0.94 (0.06) |
| PCB 153 | 99.2 | 7.15 (4.92) | 5.78 (1.06 – 39.80) | 13.30 | 8.93 (1.48) | 8.59 (0.56) |
| PCB 156 | 89.7 | 0.77 (0.60) | 0.60 (0.12 – 7.27) | 1.40 | 0.96 (0.16) | 1.16 (0.08) |
| PCB 157 | 24.2 | NCb | NCb | NCb | NCb | NCb |
| PCB 167 | 44.1 | NCb | NCb | NCb | NCb | NCb |
| PCB 170 | 93.5 | 1.51 (1.13) | 1.17 (0.17 – 8.71) | 2.90 | 2.08 (0.43) | 2.02 (0.13) |
| PCB 178 | 54.6 | NCb | NCb | NCb | NCb | NCb |
| PCB 180 | 96.3 | 3.84 (3.01) | 2.87 (0.47 – 24.32) | 7.38 | 4.76 (0.81) | 5.24 (0.34) |
| PCB 183 | 85.3 | 0.66 (0.53) | 0.52 (0.11 – 4.79) | 1.26 | 1.08 (0.17) | 0.72 (0.05) |
| PCB 187 | 93.1 | 1.75 (1.50) | 1.33 (0.17 – 12.76) | 3.30 | 2.41 (0.51) | 1.91 (0.13) |
| PCB 194 | 82.5 | 0.71 (0.55) | 0.56 (0.12 – 4.46) | 1.37 | 1.06 (0.20) | 1.08 (0.08) |
| PCB 196/203 | 90.7 | 0.93 (0.67) | 0.76 (0.12 – 5.06) | 1.70 | 1.09 (0.20) | 1.13 (0.08) |
| PCB 199 | 81.5 | 0.86 (0.73) | 0.67 (0.12 – 5.61) | 1.62 | 1.21 (0.29) | 1.09 (0.08) |
| PCB 209 | 18.8 | NCb | NCb | NCb | NCb | NCb |
| OCPs, ng/g d | ||||||
| Hexachlorobenzene | 68.6 | 6.29 (1.87) | 5.94 (1.70 – 17.20) | 8.62 | 6.41 (0.27) | 7.57 (0.25) |
| Oxychlordane | 85.8 | 2.29 (1.04) | 2.13 (0.59 – 7.40) | 3.63 | NCb | NCb |
| p-p’-DDE | 97.3 | 57.80 (28.80) | 51.40 (12.60 – 295.90) | 92.00 | 110.0 (15.0) | 86.3 (6.3) |
| p-p’-DDT | 48.3 | NCb | NCb | NCb | 2.98 (0.56) | 2.72 (0.32) |
| o-p’-DDT | 2.4 | NCb | NCb | NCb | NCb | NCb |
| Trans-nonachlor | 88.8 | 2.81 (1.65) | 2.44 (0.62 – 16.61) | 4.50 | 6.82 (0.50) | 6.25 (0.5) |
| β-HCH | 62.1 | NCb | NCb | NCb | 2.19 (0.5) | NCb |
| γ-HCH (Lindane) | 1.1 | NCb | NCb | NCb | NCb | NCb |
| Mirex | 4.8 | NCb | NCb | NCb | NCb | NCb |
| PFAS, ng/ml e | ||||||
| PFOAc | Linear: 99.2 Branched: 13.4 |
1.22 (1.75) | 1.27 (0.14, 21.30) | 2.27 | 1.19 (1.69) | 2.44 (1.80) |
| PFOSc | Linear: 99.6 Branched: 98.9 |
3.99 (1.93) | 4.10 (0.14, 47.60) | 8.46 | 4.60 (1.73) | 6.00 (1.93) |
| PFDA | 84.1 | 0.23 (0.16) | 0.20 (0.07 – 1.90) | 0.40 | 0.24 (1.55) | 0.21 (1.86) |
| PFHxS | 97.7 | 0.80 (0.84) | 0.60 (0.07 – 9.90) | 1.50 | 0.71 (1.79) | 0.95 (2.28) |
| PFNA | 99.2 | 0.59 (0.32) | 0.52 (0.07 – 4.70) | 0.90 | 1.02 (1.35) | 0.14 (2.04) |
| PFUA | 44.1 | NCb | NCb | NCb | 0.15 (1.93) | 0.21 (1.86) |
Geometric means were calculated for PFAS for individual samples and arithmetic means were calculated for pooled PCBs, PBDEs, and OCPs, where pooled data are comparable to an arithmetic means of individual samples.
Mean not calculated due to high number of samples below the limit of detection.
Total PFOA and PFOS, including all isomers, means calculated for SELF and NHANES.
Concentrations are lipid adjusted.
Geometric standard deviations were calculated for PFAS in NHANES.
Spearman correlation coefficients between all chemicals of all classes ranged from −0.11 (between PBDE 100 and PFNA) to 0.98 (between PCB 170 and 180). Correlations were generally stronger within chemical classes than between classes; PFAS correlations ranged from 0.25 to 0.78, PCB correlations from 0.11 to 0.98, PBDE correlations from 0.08 to 0.94, and OCP correlations from 0.51 to 0.86.
Twelve of the 23 k-means clustering selection indices selected 2 clusters as the optimal number of clusters, followed by 3 clusters (7 indices), 4 clusters (3 indices) and 5 clusters (1 index). Following the majority rule, we used 2 clusters in multinomial logistic models. Women in cluster 1 (N= 391) had lower concentrations of all chemical biomarkers compared to cluster 2 (N= 358) (Figure 1, Table S3).
Figure 1.

Mean log-transformed Z-standardized plasma chemical concentrations for Cluster 1 and Cluster 2 in the k-means clustering analysis among women in this analysis from the SELF case-cohort (N= 749).a,b,c
aAll chemical biomarker concentrations were log-transformed and z-standardized, and PCBs, PBDEs and OCPs were lipid-adjusted.
bCluster 1 sample size was 391 and cluster 2 was 358 women.
cCluster 1 is the reference cluster.
After adjustment for all other covariates, we found that age at enrollment, cigarette smoking, and alcohol consumption were positively associated with membership in cluster 2, which was indicative of higher concentrations of all chemical classes. Specifically, a one-year increase in age at baseline was associated with 27% (OR=1.27, 95% CI=1.20, 1.35) increased odds of membership in cluster 2. Current smokers of ≥10 cigarettes/day compared to non-smokers (OR=2.63, 95% CI=1.07, 6.50) and women who consumed alcohol compared to non-drinkers (moderate consumption: OR=1.19, 95% CI=0.79, 1.80; heavy consumption: OR=2.23, 95% CI=1.32, 3.78) had greater odds of membership in cluster 2.
A 1-month increase in breastfeeding duration was associated with a small decrease in odds of membership in cluster 2 (OR=0.96, 95% CI=0.93, 1.00), while women who were breastfed as an infant were more likely to belong to cluster 2 compared to women who were not breastfed (<3 months: OR=1.70, 95% CI=1.03, 2.80; ≥3 months: OR=1.88, 95% CI=1.15, 3.09). Similarly, having given birth <2 years prior to study enrollment was inversely associated with odds of belonging to cluster 2 (OR=0.72, 95% CI=0.44, 1.20) compared with nulliparous women. BMI was inversely associated with cluster 2 membership (per kg/m2 increase, OR=0.91, 95% CI=0.89, 0.94), while a daily ounce increase in poultry consumption (OR=1.18, 95% CI=1.01, 1.39) was positively associated with belonging to cluster 2. Other predictors, including employment, income, and education, were modestly associated with cluster 2 membership (Table 2).
Table 2.
Adjusted odds of cluster 2 membership for women based on socioeconomic, demographic, behavioral, dietary, and reproductive correlates for women included in this analysis from SELF (N= 749).a,b
| Variable | Odds Ratio (95% CI) |
|---|---|
| Age at enrollment, 1-year increase | 1.27 (1.20, 1.35) |
| Marital status | |
| Never married | Ref |
| Currently married | 0.92 (0.59, 1.43) |
| Previously married | 0.90 (0.54, 1.51) |
| Education | |
| HS degree/GED | Ref |
| Some college/Associate’s/Technical school | 0.64 (0.38, 1.05) |
| Bachelor’s/Master’s/PhD | 0.61 (0.32, 1.17) |
| Income | |
| <$20,000/year | Ref |
| $20-50,000/year | 1.33 (0.86, 2.06) |
| >$50,000/year | 1.68 (0.92, 3.04) |
| Employment | |
| Not employed | Ref |
| Employed <30 hours/week | 1.27 (0.75, 2.18) |
| Employed ≥30 hours/week | 1.25 (0.82, 1.91) |
| U.S. born | |
| No | Ref |
| Yes | 0.95 (0.15, 6.00) |
| Smoking | |
| Non-smoker | Ref |
| Former smoker | 1.12 (0.58, 2.15) |
| Current smoker <10 cigarettes/day | 1.09 (0.62, 1.94) |
| Current smoker ≥10 cigarettes/day | 2.63 (1.07, 6.50) |
| Alcohol use | |
| Non-drinker | Ref |
| Moderate consumption | 1.19 (0.79, 1.80) |
| Heavy consumption | 2.23 (1.32, 3.78) |
| BMI (kg/m2), 1-unit increase | 0.91 (0.89, 0.94) |
| Daily servings of dairy (milk equivalents) | 1.03 (0.80, 1.31) |
| Meats, ounces/day | 0.98 (0.89, 1.09) |
| Poultry, ounces/day | 1.18 (1.01, 1.39) |
| Eggs, ounces/day | 1.00 (0.69, 1.45) |
| Fish high in omegas, ounces/day | 1.12 (0.35, 3.56) |
| Fish low in omegas, ounces/day | 1.06 (0.70, 1.60) |
| Daily servings of fruits | 0.94 (0.85, 1.04) |
| Daily servings of vegetables | 0.99 (0.79, 1.22) |
| Parity | |
| Nulliparous | Ref |
| 1 | 0.78 (0.48, 1.27) |
| 2 | 1.49 (0.84, 2.65) |
| ≥3 | 1.24 (0.65, 2.37) |
| Totals months spent breastfeeding, 1-month increase | 0.96 (0.93, 1.00) |
| First child of mother | |
| No | Ref |
| Yes | 0.98 (0.69, 1.39) |
| Breastfed in infancy | |
| Never | Ref |
| <3 months | 1.70 (1.03, 2.80) |
| ≥3 months | 1.88 (1.15, 3.09) |
| Age at menarche (years) | 1.00 (0.88, 1.14) |
| Ever use oral contraceptives | |
| No | Ref |
| Yes | 0.94 (0.63, 1.38) |
| Ever use progestin-only injectable | |
| No | Ref |
| Yes | 0.96 (0.66, 1.39) |
| Hormonal contraceptive use at baseline | |
| No | Ref |
| Yes | 1.06 (0.71, 1.58) |
| Years since last birth | |
| Nulliparous | Ref |
| <2 years | 0.72 (0.44, 1.20) |
| 2-4 years | 0.94 (0.57, 1.57) |
| >=5 years | 0.98 (0.57, 1.71) |
Cluster 1 sample size was 391 and cluster 2 was 358 women.
Cluster 1 is the reference cluster.
Cluster 2 was indicative of higher concentrations of all chemicals.
Odds ratios were adjusted for all other correlates.
Associations with years since last birth were estimated from a separate model that did not include parity or total months spent breastfeeding due to high collinearity.
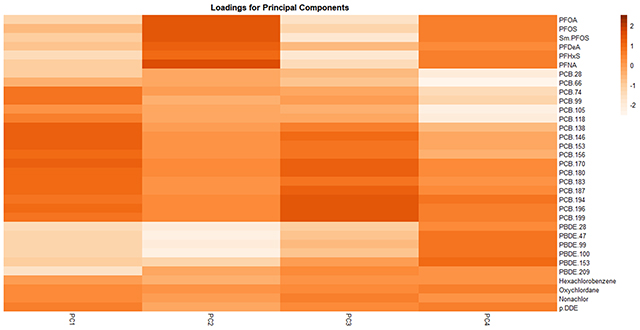
Using PCA, we found that 4 PCs explained ~75% (PC-1: 43.1%, PC-2: 13.3%, PC-3: and 11.2%, PC-4: 7.1%) of the variance in biomarker concentrations; we therefore constrained main analyses to these 4 PCs. Loadings for each PC are shown in Figure 2 (also see Table S4), where positive and negative loading values indicate positive and negative correlations of the chemical with the PC, respectively. We characterized PC-1 as indicative of exposure to all PCBs, OCPs and PFOS; PC-2 as indicative of exposure to PFAS and lower brominated (≤6 bromines) PBDEs; PC-3 as indicative of exposure to PFAS and Wolff Group 2A (dioxin-like)89 PCBs; and PC-4 as indicative of exposure to PFAS, Wolff Groups 2A and 3 (biologically persistent, CYP1A and CYP2B inducers)89 PCBs, lower brominated PBDEs, p’p-DDE and oxychlordane.
Figure 2.

Loading factors for the first four principal components among women included in this analysis from SELF (N= 749).a,b
aAll chemical concentrations were log-transformed and z-standardized, and PCBs, PBDEs and OCPs were lipid-adjusted.
bThe PCA was constrained to four principal components, which explained 75% of the variance in the data.
After adjustment for all other covariates, age at enrollment (1-year increase: β=0.47, 95% CI=0.39, 0.54), smoking (compared to nonsmokers, current smoker ≥10 cigarettes/day: β=1.37, 95% CI=0.20, 2.55), and alcohol consumption (compared to non-drinkers, moderate: β=0.42, 95% CI=−0.14, 0.98; heavy: β=1.03, 95% CI=0.32, 1.73) were associated with increased PC-1 scores, indicating higher exposure to PCBs, OCPs and PFOS. Consumption of poultry was also associated with increased PC-1 scores (increase in daily ounces, β=0.17, 95% CI=−0.04, 0.38) (Table 3).
Table 3.
Adjusted mean differences (β) in principal component scores for women based on socioeconomic, demographic, behavioral, dietary, and reproductive correlates for women included in this analysis from SELF (N= 749).a
| Variable | PC-1 β (95% CI) | PC-2 β (95% CI) | PC-3 β (95% CI) | PC-4 β (95% CI) |
|---|---|---|---|---|
| Age at enrollment, 1-year increase | 0.47 (0.39, 0.54) | 0.11 (0.06, 0.16) | 0.08 (0.04, 0.12) | 0.05 (0.01, 0.09) |
| Marital status | ||||
| Never married | Ref | Ref | Ref | Ref |
| Currently married | −0.25 (−0.85, 0.35) | 0.27 (−0.10, 0.65) | 0.001 (−0.33, 0.33) | 0.08 (−0.20, 0.36) |
| Previously married | −0.03 (−0.74, 0.68) | 0.30 (−0.14, 0.75) | 0.15 (−0.24, 0.55) | −0.15 (−0.48, 0.18) |
| Education | ||||
| HS degree/GED | Ref | Ref | Ref | Ref |
| Some college/Associate’s/Technical school | −0.69 (−1.36, −0.02) | 0.43 (0.01, 0.85) | 0.11 (−0.26, 0.48) | 0.02 (−0.29, 0.34) |
| Bachelor’s/Master’s/PhD | −0.58 (−1.48, 0.31) | 0.90 (0.34, 1.47) | −0.19 (−0.69, 0.31) | −0.28 (−0.70, 0.14) |
| Income | ||||
| <$20,000/year | Ref | Ref | Ref | Ref |
| $20-50,000/year | 0.20 (−0.40, 0.80) | 0.31 (−0.07, 0.68) | −0.17 (−0.51, 0.16) | −0.21 (−0.49, 0.07) |
| >$50,000/year | 0.62 (−0.21, 1.45) | 0.15 (−0.37, 0.67) | −0.31 (−0.77, 0.16) | −0.28 (−0.67, 0.10) |
| Employment | ||||
| Not employed | Ref | Ref | Ref | Ref |
| Employed <30 hours/week | 0.24 (−0.51, 0.99) | −0.37 (−0.84, 0.10) | −0.30 (−0.72, 0.12) | 0.21 (−0.14, 0.56) |
| Employed ≥30 hours/week | −0.01 (−0.58, 0.57) | −0.10 (−0.46, 0.26) | −0.24 (−0.57, 0.08) | 0.02 (−0.25, 0.29) |
| US born | ||||
| No | Ref | Ref | Ref | Ref |
| Yes | −0.19 (−2.59, 2.22) | 0.09 (−1.42, 1.60) | 0.27 (−1.07, 1.61) | −0.01 (−1.13, 1.11) |
| Smoking | ||||
| Non-smoker | Ref | Ref | Ref | Ref |
| Former smoker | 0.46 (−0.44, 1.37) | −0.63 (−1.20, −0.07) | 1.10 (0.60, 1.60) | 0.15 (−0.27, 0.57) |
| Current smoker <10 cigarettes/day | 0.31 (−0.46, 1.08) | −0.22 (−0.71, 0.26) | 0.43 (−0.001, 0.86) | 0.48 (0.12, 0.84) |
| Current smoker ≥10 cigarettes/day | 1.37 (0.20, 2.55) | −0.79 (−1.53, −0.05) | −0.22 (−0.88, 0.43) | 0.83 (0.29, 1.38) |
| Alcohol use | ||||
| Non-drinker | Ref | Ref | Ref | Ref |
| Moderate consumption | 0.42 (−0.14, 0.98) | 0.04 (−0.31, 0.40) | −0.41 (−0.72, −0.09) | 0.05 (−0.21, 0.31) |
| Heavy consumption | 1.03 (0.32, 1.73) | −0.21 (−0.66, 0.23) | −0.38 (−0.77, 0.01) | −0.11 (−0.44, 0.21) |
| BMI (kg/m2), 1-unit increase | −0.14 (−0.17, −0.12) | −0.01 (−0.03, 0.01) | −0.04 (−0.05, −0.02) | −0.04 (−0.05, −0.02) |
| Daily servings of dairy (milk equivalents) | −0.09 (−0.42, 0.24) | 0.03 (−0.18, 0.24) | 0.14 (−0.04, 0.33) | −0.15 (−0.30, 0.004) |
| Meats, ounces/day | −0.09 (−0.22, 0.03) | −0.01 (−0.09, 0.07) | −0.03 (−0.10, 0.05) | 0.03 (−0.03, 0.09) |
| Poultry, ounces/day | 0.17 (−0.04, 0.38) | 0.03 (−0.10, 0.16) | 0.06 (−0.06, 0.18) | 0.01 (−0.09, 0.10) |
| Eggs, ounces/day | 0.06 (−0.45, 0.57) | 0.16 (−0.16, 0.48) | 0.13 (−0.16, 0.41) | 0.07 (−0.17, 0.31) |
| Fish high in omegas, ounces/day | −0.15 (−1.74, 1.43) | −0.50 (−1.50, 0.49) | 0.43 (−0.45, 1.32) | −0.05 (−0.79, 0.68) |
| Fish low in omegas, ounces/day | 0.24 (−0.32, 0.80) | 0.17 (−0.18, 0.52) | −0.08 (−0.39, 0.23) | 0.13 (−0.13, 0.39) |
| Daily servings of fruits | −0.004 (−0.14, 0.13) | −0.01 (−0.09, 0.08) | −0.11 (−0.19, −0.04) | −0.02 (−0.08, 0.05) |
| Daily servings of vegetables | 0.02 (−0.27, 0.32) | 0.10 (−0.08, 0.29) | −0.05 (−0.21, 0.12) | 0.09 (−0.04, 0.23) |
| Parity | ||||
| Nulliparous | Ref | Ref | Ref | Ref |
| 1 | −0.21 (−0.86, 0.45) | 0.06 (−0.35, 0.47) | 0.54 (0.18, 0.91) | 0.0003 (−0.30, 0.30) |
| 2 | 0.14 (−0.64, 0.93) | −0.37 (−0.86, 0.12) | 0.46 (0.02, 0.90) | −0.31 (−0.68, 0.05) |
| ≥3 | 0.42 (−0.46, 1.30) | −0.61 (−1.16, −0.05) | 0.83 (0.34, 1.32) | −0.36 (−0.77, 0.05) |
| Totals months spent breastfeeding, 1-month increase | −0.09 (−0.14, −0.05) | −0.03 (−0.06, 0.001) | 0.03 (0.002, 0.05) | 0.01 (−0.01, 0.03) |
| First child of mother | ||||
| No | Ref | Ref | Ref | Ref |
| Yes | −0.33 (−0.80, 0.15) | −0.03 (−0.33, 0.27) | 0.04 (−0.22, 0.30) | 0.06 (−0.16, 0.28) |
| Breastfed in infancy | ||||
| Never | Ref | Ref | Ref | Ref |
| <3 months | 0.28 (−0.40, 0.96) | −0.57 (−0.99, −0.14) | −0.20 (−0.58, 0.18) | 0.18 (−0.14, 0.50) |
| ≥3 months | 1.05 (0.37, 1.73) | 0.08 (−0.35, 0.51) | 0.34 (−0.04, 0.72) | 0.47 (0.15, 0.79) |
| Age at menarche (years) | −0.04 (−0.22, 0.14) | 0.07 (−0.04, 0.19) | 0.03 (−0.07, 0.13) | 0.05 (−0.04, 0.13) |
| Ever use oral contraceptives | ||||
| No | Ref | Ref | Ref | Ref |
| Yes | −0.35 (−0.88, 0.19) | −0.28 (−0.62, 0.06) | −0.01 (−0.31, 0.29) | −0.21 (−0.46, 0.04) |
| Ever use progestin-only injectable | ||||
| No | Ref | Ref | Ref | Ref |
| Yes | −0.09 (−0.60, 0.41) | 0.10 (−0.22, 0.42) | −0.14 (−0.43, 0.14) | 0.08 (−0.16, 0.32) |
| Hormonal contraceptive use at baseline | ||||
| No | Ref | Ref | Ref | Ref |
| Yes | 0.12 (−0.42, 0.67) | −0.09 (−0.43, 0.25) | −0.40 (−0.71, −0.10) | 0.24 (−0.02, 0.49) |
| Years since last birth | ||||
| Nulliparous | Ref | Ref | Ref | Ref |
| <2 years | −0.77 (−1.47, −0.08) | −0.33 (−0.77, 0.11) | 0.94 (0.55, 1.32) | −0.18 (−0.50, 0.14) |
| 2-4 years | −0.08 (−0.79, 0.62) | −0.37 (−0.82, 0.07) | 0.52 (0.13, 0.91) | −0.13 (−0.45, 0.20) |
| ≥5 years | −0.38 (−1.14, 0.37) | −0.14 (−0.61, 0.34) | 0.60 (0.18, 1.01) | 0.07 (−0.28, 0.41) |
Principal component scores were calculated by multiplying each chemical’s z-score with the principal component loading factor and summing across all analytes.
Mean differences were adjusted for all other correlates.
Associations with years since last birth were estimated from a separate model that did not include parity or totals months spent breastfeeding due to high collinearity.
Conversely, consumption of beef, pork and lamb was modestly associated with decreased PC-1 scores (increase in daily ounces, β=−0.09, 95% CI=−0.22, 0.03), as was BMI (per kg/m2 increase, β=−0.14, 95% CI=−0.17, −0.12). Having been breastfed in infancy was associated with increased PC-1 scores (compared with women not breastfed in infancy, <3 months: β=0.28, 95% CI=−0.40, 0.96; ≥3 months: β=1.05, 95% CI=0.37, 1.73), while a 1-month increase in breastfeeding duration was associated with a modest decrease in PC-1 scores (β=−0.09, 95% CI=−0.14, −0.05). Associations were also observed with several other PCs (Table 3).
Findings from sensitivity analyses constraining to varying numbers of clusters (Figures S2–S4 and Tables S5–S7) or PCs (Table S8) were similar to main analyses. In a sensitivity analysis restricting the sample to women who had measurements for all chemical classes, we found that several odds ratios and mean differences in PC-scores differed in magnitude for some correlates. However, the directions of associations tended to remain consistent and associations for some correlates, such as age at enrollment and BMI, were similar to the main findings (Figures S5–S6, Tables S9–S10). We also found that associations for certain correlates (i.e., age, BMI, years since last birth) in the sensitivity analyses that restricted to the random sub-cohort were equivalent to the main findings (Figures S7–S8, Tables S11–S12). The outlier sensitivity analysis identified few outlier values (10 for PFOA, 5 for PFOS, 2 for PFNA, 1 for PCB 28, 1 for PCB 66, 1 for PCB 74, 3 for PCB 99, 3 for PCB 105, 3 for PCB 118, 1 for PCB 138, 1 for PBDE 153, 8 for PBDE 209, and 1 for HCB). This led to only 25 women being excluded, suggesting our findings using both statistical methods were robust to extreme chemical concentrations (Figures S9–S10, Tables S13–S14). Lastly, our main findings did not differ substantially for either PCA or k-means clustering when we reduced the models to five correlates (Tables S15 and S16).
DISCUSSION
In this cross-sectional study of reproductive-aged Black women, we assessed profiles and correlates of exposure to persistent EDC mixtures. Plasma concentrations of several chemicals in each EDC class were higher in SELF participants, as well as in Black women in NHANES, than in white women in NHANES.25 Consistently higher biomarker concentrations of EDCs in Black women may reflect higher environmental exposures from consumer products66,67 and food goods,68 as well as environmentally racist policies.13,53–55 In our study, we identified age, BMI, smoking, alcohol consumption, and having been breastfed in infancy as correlates of EDC mixtures. This is one of the first studies to examine correlates of persistent EDC mixtures, and the first to do so in a cohort of Black women.
Age was associated with all classes using both methods, but particularly with PCBs, OCPs, and PFAS, based on analyses with PC scores. These results are consistent with other studies that have reported associations of increasing PBDEs, PCBs, OCPs and PFAS concentrations with increasing age.64,26–33,38,43–49 Positive associations with age likely reflect higher historical exposures among older women, as well as the propensity for bioaccumulation of these chemicals2–4,6–8 and lipophilic nature of PCBs, PBDEs, and OCPs.2,4,5 PCBs that are more highly chlorinated tend to have higher persistence,4 which was reflected in the positive association of age with highly chlorinated PCBs.
BMI was inversely associated with plasma concentrations of all chemical classes. Similar findings were observed previously in the SELF cohort and in the literature, where lower circulating levels of PCBs, PBDEs, and OCPs have been reported among overweight and obese women compared to normal weight women.26,28,29,38,43,44,46–48,64 PCBs, particularly those with higher chlorination, PBDEs, and OCPs are lipophilic and sequester in adipose tissue.24 Therefore, greater adipose tissue increases the capacity for sequestration of PCBs, PBDEs, and OCPs. Associations of PFAS with body size are inconsistent in the literature,37,90–94 and future work should address the association of mixtures of PFAS and other persistent EDCs with body weight and adiposity.
Plasma concentrations of chemicals in all classes, specifically highly-chlorinated PCBs, PBDEs and OCPs, were positively associated with cigarette smoking. This is consistent with prior studies in the SELF cohort63–65 and in other study populations.28–30,38,44,46,48,49 Pesticides, including OCPs, have been detected in tobacco smoke and leaves,95,96 indicating smoking may be a pertinent exposure pathway for OCPs. Furthermore, nicotine and organochlorine chemicals, including OCPs and PCBs, are metabolized by the cytochrome P450 oxidase system.4,97,98 Competition for metabolism between nicotine and organochlorines may limit breakdown of these compounds in smokers, and could further explain the association of smoking with PCBs and OCPs.
Poultry intake was associated with increased concentrations of all chemicals using both statistical approaches. Prior studies found positive associations of poultry intake and certain PFAS and PBDEs99–101 in women, while others have found null or inverse associations for PCBs and OCPs.32,36,38,43 While there is likely misclassification of our self-reported dietary covariates,102 several of these chemical classes have been detected in poultry meat, fat or eggs.103–107 Dairy intake and fish high in omega acids were further associated with PCBs, based on PC scores. Fatty fish intake is a known route of exposure to PCBs,29,30,38,43,44,46,48,49 and our findings suggest that PCB exposure may be higher with consumption of fish that contain higher levels of omega-3 fatty acids.
Having been breastfed in infancy was associated with higher exposure to concentrations of all chemical classes based on both methods, especially PCBs and OCPs. This is consistent with prior studies26,44,46 and suggests that having been breastfed in infancy is an exposure route for these chemical classes. We also found that having given birth was negatively associated with concentrations of all persistent EDCs, particularly among women who had given birth recently (<2 years ago). This protective association decreased as the years since last birth increased, which suggests that birth may be a route of elimination of persistent EDCs, but that these persistent chemicals can again accumulate postpartum. Similarly, duration of lactation was inversely associated with plasma concentrations of all classes, particularly PBDEs, suggesting breastfeeding may be an important pathway of elimination for persistent EDCs. Current use of hormonal birth control at baseline was also associated with PFAS, lower chlorinated PCBs, and lower brominated PBDEs. Similar associations for hormonal birth control and PFAS were observed in the SELF cohort (data unpublished) and elsewhere.108 Associations of hormonal contraceptives with increased PFAS concentrations likely results from altered menstruation,109 which is a route of elimination for PFAS.110
We used two dimension-reduction methods to characterize profiles of persistent EDC exposure. Each method has strengths and limitations. PCA can be used to identify profiles of mixtures, which are mathematically independent from each other. However, the interpretation of the PCs and resulting regression coefficients is challenging.111 Conversely, k-means clustering is readily interpretable as profiles of cumulative chemical concentrations, but may be limited by decreasing sample sizes with increasing numbers of clusters.84 Both PCA and k-means clustering are subjective methods as the researcher selects the number of PCs and clusters. A priori decisions for the number of PCs and clusters are made with the guidance of the literature, subject knowledge, and selection criteria, but the choice of PC and cluster numbers can still be arbitrary. However, we assessed the robustness of findings from both methods using sensitivity analyses with alternate numbers of PCs and clusters and found similar results (see Supporting Information). Both methods also identified similar correlates of exposure to persistent EDCs, suggesting the results in this study are not highly sensitive to the choice of statistical method. Our results were also robust to outlier values.
Our study had additional limitations. Selection bias may have been introduced with the addition of UL cases at follow-up that were not a part of the randomly selected sub-cohort. In the sensitivity analysis, magnitudes of associations differed for several correlates for PCA and k-means clustering, indicating our main findings may be biased, where the direction of the bias differed by correlate. However, the change in magnitude of associations for key findings (i.e., age, BMI, alcohol consumption) tended to be small, and directions of associations were the same as main findings. The models in our study were also predictive and adjusted for all other correlates; therefore, we may have adjusted for mediators or colliders, which could have introduced bias in our findings. However, estimated odds ratios and PCA differences (betas) did not differ substantially in reduced models (Tables S15 and S16), suggesting our main findings were not biased significantly by conditioning on colliders or mediators. Further, the imputed datasets were averaged as we were not aware of any statistical method to combine results across PCA and k-means clustering analyses. This averaging approach may result in underestimated standard errors, but has been used previously in the mixtures literature. Our analysis was also cross-sectional, though our results may still reflect past exposure given the persistence of these EDC classes. There may also be misclassification of correlates, particularly for self-reported early life correlates (i.e., having been breastfed in infancy); however, early life correlates were reported with the assistance of participants’ mothers, and any misclassification would likely be non-differential and thus bias results towards the null. Finally, the generalizability of these results may be restricted by the age range of SELF (23-35 years old) and use of dimension reduction methods, where the profiles of exposure may be unique to the SELF cohort.111
A main strength of this study was the focus on U.S. Black women, who have been underrepresented in environmental health studies. This study adds to the literature, and expands on our prior work in SELF, by identifying correlates of mixtures of persistent EDCs in reproductive-aged Black women. This study also employed two statistical approaches to create concentration profiles, which allowed us to compare results from each method and the robustness of our findings. We also collected data on a multitude of demographic, dietary, behavioral, and reproductive factors, allowing us to examine associations with several potential correlates and control for various potential confounders.
In addition to chemical bans, findings from our study highlight several modifiable behavioral factors that can be targeted by public health interventions, including smoking and alcohol consumption, both of which were strongly and positively associated with all persistent EDCs. While we did not directly measure the impact of racism on chemical concentrations in this study, there is a growing literature demonstrating that racist policies and ideas have led to increased exposure to EDCs among Black women in consumer products,66,67 in food items,68 and environmentally unjust policies (i.e., through housing and zoning policies).13 Therefore, public health actions should include remediation and removal of persistent EDCs from consumer products, indoor environments, and the environment at large for communities of color.112
Supplementary Material
Table S1: Median limits of detection for PCBs, PBDEs, and OCPs. Table S2: Study characteristics of women included in this analysis from the SELF cohort. Table S3: Geometric means and ranges of concentrations of persistent EDCs by cluster for the k-means clustering analysis when constrained to 2 clusters. Table S4: Adjusted odds of cluster membership for the k-means clustering sensitivity analysis with 3 clusters. Table S5: Adjusted odds of cluster membership for the k-means clustering sensitivity analysis with 4 clusters. Table S6: Adjusted odds of cluster membership for the k-means clustering sensitivity analysis with 5 clusters. Table S7: Loading factors explaining biomarker concentrations of persistent EDCs for the first 5 PCs. Table S8: Adjusted mean differences in PC scores for the PCA sensitivity analysis constrained to 2, 3, and 5 PCs. Table S9: K-means clustering sensitivity analysis (2 clusters) restricting to women with measurements on all persistent EDC classes (n= 590). Table S10: PCA sensitivity analysis (4 PCs) restricting to women with measurements on all persistent EDC classes (n= 590). Table S11: K-means clustering sensitivity analysis (2 clusters) restricting to women who were randomly selected into the sub-cohort at baseline (n= 592). Table S12: PCA sensitivity analysis (4 PCs) restricting to women who were randomly selected into the sub-cohort at baseline (n= 592). Table S13: K-means clustering sensitivity analysis (2 clusters) after removing outlier values (n= 724). Table S14: PCA sensitivity analysis (4 PCs) after removing outlier values (n= 724). Table S15: PCA sensitivity analysis for reduced models. Table S16: K-means clustering sensitivity analysis for reduced models. Figure S1: Case-cohort study design of SELF. Figure S2: Mean log-transformed Z-standardized concentrations of persistent EDCs by cluster when constraining the k-means analysis to 3 clusters. Figure S3: mean log-transformed Z-standardized concentrations of persistent EDCs by cluster when constraining the k-means analysis to 4 clusters. Figure S4: mean log-transformed Z-standardized concentrations of persistent EDCs by cluster when constraining the k-means analysis to 5 clusters. Figure S5: Mean log-transformed Z-standardized concentrations of persistent EDCs (2 clusters) for the sensitivity analysis restricting to women with measurements for all chemical classes (N= 590). Figure S6: Loading factors explaining biomarker concentrations of persistent EDCs (4 PCs) for the sensitivity analysis restricting to women with measurements for all chemical classes (N= 590). Figure S7: Mean log-transformed Z-standardized concentrations of persistent EDCs (2 clusters) for the sensitivity analysis restricting to women who were randomly selected into the sub-cohort at baseline (N= 590). Figure S8: Loading factors explaining biomarker concentrations of persistent EDCs (4 PCs) for the sensitivity analysis restricting to women who were randomly selected into the sub-cohort at baseline (N= 590). Figure S9: Mean log-transformed Z-standardized concentrations of persistent EDCs (2 clusters) for the sensitivity analysis after removing outlier values (N= 724). Figure S10: Loading factors explaining biomarker concentrations of persistent EDCs (4 PCs) for the sensitivity analysis after removing outlier values (N= 724).
ACKNOWLEDGEMENTS
The research was also supported in part by the Intramural Research Program of the National Institute of Environmental Health Sciences, National Institute of Health (NIH). We want to kindly thank Olivia Orta for her support in the development of this work. We would also like to thank the Reviewers for their thoughtful comments and feedback.
Funding Sources
National Institute of Environmental Health Sciences R01-ES024749; National Institute of Environmental Health Sciences T32-ES014562.
ABBREVIATIONS
- SELF
Study of Environment, Lifestyle, and Fibroids
- EDC
endocrine disrupting chemicals
- PCBs
polychlorinated biphenyls
- PBDEs
polybrominated dipehyl ethers
- OCPs
organochlorine pesticides
- PFAS
per- and polyfluoroalkyl substances
- n-PFOS
linear perfluorooctanesulfonic acid
- Sm-PFOS
branched perfluorooctanesulfonic acid
- n-PFOA
linear perfluorooctanoic acid
- Sb-PFOA
branched perfluorooctanoic acid
- PFDA
perfluorodecanoic acid
- PFHxS
perfluorohexanesulfonic acid
- PFNA
perfluorononanoic acid
- PFUA
perfluoroundecanoic acid
- p-p’-DDE
dichlorodiphenyltrichloroethane
- p-p’-DDT
p-p’ dichlorodiphenyltrichloroethane
- o-p’-DDT
o-p’ dichlorodiphenyltrichloroethane
- β-HCH
β hexachlorocyclohexane
- γ-HCH
γ hexachlorocyclohexane
- UL
uterine leiomyoma
- NHANES
National Health and Nutrition Examination Survey
- LOD
limit of detection
- PCA
Principal Component Analysis
- PC
Principal Components
- OR
odds ratio
- IQR
interquartile range
- NC
not calculated
- NM
not measured
- SD
standard deviation
- SE
standard error
- BMI
body mass index
Footnotes
Publisher's Disclaimer: Disclaimer: The findings and conclusions in this report are those of the authors and do not necessarily represent the official position of the Centers for Disease Control and Prevention (CDC). Use of trade names is for identification only and does not imply endorsement by the CDC, the Public Health Service, or the U.S. Department of Health and Human Services.
Supporting Information.
The Supporting Information is available free of charge on the ACS Publication website at DOI:
REFERENCES
- (1).Diamanti-Kandarakis E; Bourguignon JP; Giudice LC; Hauser R; Prins GS; Soto AM; Zoeller RT; Gore AC Endocrine-Disrupting Chemicals: An Endocrine Society Scientific Statement. Endocrine Reviews. Oxford Academic; June 1, 2009, pp 293–342. 10.1210/er.2009-0002. [DOI] [PMC free article] [PubMed] [Google Scholar]
- (2).ATSDR - Toxicological Profile: Polybrominated Diphenyl Ethers (PBDEs) https://www.atsdr.cdc.gov/ToxProfiles/tp.asp?id=901&tid=183 (accessed Aug 17, 2020). [PubMed]
- (3).ATSDR - Toxicological Profile: Perfluoroalkyls https://www.atsdr.cdc.gov/toxprofiles/tp.asp?id=1117&tid=237 (accessed Aug 17, 2020).
- (4).ATSDR - Toxicological Profile: Polychlorinated Biphenyls (PCBs) https://www.atsdr.cdc.gov/toxprofiles/tp.asp?id=142&tid=26 (accessed Aug 17, 2020). [PubMed]
- (5).ATSDR - Toxicological Profile: DDT, DDE, DDD https://www.atsdr.cdc.gov/ToxProfiles/tp.asp?id=81&tid=20 (accessed Aug 17, 2020).
- (6).She J; Petreas M; Winkler J; Visita P; McKinney M; Kopec D PBDEs in the San Francisco Bay Area: Measurements in Harbor Seal Blubber and Human Breast Adipose Tissue. Chemosphere 2002, 46 (5), 697–707. 10.1016/S0045-6535(01)00234-X. [DOI] [PubMed] [Google Scholar]
- (7).Gu SY; Ekpeghere KI; Kim HY; Lee IS; Kim DH; Choo G; Oh JE Brominated Flame Retardants in Marine Environment Focused on Aquaculture Area: Occurrence, Source and Bioaccumulation. Sci. Total Environ 2017, 601-602, 1182–1191. 10.1016/j.scitotenv.2017.05.209. [DOI] [PubMed] [Google Scholar]
- (8).Norström K; Czub G; McLachlan MS; Hu D; Thorne PS; Hornbuckle KC External Exposure and Bioaccumulation of PCBs in Humans Living in a Contaminated Urban Environment. Environ. Int 2010, 36 (8), 855–861. 10.1016/j.envint.2009.03.005. [DOI] [PMC free article] [PubMed] [Google Scholar]
- (9).EPA. Technical Fact Sheet – Perfluorooctane Sulfonate (PFOS) and Perfluorooctanoic Acid (PFOA) https://www.epa.gov/fedfac/technical-fact-sheet-perfluorooctane-sulfonate-pfos-and-perfluorooctanoic-acid-pfoa-0 (accessed Dec 8, 2019).
- (10).EPA. Technical Fact Sheet – Polybrominated Diphenyl Ethers (PBDEs) https://www.epa.gov/fedfac/technical-fact-sheet-polybrominated-diphenyl-ethers-pbdes-and-polybrominated-biphenyls-pbbs (accessed Aug 17, 2020).
- (11).EPA. Learn about Polychlorinated Biphenyls (PCBs) https://www.epa.gov/pcbs/learn-about-polychlorinated-biphenyls-pcbs (accessed Aug 17, 2020).
- (12).CDC. Dichlorodiphenyltrichloroethane (DDT) Factsheet https://www.cdc.gov/biomonitoring/DDT_FactSheet.html (accessed Aug 17, 2020).
- (13).Ruiz D; Becerra M; Jagai JS; Ard K; Sargis RM Disparities in Environmental Exposures to Endocrine-Disrupting Chemicals and Diabetes Risk in Vulnerable Populations. Diabetes Care 2018, 41 (1), 193–205. 10.2337/dc16-2765. [DOI] [PMC free article] [PubMed] [Google Scholar]
- (14).Gasull M; Castell C; Pallarès N; Miret C; Pumarega J; Téllez-Plaza M; López T; Salas-Salvadó J; Lee DH; Goday A; Porta M Blood Concentrations of Persistent Organic Pollutants and Unhealthy Metabolic Phenotypes in Normal-Weight, Overweight, and Obese Individuals. Am. J. Epidemiol 2018, 187 (3), 494–506. 10.1093/aje/kwx267. [DOI] [PubMed] [Google Scholar]
- (15).Polychlorinated Biphenyls and Polybrominated Biphenyls; IARC Monographs on the Evaluation of Carcinogenic Risks to Humans, 2016; Vol. 107. [PMC free article] [PubMed] [Google Scholar]
- (16).Jacobson MH; Darrow LA; Barr DB; Howards PP; Lyles RH; Terrell ML; Smith AK; Conneely KN; Marder ME; Marcus M Serum Polybrominated Biphenyls (PBBs) and Polychlorinated Biphenyls (PCBs) and Thyroid Function among Michigan Adults Several Decades after the 1973–1974 PBB Contamination of Livestock Feed. Environ. Health Perspect 2017, 125 (9), 097020. 10.1289/EHP1302. [DOI] [PMC free article] [PubMed] [Google Scholar]
- (17).Chang ET; Adami HO; Boffetta P; Wedner HJ; Mandel JS A Critical Review of Perfluorooctanoate and Perfluorooctanesulfonate Exposure and Immunological Health Conditions in Humans. Critical Reviews in Toxicology. Taylor and Francis Ltd; April 20, 2016, pp 279–331. 10.3109/10408444.2015.1122573. [DOI] [PMC free article] [PubMed] [Google Scholar]
- (18).Steenland K; Zhao L; Winquist A; Parks C Ulcerative Colitis and Perfluorooctanoic Acid (PFOA) in a Highly Exposed Population of Community Residents and Workers in the Mid-Ohio Valley. Environ. Health Perspect 2013, 121 (8), 900–905. 10.1289/ehp.1206449. [DOI] [PMC free article] [PubMed] [Google Scholar]
- (19).Jayaraj R; Megha P; Sreedev P Review Article. Organochlorine Pesticides, Their Toxic Effects on Living Organisms and Their Fate in the Environment. Interdisciplinary Toxicology. Slovak Toxicology Society; December 1, 2016, pp 90–100. 10.1515/intox-2016-0012. [DOI] [PMC free article] [PubMed] [Google Scholar]
- (20).Carpenter DO Polychlorinated Biphenyls (PCBs): Routes of Exposure and Effects on Human Health. Reviews on Environmental Health. Freund Publishing House Ltd; 2006, pp 1–23. 10.1515/reveh.2006.21.1.1. [DOI] [PubMed] [Google Scholar]
- (21).ATSDR. Public Health Statement: Polybrominated Diphenyl Ethers (PBDEs) https://www.atsdr.cdc.gov/PHS/PHS.asp?id=1449&tid=183 (accessed Sep 29, 2020).
- (22).Christensen KY; Raymond M; Blackowicz M; Liu Y; Thompson BA; Anderson HA; Turyk M Perfluoroalkyl Substances and Fish Consumption. Environ. Res 2017, 154, 145–151. 10.1016/j.envres.2016.12.032. [DOI] [PubMed] [Google Scholar]
- (23).Fair PA; Wolf B; White ND; Arnott SA; Kannan K; Karthikraj R; Vena JE Perfluoroalkyl Substances (PFASs) in Edible Fish Species from Charleston Harbor and Tributaries, South Carolina, United States: Exposure and Risk Assessment. Environ. Res 2019, 171, 266–277. 10.1016/j.envres.2019.01.021. [DOI] [PMC free article] [PubMed] [Google Scholar]
- (24).ATSDR. PFAS chemical exposure https://www.atsdr.cdc.gov/pfas/health-effects/exposure.html (accessed Sep 29, 2020).
- (25).U.S. CDC. Fourth National Report on Human Exposure to Environmental Chemicals, Updated Tables; 2018. [PubMed] [Google Scholar]
- (26).Caspersen IH; Kvalem HE; Haugen M; Brantsæter AL; Meltzer HM; Alexander J; Thomsen C; Frøshaug M; Bremnes NMB; Broadwell SL; Granum B; Kogevinas M; Knutsen HK Determinants of Plasma PCB, Brominated Flame Retardants, and Organochlorine Pesticides in Pregnant Women and 3 Year Old Children in The Norwegian Mother and Child Cohort Study. Environ. Res 2016, 146, 136–144. 10.1016/j.envres.2015.12.020. [DOI] [PubMed] [Google Scholar]
- (27).Artacho-Cordón F; Belhassen H; Arrebola JP; Ghali R; Amira D; Jiménez-Díaz I; Pérez-Lobato R; Boussen H; Hedili A; Olea N Serum Levels of Persistent Organic Pollutants and Predictors of Exposure in Tunisian Women. Sci. Total Environ 2015, 511, 530–534. 10.1016/j.scitotenv.2014.12.093. [DOI] [PubMed] [Google Scholar]
- (28).Lewin A; Arbuckle TE; Fisher M; Liang CL; Marro L; Davis K; Abdelouahab N; Fraser WD Univariate Predictors of Maternal Concentrations of Environmental Chemicals: The MIREC Study. Int. J. Hyg. Environ. Health 2017, 220 (2), 77–85. 10.1016/j.ijheh.2017.01.001. [DOI] [PubMed] [Google Scholar]
- (29).Pavuk M; Olson JR; Wattigney WA; Dutton ND; Sjödin A; Shelton C; Turner WE; Bartell SM; Bartell S; Carpenter DO; Cash J; Foushee R; Percy A; Frumkin H; Lavender M; Moysich K; Olson J; Rosenbaum P; Silverstone A; Weinstock R Predictors of Serum Polychlorinated Biphenyl Concentrations in Anniston Residents. Sci. Total Environ 2014, 496, 624–634. 10.1016/j.scitotenv.2014.06.113. [DOI] [PMC free article] [PubMed] [Google Scholar]
- (30).Rylander C; Lund E; Frøyland L; Sandanger TM Predictors of PCP, OH-PCBs, PCBs and Chlorinated Pesticides in a General Female Norwegian Population. Environ. Int 2012, 43 (1), 13–20. 10.1016/j.envint.2012.02.008. [DOI] [PubMed] [Google Scholar]
- (31).Schade G; Heinzow B Organochlorine Pesticides and Polychlorinated Biphenyls in Human Milk of Mothers Living in Northern Germany: Current Extent of Contamination, Time Trend from 1986 to 1997 and Factors That Influence the Levels of Contamination. Sci. Total Environ 1998, 215 (1–2), 31–39. 10.1016/S0048-9697(98)00008-4. [DOI] [PubMed] [Google Scholar]
- (32).Vaclavik E; Tjonneland A; Stripp C; Overvad K; Philippe Weber J; Raaschou-Nielsen O Organochlorines in Danish Women: Predictors of Adipose Tissue Concentrations. Environ. Res 2006, 100 (3), 362–370. 10.1016/j.envres.2005.06.006. [DOI] [PubMed] [Google Scholar]
- (33).Moysich KB; Ambrosone CB; Mendola P; Kostyniak PJ; Greizerstein HB; Vena JE; Menezes RJ; Swede H; Shields PG; Freudenheim JL Exposures Associated with Serum Organochlorine Levels among Postmenopausal Women from Western New York State. Am. J. Ind. Med 2002, 41 (2), 102–110. 10.1002/ajim.10043. [DOI] [PubMed] [Google Scholar]
- (34).Shu H; Lindh CH; Wikström S; Bornehag C-G Temporal Trends and Predictors of Perfluoroalkyl Substances Serum Levels in Swedish Pregnant Women in the SELMA Study. PLoS One 2018, 13 (12), e0209255. 10.1371/journal.pone.0209255. [DOI] [PMC free article] [PubMed] [Google Scholar]
- (35).Horton MK; Bousleiman S; Jones R; Sjodin A; Liu X; Whyatt R; Wapner R; Factor-Litvak P Predictors of Serum Concentrations of Polybrominated Flame Retardants among Healthy Pregnant Women in an Urban Environment: A Cross-Sectional Study. Environ. Heal. A Glob. Access Sci. Source 2013, 12 (1), 23. 10.1186/1476-069X-12-23. [DOI] [PMC free article] [PubMed] [Google Scholar]
- (36).Sarcinelli PN; Pereira ACS; Mesquita SA; Oliveira-Silva JJ; Meyer A; Menezes MAC; Alves SR; Mattos RCOC; Moreira JC; Wolff M Dietary and Reproductive Determinants of Plasma Organochlorine Levels in Pregnant Women in Rio de Janeiro. Environ. Res 2003, 91 (3), 143–150. 10.1016/S0013-9351(02)00053-1. [DOI] [PubMed] [Google Scholar]
- (37).Sagiv SK; Rifas-Shiman SL; Webster TF; Mora AM; Harris MH; Calafat AM; Ye X; Gillman MW; Oken E Sociodemographic and Perinatal Predictors of Early Pregnancy Per- and Polyfluoroalkyl Substance (PFAS) Concentrations. Environ. Sci. Technol 2015, 49 (19), 11849–11858. 10.1021/acs.est.5b02489. [DOI] [PMC free article] [PubMed] [Google Scholar]
- (38).Bachelet D; Truong T; Verner MA; Arveux P; Kerbrat P; Charlier C; Guihenneuc-Jouyaux C; Guénel P Determinants of Serum Concentrations of 1,1-Dichloro-2,2-Bis(p-Chlorophenyl)Ethylene and Polychlorinated Biphenyls among French Women in the CECILE Study. Environ. Res 2011, 111 (6), 861–870. 10.1016/j.envres.2011.06.001. [DOI] [PubMed] [Google Scholar]
- (39).Kingsley SL; Eliot MN; Kelsey KT; Calafat AM; Ehrlich S; Lanphear BP; Chen A; Braun JM Variability and Predictors of Serum Perfluoroalkyl Substance Concentrations during Pregnancy and Early Childhood. Environ. Res 2018, 165, 247–257. 10.1016/j.envres.2018.04.033. [DOI] [PMC free article] [PubMed] [Google Scholar]
- (40).Bradman A; Schwartz JM; Fenster L; Barr DB; Holland NT; Eskenazi B Factors Predicting Organochlorine Pesticide Levels in Pregnant Latina Women Living in a United States Agricultural Area. In Journal of Exposure Science and Environmental Epidemiology; Nature Publishing Group, 2007; Vol. 17, pp 388–399. 10.1038/sj.jes.7500525. [DOI] [PMC free article] [PubMed] [Google Scholar]
- (41).Joseph AD; Terrell ML; Small CM; Cameron LL; Marcus M Assessing Inter-Generational Transfer of a Brominated Flame Retardant. J. Environ. Monit 2009, 11 (4), 802–807. 10.1039/b816867a. [DOI] [PubMed] [Google Scholar]
- (42).Costa O; Lopez-Espinosa MJ; Vizcaino E; Murcia M; Iñiguez C; Navarrete-Muñoz EM; Grimalt JO; Tardon A; Ballester F; Fernandez-Somoano A Dietary and Household Sources of Prenatal Exposure to Polybrominated Diphenyl Ethers (PBDEs) in the INMA Birth Cohort (Spain). Environ. Sci. Technol 2016, 50 (11), 5935–5944. 10.1021/acs.est.5b06263. [DOI] [PubMed] [Google Scholar]
- (43).Bräuner EV; Raaschou-Nielsen O; Gaudreau E; Leblanc A; Tjønneland A; Overvad K; Sørensen M Predictors of Polychlorinated Biphenyl Concentrations in Adipose Tissue in a General Danish Population. Environ. Sci. Technol 2011, 45 (2), 679–685. 10.1021/es102489c. [DOI] [PubMed] [Google Scholar]
- (44).Fernández-Rodríguez M; Arrebola JP; Artacho-Cordón F; Amaya E; Aragones N; Llorca J; Perez-Gomez B; Ardanaz E; Kogevinas M; Castano-Vinyals G; Pollan M; Olea N Levels and Predictors of Persistent Organic Pollutants in an Adult Population from Four Spanish Regions. Sci. Total Environ 2015, 538, 152–161. 10.1016/j.scitotenv.2015.07.162. [DOI] [PubMed] [Google Scholar]
- (45).Foster WG; Cheung AP; Davis K; Graves G; Jarrell J; Leblanc A; Liang CL; Leech T; Walker M; Weber JP; Van Oostdam J Circulating Metals and Persistent Organic Pollutant Concentrations in Canadian and Non-Canadian Born Primiparous Women from Five Canadian Centres: Results of a Pilot Biomonitoring Study. Sci. Total Environ 2012, 435-436, 326–336. 10.1016/j.scitotenv.2012.06.070. [DOI] [PubMed] [Google Scholar]
- (46).Gallo MV; Schell LM; DeCaprio AP; Jacobs A Levels of Persistent Organic Pollutant and Their Predictors among Young Adults. Chemosphere 2011, 83 (10), 1374–1382. 10.1016/j.chemosphere.2011.02.071. [DOI] [PMC free article] [PubMed] [Google Scholar]
- (47).Hardell E; Carlberg M; Nordström M; van Bavel B Time Trends of Persistent Organic Pollutants in Sweden during 1993–2007 and Relation to Age, Gender, Body Mass Index, Breast-Feeding and Parity. Sci. Total Environ 2010, 408 (20), 4412–4419. 10.1016/j.scitotenv.2010.06.029. [DOI] [PubMed] [Google Scholar]
- (48).Humblet O; Williams PL; Korrick SA; Sergeyev O; Emond C; Birnbaum LS; Burns JS; Altshul L; Patterson DG; Turner WE; Lee MM; Revich B; Hauser R Predictors of Serum Dioxin, Furan, and PCB Concentrations among Women from Chapaevsk, Russia. Environ. Sci. Technol 2010, 44 (14), 5633–5640. 10.1021/es100976j. [DOI] [PMC free article] [PubMed] [Google Scholar]
- (49).Ibarluzea J; Alvarez-Pedrerol M; Guxens M; Marina LS; Basterrechea M; Lertxundi A; Etxeandia A; Goñi F; Vioque J; Ballester F; Sunyer J Sociodemographic, Reproductive and Dietary Predictors of Organochlorine Compounds Levels in Pregnant Women in Spain. Chemosphere 2011, 82 (1), 114–120. 10.1016/j.chemosphere.2010.09.051. [DOI] [PubMed] [Google Scholar]
- (50).Kalloo G; Wellenius GA; McCandless L; Calafat AM; Sjodin A; Karagas M; Chen A; Yolton K; Lanphear BP; Braun JM Profiles and Predictors of Environmental Chemical Mixture Exposure among Pregnant Women: The Health Outcomes and Measures of the Environment Study. Environ. Sci. Technol 2018, 52 (17), 10104–10113. 10.1021/acs.est.8b02946. [DOI] [PMC free article] [PubMed] [Google Scholar]
- (51).James-Todd TM; Chiu Y-H; Zota AR Racial/Ethnic Disparities in Environmental Endocrine Disrupting Chemicals and Women’s Reproductive Health Outcomes: Epidemiological Examples Across the Life Course. Curr. Epidemiol. Reports 2016, 3 (2), 161–180. 10.1007/s40471-016-0073-9. [DOI] [PMC free article] [PubMed] [Google Scholar]
- (52).Cassidy-Bushrow AE; Sitarik AR; Havstad S; Park SK; Bielak LF; Austin C; Johnson CC; Arora M Burden of Higher Lead Exposure in African-Americans Starts in Utero and Persists into Childhood. Environ. Int 2017, 108, 221–227. 10.1016/j.envint.2017.08.021. [DOI] [PMC free article] [PubMed] [Google Scholar]
- (53).Taylor D Toxic Communities: Environmental Racism, Industrial Pollution, and Residential Mobility; New York University Press: New York, 2014. [Google Scholar]
- (54).Rothstein R The Color of Law, 1st ed.; Liveright Publishing Corporation: New York, 2017. [Google Scholar]
- (55).Burgess LD; Johnson GS; Washington SC An African American Community and The PCB Contamination In Anniston, Alabama: An Environmental Justice Case Study; 2014; Vol. 21. [Google Scholar]
- (56).Murray LR Sick and Tired of Being Sick and Tired: Scientific Evidence, Methods, and Research Implications for Racial and Ethnic Disparities in Occupational Health. American Journal of Public Health. American Public Health Association Inc. February 1, 2003, pp 221–226. 10.2105/AJPH.93.2.221. [DOI] [PMC free article] [PubMed] [Google Scholar]
- (57).Xue J; Liu SV; Zartarian VG; Geller AM; Schultz BD Analysis of NHANES Measured Blood PCBs i. The General US Population and Application of SHEDS Model to Identify Key Exposure Factors. J. Expo. Sci. Environ. Epidemiol 2014, 24 (6), 615–621. 10.1038/jes.2013.91. [DOI] [PubMed] [Google Scholar]
- (58).Krieger N; Wolff MS; Hiatt RA; Rivera M; Vogelman J; Orentreich N Breast Cancer and Serum Organochlorines: A Prospective Study among White, Black, and Asian Women. J. Natl. Cancer Inst 1994, 86 (8), 589–599. 10.1093/jnci/86.8.589. [DOI] [PubMed] [Google Scholar]
- (59).James-Todd TM; Chiu Y-H; Zota AR Racial/Ethnic Disparities in Environmental Endocrine Disrupting Chemicals and Women’s Reproductive Health Outcomes: Epidemiological Examples Across the Life Course. Curr. Epidemiol. Reports 2016, 3 (2), 161–180. 10.1007/s40471-016-0073-9. [DOI] [PMC free article] [PubMed] [Google Scholar]
- (60).Calafat AM; Kuklenyik Z; Reidy JA; Caudill SP; Tully JS; Needham LL Serum Concentrations of 11 Polyfluoroalkyl Compounds in the U.S. Population: Data from the National Health and Nutrition Examination Survey (NHANES) 1999–2000. Environ. Sci. Technol 2007, 41 (7), 2237–2242. 10.1021/es062686m. [DOI] [PubMed] [Google Scholar]
- (61).Calafat AM; Wong LY; Kuklenyik Z; Reidy JA; Needham LL Polyfluoroalkyl Chemicals in the U.S. Population: Data from the National Health and Nutrition Examination Survey (NHANES) 2003–2004 and Comparisons with NHANES 1999–2000. Environ. Health Perspect 2007, 115 (11), 1596–1602. 10.1289/ehp.10598. [DOI] [PMC free article] [PubMed] [Google Scholar]
- (62).Nelson JW; Scammell MK; Hatch EE; Webster TF Social Disparities in Exposures to Bisphenol A and Polyfluoroalkyl Chemicals: A Cross-Sectional Study within NHANES 2003–2006. Environ. Heal. A Glob. Access Sci. Source 2012, 11 (1), 10. 10.1186/1476-069X-11-10. [DOI] [PMC free article] [PubMed] [Google Scholar]
- (63).Orta OR; Wesselink AK; Bethea TN; Claus Henn B; McClean MD; Sjödin A; Baird DD; Wise LA Correlates of Plasma Concentrations of Brominated Flame Retardants in a Cohort of U.S. Black Women Residing in the Detroit, Michigan Metropolitan Area. Sci. Total Environ 2020, 714, 136777. 10.1016/j.scitotenv.2020.136777. [DOI] [PMC free article] [PubMed] [Google Scholar]
- (64).Orta OR; Wesselink AK; Bethea TN; Claus Henn B; Sjödin A; Wegienka G; Baird DD; Wise LA Correlates of Organochlorine Pesticide Plasma Concentrations among Reproductive-Aged Black Women. Environ. Res 2020, 184, 109352. 10.1016/j.envres.2020.109352. [DOI] [PMC free article] [PubMed] [Google Scholar]
- (65).Wesselink AK; Bethea TN; McClean M; Weuve J; Williams PL; Hauser R; Sjödin A; Brasky TM; Baird DD; Wise LA Predictors of Plasma Polychlorinated Biphenyl Concentrations among Reproductive-Aged Black Women. Int. J. Hyg. Environ. Health 2019, 222 (7), 1001–1010. 10.1016/j.ijheh.2019.06.008. [DOI] [PMC free article] [PubMed] [Google Scholar]
- (66).Zota AR; Shamasunder B The Environmental Injustice of Beauty: Framing Chemical Exposures from Beauty Products as a Health Disparities Concern. Am. J. Obstet. Gynecol 2017, 217 (4), 418.e1. 10.1016/J.AJOG.2017.07.020. [DOI] [PMC free article] [PubMed] [Google Scholar]
- (67).Helm JS; Nishioka M; Green Brody J; Rudel RA; Dodson RE Measurement of Endocrine Disrupting and Asthma-Associated Chemicals in Hair Products Used by Black Women. 2018. 10.1016/j.envres.2018.03.030. [DOI] [PubMed] [Google Scholar]
- (68).Boronow KE; Brody JG; Schaider LA; Peaslee GF; Havas L; Cohn BA Serum Concentrations of PFASs and Exposure-Related Behaviors in African American and Non-Hispanic White Women. J. Expo. Sci. Environ. Epidemiol 2019, 29 (2), 206–217. 10.1038/s41370-018-0109-y. [DOI] [PMC free article] [PubMed] [Google Scholar]
- (69).Baird DD; Harmon QE; Upson K; Moore KR; Barker-Cummings C; Baker S; Cooper T; Wegienka G A Prospective, Ultrasound-Based Study to Evaluate Risk Factors for Uterine Fibroid Incidence and Growth: Methods and Results of Recruitment. J. Women’s Heal 2015, 24 (11), 907–915. 10.1089/jwh.2015.5277. [DOI] [PMC free article] [PubMed] [Google Scholar]
- (70).BLOCK G; HARTMAN AM; DRESSER CM; CARROLL MD; GANNON J; GARDNER L A DATA-BASED APPROACH TO DIET QUESTIONNAIRE DESIGN AND TESTING. Am. J. Epidemiol 1986, 124 (3), 453–469. 10.1093/oxfordjournals.aje.a114416. [DOI] [PubMed] [Google Scholar]
- (71).Brasky TM; Bethea TN; Wesselink AK; Wegienka GR; Baird DD; Wise LA Dietary Fat Intake and Risk of Uterine Leiomyomata: A Prospective Ultrasound Study. Am. J. Epidemiol 2020. 10.1093/aje/kwaa097. [DOI] [PMC free article] [PubMed] [Google Scholar]
- (72).Sjo A; Jones RS; Lapeza CR; Focant J-FO; Mcgahee EE; Patterson DG Semiautomated High-Throughput Extraction and Cleanup Method for the Measurement of Polybrominated Diphenyl Ethers, Polybrominated Biphenyls, and Polychlorinated Biphenyls in Human Serum. 2004. 10.1021/ac030381. [DOI] [PubMed] [Google Scholar]
- (73).Kato K; Kalathil A; Patel A; Ye X; Calafat A Per- and Polyfluoroalkyl Substances and Fluorinated Alternatives in Urine and Serum by on-Line Solid Phase Extraction-Liquid Chromatography-Tandem Mass Spectrometry. Chemosphere 2018, 209, 338–345. 10.1016/J.CHEMOSPHERE.2018.06.085. [DOI] [PMC free article] [PubMed] [Google Scholar]
- (74).Botelho J; Pirkle JL Laboratory Procedure Manual Analytes: Perfluoroalkyl and Polyfluoroalkyl Substances Matrix: Serum Method: Online Solid Phase Extraction-High Performance Liquid Chromatography-Turbo Ion Spray-Tandem Mass Spectrometry (Online SPE-HPLC-TIS-MS/MS). [Google Scholar]
- (75).Bernert JT; Turner WE; Patterson DG; Needham LL Calculation of Serum “Total Lipid” Concentrations for the Adjustment of Persistent Organohalogen Toxicant Measurements in Human Samples. Chemosphere 2007, 68 (5), 824–831. 10.1016/j.chemosphere.2007.02.043. [DOI] [PubMed] [Google Scholar]
- (76).Taylor JK Quality Assurance of Chemical Measurements. Anal. Chem 2008, 53 (14), 1588–1596. 10.1021/AC00237A001. [DOI] [Google Scholar]
- (77).Fisher M; Arbuckle TE; Liang CL; Leblanc A; Gaudreau E; Foster WG; Haines D; Davis K; Fraser WD Concentrations of Persistent Organic Pollutants in Maternal and Cord Blood from the Maternal-Infant Research on Environmental Chemicals (MIREC) Cohort Study. Environ. Heal. A Glob. Access Sci. Source 2016, 15 (1). 10.1186/s12940-016-0143-y. [DOI] [PMC free article] [PubMed] [Google Scholar]
- (78).Berg V; Nøst TH; Huber S; Rylander C; Hansen S; Veyhe AS; Fuskevåg OM; Odland JØ; Sandanger TM Maternal Serum Concentrations of Per- and Polyfluoroalkyl Substances and Their Predictors in Years with Reduced Production and Use. Environ. Int 2014, 69, 58–66. 10.1016/j.envint.2014.04.010. [DOI] [PubMed] [Google Scholar]
- (79).Hornung RW; Reed LD Estimation of Average Concentration in the Presence of Nondetectable Values. Appl. Occup. Environ. Hyg 1990, 5 (1), 46–51. 10.1080/1047322X.1990.10389587. [DOI] [Google Scholar]
- (80).Columbia SPH. K-Means Cluster Analysis https://www.publichealth.columbia.edu/research/population-health-methods/k-means-cluster-analysis (accessed Dec 29, 2020).
- (81).Charrad M; Ghazzali N; Boiteau V; Niknafs A Nbclust: An R Package for Determining the Relevant Number of Clusters in a Data Set. J. Stat. Softw 2014, 61 (6), 1–36. 10.18637/jss.v061.i06. [DOI] [Google Scholar]
- (82).NbClust function | R Documentation https://www.rdocumentation.org/packages/NbClust/versions/3.0/topics/NbClust (accessed Sep 30, 2020).
- (83).Jolliffe IT; Cadima J Principal Component Analysis: A Review and Recent Developments. Philos. Trans. R. SocA Math. Phys. Eng. Sci 2016, 374 (2065), 20150202. 10.1098/rsta.2015.0202. [DOI] [PMC free article] [PubMed] [Google Scholar]
- (84).Raykov YP; Boukouvalas A; Baig F; Little MA What to Do When K-Means Clustering Fails: A Simple yet Principled Alternative Algorithm. PLoS One 2016, 11 (9). 10.1371/journal.pone.0162259. [DOI] [PMC free article] [PubMed] [Google Scholar]
- (85).Outlier Detection, Influential Observations, Stability, Sensitivity, and Robust Estimation of Principal Components. In Principal Component Analysis; Springer-Verlag, 2006; pp 232–268. 10.1007/0-387-22440-8_10. [DOI] [Google Scholar]
- (86).Rosner B Percentage Points for a Generalized ESD Many-Outlier Procedure. Technometrics 1983, 25 (2), 165. 10.2307/1268549. [DOI] [Google Scholar]
- (87).Wesselink AK; Fruh V; Hauser R; Weuve J; Taylor KW; Orta OR; Claus Henn B; Bethea TN; McClean MD; Williams PL; Calafat AM; Baird DD; Wise LA Correlates of Urinary Concentrations of Phthalate and Phthalate Alternative Metabolites among Reproductive-Aged Black Women from Detroit, Michigan. J. Expo. Sci. Environ. Epidemiol 2020. 10.1038/s41370-020-00270-9. [DOI] [PMC free article] [PubMed] [Google Scholar]
- (88).Zhou X-H; Eckert GJ; Tierney WM Multiple Imputation in Public Health Research. Stat. Med 2001, 20 (9–10), 1541–1549. 10.1002/sim.689. [DOI] [PubMed] [Google Scholar]
- (89).Wolff MS; Camann D; Gammon M; Stellman SD Proposed PCB Congener Groupings for Epidemiological Studies [1]. Environmental Health Perspectives. Public Health Services, US Dept of Health and Human Services; 1997, pp 13–14. 10.1289/ehp.9710513. [DOI] [PMC free article] [PubMed] [Google Scholar]
- (90).Blake BE; Pinney SM; Hines EP; Fenton SE; Ferguson KK Associations between Longitudinal Serum Perfluoroalkyl Substance (PFAS) Levels and Measures of Thyroid Hormone, Kidney Function, and Body Mass Index in the Fernald Community Cohort. Environ. Pollut 2018, 242 (Pt A), 894–904. 10.1016/j.envpol.2018.07.042. [DOI] [PMC free article] [PubMed] [Google Scholar]
- (91).Hölzer J; Midasch O; Rauchfuss K; Kraft M; Reupert R; Angerer J; Kleeschulte P; Marschall N; Wilhelm M Biomonitoring of Perfluorinated Compounds in Children and Adults Exposed to Perfluorooctanoate-Contaminated Drinking Water. Environ. Health Perspect 2008, 116 (5), 651–657. 10.1289/ehp.11064. [DOI] [PMC free article] [PubMed] [Google Scholar]
- (92).Nelson JW; Hatch EE; Webster TF Exposure to Polyfluoroalkyl Chemicals and Cholesterol, Body Weight, and Insulin Resistance in the General U.S. Population. Environ. Health Perspect 2010, 118 (2), 197–202. 10.1289/ehp.0901165. [DOI] [PMC free article] [PubMed] [Google Scholar]
- (93).Cardenas A; Hauser R; Gold DR; Kleinman KP; Hivert MF; Fleisch AF; Lin PID; Calafat AM; Webster TF; Horton ES; Oken E Association of Perfluoroalkyl and Polyfluoroalkyl Substances With Adiposity. JAMA Netw. open 2018, 1 (4), e181493. 10.1001/jamanetworkopen.2018.1493. [DOI] [PMC free article] [PubMed] [Google Scholar]
- (94).Park SK; Peng Q; Ding N; Mukherjee B; Harlow SD Determinants of Per- and Polyfluoroalkyl Substances (PFAS) in Midlife Women: Evidence of Racial/Ethnic and Geographic Differences in PFAS Exposure. Environ. Res 2019, 175, 186–199. 10.1016/j.envres.2019.05.028. [DOI] [PMC free article] [PubMed] [Google Scholar]
- (95).Mussalo-Rauhamaa H; Salmela SS; Leppanen A; Pyysalo H Cigarettes as a Source of Some Trace and Heavy Metals and Esticides in Man. Arch. Environ. Health 1986, 41 (1), 49–55. 10.1080/00039896.1986.9935765. [DOI] [PubMed] [Google Scholar]
- (96).Dane AJ; Havey CD; Voorhees KJ The Detection of Nitro Pesticides in Mainstream and Sidestream Cigarette Smoke Using Electron Monochromator-Mass Spectrometry. Anal. Chem 2006, 78 (10), 3227–3233. 10.1021/ac060328w. [DOI] [PubMed] [Google Scholar]
- (97).Nakayama H; Kita T; Nakashima T; Imaoka S; Funae Y The Roles of Cytochrome P450 in Nicotine Metabolism. In Nicotine and Related Alkaloids; Springer; Netherlands, 1993; pp 45–59. 10.1007/978-94-011-2110-1_3. [DOI] [Google Scholar]
- (98).Nebert DW; Russell DW Clinical Importance of the Cytochromes P450. Lancet. Elsevier Limited; October 12, 2002, pp 1155–1162. 10.1016/S0140-6736(02)11203-7. [DOI] [PubMed] [Google Scholar]
- (99).Lin PID; Cardenas A; Hauser R; Gold DR; Kleinman KP; Hivert MF; Fleisch AF; Calafat AM; Sanchez-Guerra M; Osorio-Yáñez C; Webster TF; Horton ES; Oken E Dietary Characteristics Associated with Plasma Concentrations of Per- and Polyfluoroalkyl Substances among Adults with Pre-Diabetes: Cross-Sectional Results from the Diabetes Prevention Program Trial. Environ. Int 2020, 137, 105217. 10.1016/j.envint.2019.105217. [DOI] [PMC free article] [PubMed] [Google Scholar]
- (100).Fraser AJ; Webster TF; McClean MD Diet Contributes Significantly to the Body Burden of PBDEs in the General U.S. Population. Environ. Health Perspect 2009, 117 (10), 1520–1525. 10.1289/ehp.0900817. [DOI] [PMC free article] [PubMed] [Google Scholar]
- (101).Tian Y; Zhou Y; Miao M; Wang Z; Yuan W; Liu X; Wang X; Wang Z; Wen S; Liang H Determinants of Plasma Concentrations of Perfluoroalkyl and Polyfluoroalkyl Substances in Pregnant Women from a Birth Cohort in Shanghai, China. Environ. Int 2018, 119, 165–173. 10.1016/j.envint.2018.06.015. [DOI] [PubMed] [Google Scholar]
- (102).Gibney M; Allison D; Bier D; Dwyer J Uncertainty in Human Nutrition Research. Nat. Food 2020 15 2020, 1 (5), 247–249. 10.1038/s43016-020-0073-2. [DOI] [Google Scholar]
- (103).Kim MK; Kim S; Yun S; Lee M; Cho B; Park J; Son S; Kim O Comparison of Seven Indicator PCBs and Three Coplanar PCBs in Beef, Pork, and Chicken Fat. Chemosphere 2004, 54 (10), 1533–1538. 10.1016/j.chemosphere.2003.10.044. [DOI] [PubMed] [Google Scholar]
- (104).Lupton SJ; Hakk H Polybrominated Diphenyl Ethers (PBDEs) in US Meat and Poultry: 2012–13 Levels, Trends and Estimated Consumer Exposures. Food Addit. Contam. - Part A Chem. Anal. Control. Expo. Risk Assess 2017, 34 (9), 1584–1595. 10.1080/19440049.2017.1340675. [DOI] [PubMed] [Google Scholar]
- (105).Noorlander CW; Van Leeuwen SPJ; Te Biesebeek JD; Mengelers MJB; Zeilmaker MJ Levels of Perfluorinated Compounds in Food and Dietary Intake of PFOS and PFOA in the Netherlands. J. Agric. Food Chem 2011, 59 (13), 7496–7505. 10.1021/jf104943p. [DOI] [PubMed] [Google Scholar]
- (106).Chen WL; Bai FY; Chang YC; Chen PC; Chen CY Concentrations of Perfluoroalkyl Substances in Foods and the Dietary Exposure among Taiwan General Population and Pregnant Women. J. Food Drug Anal 2018, 26 (3), 994–1004. 10.1016/j.jfda.2017.12.011. [DOI] [PMC free article] [PubMed] [Google Scholar]
- (107).Haug LS; Salihovic S; Jogsten IE; Thomsen C; van Bavel B; Lindström G; Becher G Levels in Food and Beverages and Daily Intake of Perfluorinated Compounds in Norway. Chemosphere 2010, 80 (10), 1137–1143. 10.1016/j.chemosphere.2010.06.023. [DOI] [PubMed] [Google Scholar]
- (108).Rush EL; Singer AB; Longnecker MP; Haug LS; Sabaredzovic A; Symanski E; Whitworth KW Oral Contraceptive Use as a Determinant of Plasma Concentrations of Perfluoroalkyl Substances among Women in the Norwegian Mother and Child Cohort (MoBa) Study. Environ. Int 2018, 112, 156–164. 10.1016/j.envint.2017.12.015. [DOI] [PMC free article] [PubMed] [Google Scholar]
- (109).Larsson G; Milsom L; Lindstedt G; Rybo G The Influence of a Low-Dose Combined Oral Contraceptive on Menstrual Blood Loss and Iron Status. Contraception 1992, 46 (4), 327–334. 10.1016/0010-7824(92)90095-B. [DOI] [PubMed] [Google Scholar]
- (110).Wong F; MacLeod M; Mueller JF; Cousins IT Enhanced Elimination of Perfluorooctane Sulfonic Acid by Menstruating Women: Evidence from Population-Based Pharmacokinetic Modeling. Environ. Sci. Technol 2014, 48 (15), 8807–8814. 10.1021/es500796y. [DOI] [PubMed] [Google Scholar]
- (111).Braun JM; Gennings C; Hauser R; Webster TF What Can Epidemiological Studies Tell Us about the Impact of Chemical Mixtures on Human Health? Environ. Health Perspect 2016, 124 (1), A6–A9. 10.1289/ehp.1510569. [DOI] [PMC free article] [PubMed] [Google Scholar]
- (112).Pariatamby A; Kee YL Persistent Organic Pollutants Management and Remediation. Procedia Environ. Sci 2016, 31, 842–848. 10.1016/j.proenv.2016.02.093. [DOI] [Google Scholar]
Associated Data
This section collects any data citations, data availability statements, or supplementary materials included in this article.
Supplementary Materials
Table S1: Median limits of detection for PCBs, PBDEs, and OCPs. Table S2: Study characteristics of women included in this analysis from the SELF cohort. Table S3: Geometric means and ranges of concentrations of persistent EDCs by cluster for the k-means clustering analysis when constrained to 2 clusters. Table S4: Adjusted odds of cluster membership for the k-means clustering sensitivity analysis with 3 clusters. Table S5: Adjusted odds of cluster membership for the k-means clustering sensitivity analysis with 4 clusters. Table S6: Adjusted odds of cluster membership for the k-means clustering sensitivity analysis with 5 clusters. Table S7: Loading factors explaining biomarker concentrations of persistent EDCs for the first 5 PCs. Table S8: Adjusted mean differences in PC scores for the PCA sensitivity analysis constrained to 2, 3, and 5 PCs. Table S9: K-means clustering sensitivity analysis (2 clusters) restricting to women with measurements on all persistent EDC classes (n= 590). Table S10: PCA sensitivity analysis (4 PCs) restricting to women with measurements on all persistent EDC classes (n= 590). Table S11: K-means clustering sensitivity analysis (2 clusters) restricting to women who were randomly selected into the sub-cohort at baseline (n= 592). Table S12: PCA sensitivity analysis (4 PCs) restricting to women who were randomly selected into the sub-cohort at baseline (n= 592). Table S13: K-means clustering sensitivity analysis (2 clusters) after removing outlier values (n= 724). Table S14: PCA sensitivity analysis (4 PCs) after removing outlier values (n= 724). Table S15: PCA sensitivity analysis for reduced models. Table S16: K-means clustering sensitivity analysis for reduced models. Figure S1: Case-cohort study design of SELF. Figure S2: Mean log-transformed Z-standardized concentrations of persistent EDCs by cluster when constraining the k-means analysis to 3 clusters. Figure S3: mean log-transformed Z-standardized concentrations of persistent EDCs by cluster when constraining the k-means analysis to 4 clusters. Figure S4: mean log-transformed Z-standardized concentrations of persistent EDCs by cluster when constraining the k-means analysis to 5 clusters. Figure S5: Mean log-transformed Z-standardized concentrations of persistent EDCs (2 clusters) for the sensitivity analysis restricting to women with measurements for all chemical classes (N= 590). Figure S6: Loading factors explaining biomarker concentrations of persistent EDCs (4 PCs) for the sensitivity analysis restricting to women with measurements for all chemical classes (N= 590). Figure S7: Mean log-transformed Z-standardized concentrations of persistent EDCs (2 clusters) for the sensitivity analysis restricting to women who were randomly selected into the sub-cohort at baseline (N= 590). Figure S8: Loading factors explaining biomarker concentrations of persistent EDCs (4 PCs) for the sensitivity analysis restricting to women who were randomly selected into the sub-cohort at baseline (N= 590). Figure S9: Mean log-transformed Z-standardized concentrations of persistent EDCs (2 clusters) for the sensitivity analysis after removing outlier values (N= 724). Figure S10: Loading factors explaining biomarker concentrations of persistent EDCs (4 PCs) for the sensitivity analysis after removing outlier values (N= 724).