

Abstract
Cancer-specific metabolic phenotypes and their vulnerabilities represent a viable area of cancer research. In this study, we explored the association of breast cancer subtypes with different metabolic phenotypes and identified isocitrate dehydrogenase 2 (IDH2) as a key player in triple-negative breast cancer (TNBC) and HER2. Functional assays combined with mass spectrometry–based analyses revealed the oncogenic role of IDH2 in cell proliferation, anchorage-independent growth, glycolysis, mitochondrial respiration, and antioxidant defense. Genome-scale metabolic modeling identified phosphoglycerate dehydrogenase (PHGDH) and phosphoserine aminotransferase (PSAT1) as the synthetic dosage lethal (SDL) partners of IDH2. In agreement, CRISPR-Cas9 knockout of PHGDH and PSAT1 showed the essentiality of serine biosynthesis proteins in IDH2-high cells. The clinical significance of the SDL interaction was supported by patients with IDH2-high/PHGDH-low tumors, who exhibited longer survival than patients with IDH2-high/PHGDH-high tumors. Furthermore, PHGDH inhibitors were effective in treating IDH2-high cells in vitro and in vivo. Altogether, our study creates a new link between two known cancer regulators and emphasizes PHGDH as a promising target for TNBC with IDH2 overexpression.
Introduction
Cancer cells reprogram their metabolic network during malignant transformation (1). Otto Warburg first recognized the metabolic phenotype of higher glucose metabolism to lactate even in oxygenrich conditions, a phenomenon termed “aerobic glycolysis” or “Warburg effect” (2). Apart from this well-known adaptive strategy, cancer cells extend their metabolic reprogramming far beyond glycolysis to glutamine metabolism, dysregulated mitochondrial function, and lipid metabolism (3). Metabolic reprogramming is often characterized by genetic alterations in metabolic enzymes. Mutations in the enzymes isocitrate dehydrogenases (IDH2), succinate dehydrogenase, fumarate hydratase, and amplification of phosphoglycerate dehydrogenase (PHGDH) are well-known metabolic determinants in various cancer types (4–7).
PHGDH is the first enzyme in the serine biosynthesis pathway and is amplified in estrogen receptor–negative breast cancer, lung adenocarcinoma, and melanoma (7–9). PHGDH diverts the glycolytic pathway by catalyzing the conversion of 3-phosphoglycerate (3-PG) to 3-phosphohydroxypyruvate (3-PHP). 3-PHP is transaminated by phosphoserine aminotransferase 1 (PSAT1) to 3-phosphoserine and to serine by phosphoserine phosphatase (PSPH). Serine and glycine contribute to one-carbon metabolism supporting NAPDH production and nucleotide and glutathione biosynthesis (10). Loss of PHGDH was shown to reduce cell proliferation and attenuate tumor growth, thus indicating an essential role in tumorigenesis (7, 8, 11).
IDH enzymes catalyze the oxidative decarboxylation of isocitrate to alpha-ketoglutarate (αKG) in the TCA cycle. IDH1 and 2 are NADP-dependent and IDH3 is NAD-dependent. IDH1 is cytosolic, while IDH2 and 3 are mitochondrial (12). Gain-of-function mutations in the IDH1/2 enzymes induce a neomorphic activity that converts αKG to 2-hydroxyglutarate (2HG; ref. 13). Oncogenic adaptations of IDH1 and 2 involves the reversible oxidative decarboxylation of isocitrate and redox balance to support cancer growth (14, 15). Despite the oncogenic significance of mutated IDH enzymes, overexpression of wild-type IDH2 has been reported in breast, colon, endometrioid, testicular, and prostate cancers (16–19).
Identification and exploitation of novel genetic interactions is an emerging approach to target cancer cells. One such interaction is synthetic dosage lethality (SDL), in which overexpression of a gene together with silencing of its gene partner is lethal to the cells (20). SDL-based approaches are of promising interest because they specifically target the gene partners of oncogenes while sparing the healthy cells. We used genome-scale metabolic modeling (GSMM) to exploit the proteomic data and identified the metabolic SDL gene pairs (21, 22). GSMM involves reconstruction of a metabolic network that characterizes the metabolic state upon certain perturbations and enables the prediction of essential gene pairs. Previous studies have implemented GSMM to identify cancer-specific metabolic phenotypes (23–25).
In this study, we aimed to delineate the metabolic determinants of triple-negative (TN) breast cancer and to identify the metabolically vulnerable SDL targets. IDH2 was identified as one of the central proteins associated with the TN metabolic network. Extending upon our previous study, which identified IDH2 overexpression in advanced stage of breast cancer (16), we characterized its protumorigenic metabolic role, and identified PSAT1 and PHGDH as its SDL partners. Finally, we found that high IDH2 expression marks increased cell sensitivity to pharmacologic PHGDH inhibitors in vitro and in vivo.
Materials and Methods
Cell culture
HCC38, HCC1599, HCC1954, HCC1500, HCC1937 (purchased from ATCC), and 4T1 (obtained from Dr. Zvi Granot, Faculty of medicine, The Hebrew University of Jerusalem, Israel) cell lines were cultured in RPMI1640 supplemented with 10% FBS, 2 mmol/L glutamine, 1% penicillin/streptomycin at 37°C with 5% CO2, unless otherwise specified. The cell lines were routinely verified to be Mycoplasma-free by PCR Detection Kit (Hy-Mycoplasma Detection Kit, Bio-labs). Cell line authentication was performed at the Genomics Core Facility of BioRap Technologies and the Rappaport Research Institute (Technion, Israel). The tests were performed using the Promega Power Plex 16 HS kit to determine short tandem repeat (STR) profiles.
Genetic perturbation of IDH2 expression
Wt-IDH2 was stably silenced in stage III breast cancer cell line HCC1599 and overexpressed in stage II HCC38 cell line. Transient IDH2 transfections were performed in three stage II cell lines, HCC1954, HCC1500, and HCC1937. Stable and transient transfections were carried out using Xfect Transfection Reagent (Clontech) according to the manufacturer’s instructions. HCC38 cells were transfected with pcDNA4/IDH2 construct for overexpression and pcDNA4/GFP as a control. HCC1599 cells were infected with retroviruses expressing pSUPER-retro constructs for IDH2 or control knockdown (shRNA sequences are given in Supplementary Table S1). 4T1 cells were stably infected using commercially available TRC2-pLKO lentivirus–based shRNA constructs for IDH2 or control knockdown (Sigma).
CRISPR-cas9 technology was used to knockout IDH2 in stage II HCC1143 cells and PHGDH or PSAT1 in stage II HCC38 cells. Six single guide RNAs (gRNA) from GenScript for each gene were examined and the gRNA with complete knockout was selected for the experiments. The gRNAs were cloned into PX459 vector (Addgene plasmid #62988; ref. 26), with active Cas9 enzyme from Streptococcus pyogenes upstream to the human U6 promoter, a puromycin-resistant gene and ampicillin-resistant gene. The plasmids for gene deletion were transfected using Xfect reagent. Western blotting and mass spectrometry–based proteomics analysis evaluated the positive stable clones. The sequence of the gRNAs that were selected for the experiments are listed in Supplementary Table S1. Single-cell clones with complete knockout were isolated for further experiments. HCC1143 and HCC38 cells with PX459 vector (no gRNA) were used for all the experiments as a control.
Western blot analysis
Cells were lysed in lysis buffer containing 4% SDS and 50 mmol/L Tris-HCl, pH 7.5, and then diluted in Laemmli sample buffer. Proteins were resolved on 10% SDS-PAGE and transferred to polyvinylidene difluoride membranes, or alternatively analyzed by the Mini-PROTEAN Precast Gels (Bio-Rad). Membranes were probed with primary antibodies (anti-IDH2 1:1000; Atlas Antibodies, anti-GFP 1:5000; Santa Cruz Biotechnology, anti-PHGDH 1:1000; Cell Signaling Technology; and anti-PSAT1 1:1000; ProteinTech). Anti-Tubulin (1:5000; EMD Millipore) and HSC 70 (1:5000; Abcam) were used as loading controls.
Cell proliferation and colony formation in anchorage-independent conditions
Cells were seeded at a density of 3,000 cells per well in 96-well plates. They were fixed with 0.5% glutaraldehyde and the growth rates were assessed by micro-culture methylene blue assay. For drug sensitivity assay, 10,000 cells/well were seeded in a 96-well plate and treated with NCT-502 for 48 hours. For anchorage independent growth, 30,000 cells were seeded in 0.3% top agar on top of 1% bottom agar in 6-well plates. Four weeks later, the colonies were fixed with 4% paraformaldehyde and stained with 0.01% crystal violet. For oxidative stress assay, 5,000 cells/well were seeded in 96-well plates, followed by H2O2 treatment for 48 hours and methylene blue staining. For rescue experiments, 0.5 mmol/L dimethyl-2-oxoglutarate (DMKG) was supplemented in the media.
Measurement of bioenergetic profile
Extracellular acidification rates (ECAR) and oxygen consumption rates (OCR) were measured using the XFe96 Extracellular Flux Analyzer (Seahorse Bioscience, Agilent). 2 × 10⁴ cells were seeded in XFe96 Cell Culture Microplates precoated with 20 mg/mL poly-D-lysine, to reach 90% confluence before measurements. The cells were replaced to XF base medium (Seahorse Bioscience) and incubated at 37°C without CO2 for 45 minutes prior to the assay. ECAR was measured under basal condition, upon sequential supplementation of 10 mmol/L glucose, 1 μmol/L oligomycin, and 50 mmol/L 2-deoxyglucose over a period of 90 minutes. OCR was measured under basal respiration, upon sequential treatment with 1 μmol/L oligomycin, 0.5 μmol/L carbonyl cyanide-4-(trifluoromethoxy) phenylhydrazone (FCCP), and 0.5 μmol/L antimycin A and rotenone for over 90 minutes. ECAR and OCR measurements were normalized to the cell index as measured by methylene-blue staining (described above) at the end of the experiment.
Intracellular reactive oxygen species measurements
Cells were seeded at a density of 7,000 cells per well in a 96-well glass bottom black plates (In Vitro Scientific) to reach 80% confluence. Cells were treated with 25 μmol/L H2O2 or with H2O2 and 4 mmol/L N-acetylcysteine (NAC) for 3 hours and stained with 5 μmol/L of CellROX Orange reagent (Molecular Probes) and Hoechst (Thermo Fisher Scientific) at 37°C for 30 minutes. The cells were washed twice with PBS and replaced with fresh medium for live imaging of intracellular reactive oxygen species (ROS). For basal redox state measurement, the cells were stained with CellROX Orange reagent without H2O2 treatment. ROS levels were quantified as a measure of fluorescence at 545/565 nm using ImageJ.
In vivo experiment
Examination of the SDL interaction of IDH2 and PHGDH in vivo was performed on 4T1 TN breast cancer model in female BALB/c mice (6–8 weeks old). Mice were purchased from Harlan, Israel, and animals were maintained at the Tel Aviv University Specific Pathogen-Free (SPF) facility. All animal procedures included in the study were granted ethical approval by the Tel Aviv University Institutional Animal Care and Use Committee. Briefly, 2 × 10⁵ 4T1 shControl or shIDH2 cells were resuspended in PBS and mixed 1:1 with growth factor–reduced Matrigel (356231, BD Biosciences) immediately before injection. Preshaved mice were injected orthotopically into the 4th mammary gland, with a 29G insulin syringe (100 μL). NCT-503 (MedChem Express) was dissolved in a vehicle of 5% ethanol, 35% PEG 300 (Sigma), and 60% of an aqueous 30% hydroxypropyl-β cyclodextrin (Sigma) solution and injected at 40 mg/kg i.p. once daily. Treatment started from the fifth day after tumor injection, when the tumors were palpable. The dose was adjusted according to the weight of each mouse, and the injection volume was 100 μL. Tumor volume were measured three times weekly using calipers and were calculated using the formula X2Y 0.5 (X-smaller diameter, Y-larger diameter). The mice did not lose body weight during the NCT-503 treatment. At the end of the study, the mice were euthanized and the tumor weight was measured.
MS-based proteomic analysis
Cells were lysed in 6 mol/L urea, 2 mol/L thiourea in 100 mmol/L Tris-HCl (pH 8.5). Forty micrograms of proteins were reduced with 1 mmol/L dithiothreitol at room temperature for 30 minutes and alkylated with 5 mmol/L iodoacetamide for 30 minutes in the dark. The lysates were diluted 4-fold with 50 mmol/L ammonium bicarbonate, followed by overnight digestion with sequencing grade–modified trypsin (Promega). Resulting peptides were acidified with trifluoroacetic acid and subjected to strong cation exchange fractionation, followed by desalting on C18 Stage Tips and vacuum dried. Peptides were resuspended in 2% acetonitrile/ 0.1% trifluoroacetic acid prior to the LC/MS-MS analysis.
Peptides were analyzed using nano-ultra high-performance liquid chromatography (nano-UPLC; Easy-nLC1000; Thermo Scientific) coupled on-line to a Q-Exactive Plus mass spectrometer (Thermo Scientific). Peptides were eluted with a 140-minute linear gradient of water/acetonitrile. The Q-Exactive instrument was operated in a data-dependent mode to automatically switch between mass spectrometry (MS) and tandem mass spectrometry (MS/MS) scans. Top 10 precursor m/z values from each MS scan were selected and fragmented by higher-energy collisional dissociation (HCD) for MS/MS. Raw files were analyzed with the MaxQuant version (1.5.6.9) and the Andromeda search engine (27). MaxQuant parameters were the same as mentioned in the data analysis section except for the peptide quantification, which was performed using label-free quantification algorithm (LFQ).
All the statistical analyses of the MaxQuant output tables were performed with the Perseus software (28). The LFQ intensities were log2 transformed and the data were filtered to retain proteins with at least 70% quantitative values from all the samples. HCC38 cells with IDH2 overexpression, HCC1599 and HCC1143 cells with control knockdown were categorized as “high IDH2” group and compared with their counterparts with “low IDH2” expression. Student t test was performed with FDR threshold of 0.1. Enrichment analysis was performed on the t test significant proteins using Fisher exact test (FDR = 0.02). ANOVA (FDR = 0.05) was performed to evaluate the differentially expressed proteins between HCC38 cells with PHGDH or PSAT knockout with transient IDH2/mCherry overexpression. The MS proteomics data have been deposited to the ProteomeXchange Consortium via the PRIDE (29) partner repository with the dataset identifier PXD023142.
MS-based metabolomic analysis
Cells were grown in glutamine and glucose-free RPMI, supplemented either with 2 mmol/L 13C5 or 15N2-glutamine or 5 mmol/L 13C6-D-glucose (Cambridge Isotope Laboratories), 10% dialyzed FBS, and 1% antibiotics (penicillin–streptomycin). After 24-hour growth, metabolites were extracted with methanol: acetonitrile: water (5:3:2) and the lysates were rotated at 4°C for 10 minutes and centrifuged at 14,000 × g for 10 minutes at 4°C. For exometabolome, the cells were cultured in with 2 mmol/L glutamine and 25 mmol/L glucose for 72 hours. Exometabolome was extracted with acetonitrile: water (4:1), vortexed vigorously, and centrifuged at 14,000 × g for 10 minutes at 4°C. LC separation of metabolites was performed using SeQuant ZIC-pHILIC (150 × 2.1 mm, 5 μmol/L) connected to a SeQuant ZIC-pHILIC guard column (20 × 2.1 mm, 5 μmol/L; Merck) with a flow rate 0.1 mL/minute on the Ultimate 3000 UHPLC (Dionex, Thermo Scientific), with buffer A (95% acetonitrile) and buffer B (50 mmol/L ammonium carbonate, pH 10, 5% acetonitrile). Metabolites were separated in a 49-minute gradient from 8% to 32% buffer B, followed by a column wash and reequilibration at 80% buffer B, and the injection volume was 5 μL. Q-Exactive Plus mass spectrometer (Thermo Scientific) was operated in full scan mode following electrospray ionization, in a polarity switching mode over a mass range of 75–1,125 m/z with resolution of 70,000. Metabolites were analyzed using LCquan 2.7 (Thermo scientific) based on purified standard metabolites with exact mass within 5 ppm, except for glycine (10 ppm). Peak areas of the metabolites were normalized to the total intensity of the MS raw files. For lactate secretion, the levels of lactate in the medium control samples were subtracted from the levels in each sample, followed by total protein normalization. For glucose uptake, the glucose levels in the samples were substracted from the medium control, followed by total protein normalization. To assess the metabolic effects of the PHGDH inhibitor, cells were pretreated with NCT-502 (Cayman Chemical; 0.01 μmol/L for HCC38 and 0.5 μmol/L for HCC1143) in RPMI for 1 hour, followed by PBS wash and replaced with 5 mmol/L 13C6-D-glucose and 2 mmol/L glutamine in serine-glycine-free RPMI media with and without NCT-502 for 4 hours.
GSMM
GSMM analysis was performed in two steps. First, the wild-type metabolic states of HCC38 and HCC1599 cell lines were determined by integrating their proteomics profiles with the human metabolic model using the iMAT algorithm (30). Second, we used the MOMA algorithm to identify metabolic genes whose knockout inhibits biomass production of IDH2-high cells but not in IDH2-low cells (31).
Analysis of metabolic genes in clinical breast tumor proteomes
We integrated the breast tumor datasets from our previously published studies (32, 33), which resulted in 145 tumors. The datasets were analyzed together by MaxQuant (version 1.5.6.9) and the integrated Andromeda search engine (27, 34). MS/MS spectra were searched with reference to human Uniprot database (updated April 2018). FDRs were set for 0.01 for protein identifications and peptide spectrum matches. The peptide search included carbamidomethyl-cysteine as a fixed modification, and N-terminal acetylation and methionine oxidation as variable modifications. Stable isotope labeling by amino acids in cell culture (SILAC) as an internal standard was used for peptide quantification with lysine 8 and arginine 10. Trypsin was the specified protease and the maximal number of missed cleavages allowed was two. The minimal peptide length was set to seven amino acids. All the bioinformatics analyses were performed in the Perseus software (28).
The weighted gene coexpression network analysis (WGCNA) package (implemented in Perseus) constructs network with modules of highly correlating proteins (35). Soft threshold was applied with correlation function “cor” and a power of 10 that satisfied the scale-free topology fit criteria that generated a signed network of 10 modules. The correlations between the module eigengenes and the clinical variables (tumor subtype and grade) were calculated using Pearson correlation to determine the module-trait relationship. Enrichments of processes within the modules were performed using Fisher exact test (FDR 0.02). The proteins in the modules with significant positive correlation (P < 0.05) with the TN subtype were selected for centrality analysis to identify the “hub” proteins within the network. The protein–protein interaction network was visualized in Cytoscape.
Results
Proteomics-based metabolic profiling of breast cancer subtypes
Aiming to profile the distinct metabolic phenotypes of breast cancer subtypes and to identify the phenotype-specific metabolic vulnerabilities, we integrated breast cancer proteomic datasets from two published studies from our laboratory; dataset 1 (33) consists of 109 pretreatment tumor samples, and dataset 2 (32) consists of 36 pretreatment tumor samples. Integrating both datasets generated a cohort of 145 macro-dissected breast tumors consisting of samples from all the subtypes of invasive ductal carcinoma, including 92 Luminal tumors (ER/PR), 28 TN, 16 HER2, and 9 triple positive tumors. A combined analysis of the integrated cohort resulted in 10,381 protein identifications with >5,000 proteins on average per sample (Supplementary Table S2A). Pearson correlation coefficients between the tumor proteomes were between 0.35 and 0.85 with a median correlation of 0.54 (Supplementary Fig. S1A).
We focused our analyses on metabolic enzymes (Recon 3 human metabolic model) to reveal the vulnerabilities of cancer aggressiveness. Unsupervised analysis using WGCNA identified nine protein modules that positively correlate with breast tumor subtypes and grade (Fig. 1A; Supplementary Table S2B; named by color). Blue, brown, black and red modules consisting of 117, 97, 42, and 46 proteins, respectively, showed positive correlation with grade 3 and with TN and HER2 subtypes, suggesting involvement of these modules in tumor aggressiveness (Fig. 1A; Supplementary Table S3A). Green, magenta, yellow, and pink modules consisting of 62, 37, 83, and 38 proteins, respectively, positively correlated with grade 2 and with luminal and TP subtype, which suggests association with reduced aggressiveness (Fig. 1A; Supplementary Table S3A).
Figure 1.

Coexpressed network module analysis of metabolic proteins in breast tumor subtypes. A, Heatmap of the signed network of ten eigenmodules generated by the WGCNA (left) and pathway enrichment within the modules (right). Eigenmodules are represented by the vertical dendrogram and the clinical parameters (tumor subtype and grade) by the horizontal dendrogram. Significant modules are highlighted. *, P < 0.05; **, P < 0.01. B, Metabolic network of proteins associated with the TN subtype generated using cytoscape. The proteins are colored based on the measure of degree centrality. C, Top 20 hub proteins based on the degree centrality are highlighted in the sub-network. Key glycolytic proteins, TCA cycle—related, and pentose phosphate pathway are represented in different colors. D, mRNA expression of wild-type IDH1, IDH2, and ACLY in four breast cancer subtypes from the TCGA data. IDH1 and IDH2 expression levels correlated with tumor aggressiveness from luminal to HER2 tumors (**, P < 0.01).
Enrichment analysis on the module proteins showed that TN and HER2 tumors were significantly enriched for glycolysis, vesicle-mediated transport, oligosaccharyl-transferase complex, steroid biosynthesis, pentose phosphate pathway, and ATP binding (Fig. 1A; Supplementary Table S3B–S3J). Pyruvate and fatty acid metabolism were enriched only in the TN subtype. Luminal and TP tumors were significantly enriched for electron transport chain, oxidative phosphorylation, TCA cycle, and ATP synthesis, in agreement with previous studies (36–38). Altogether, WGCNA showed on a global scale the known breast cancer subtype–specific metabolic signatures and highlighted the essential pathways of aggressive subtypes.
To identify the key drivers that play a role in the aggressiveness of TN subtype, we performed a centrality analysis of the three modules (blue, black, and red; Fig. 1B). Top 20 most central proteins that formed the core of the network included proteins involved in glycolysis (LDHA, LDHB, ENO1, PGK1, GPI, PFKL, PKM, PGM1), TCA cycle-related (IDH1, IDH2, ACLY), and pentose phosphate pathway (G6PD, H6PD, PGD, TKT; Fig. 1C; Supplementary Table S4). We were intrigued to find TCA cycle–related proteins associated with the glycolytic module and therefore focused our investigation on the involvement of these proteins in the glycolytic phenotype of TN tumors. mRNA levels of IDH2, based on The Cancer Genome Atlas (TCGA) data, showed that its expression correlated with tumor aggressiveness from luminal to HER2, while IDH1 mRNA level was increased only in HER2 tumors and ACLY was higher in luminal B and HER2 (Fig. 1D). In addition, the TCGA Pan Cancer Atlas study showed that breast-invasive carcinoma harbored mutations in IDH1 and ACLY, while IDH2 was nonmutated and was more highly expressed in breast cancer than in other cancer types (cBioportal; Supplementary Fig. S1B–S3D). Examination of other IDH family enzymes IDH3A, IDH3B, and IDH3G exhibited inconsistent mRNA expression patterns between the subtypes (Supplementary Fig. S1E). These results prompted us to perform in-depth investigation of the metabolic dependence of IDH2, and to identify its metabolic vulnerabilities.
IDH2 overexpression promotes tumorigenic phenotype, glycolysis, and regulates TCA cycle in TNBC cells
We perturbed IDH2 levels by overexpression, shRNA-based silencing, and CRISPR-Cas9 knockout in TNBC cell lines. IDH2 was stably overexpressed in stage II HCC38 cells with low endogenous expression, silenced in stage III HCC1599 cells with high endogenous expression and knocked-out using CRISPR-cas9 in stage II HCC1143 cells with high endogenous levels (Fig. 2A). Overexpression of IDH2 increased the anchorage-independent growth in soft agar and IDH2 knockout reduced the colony-forming ability (Fig. 2B and C). In addition, high IDH2 expression increased cell survival under oxidative stress and reduced cell survival upon IDH2 knockout (Fig. 2D). Given that each cell degrades H2O2 differently, H2O2 levels were calibrated per cell lines and furthermore, the antioxidant response was evaluated by cellROX staining after induced oxidative stress. IDH2-high cells had reduced cellROX staining with increased antioxidant capacity compared with increased cellROX staining in IDH2-low cells (Fig. 2E; Supplementary Fig. S2A and S2B). Interestingly, proliferation rate in two-dimensional cultures showed reduced proliferation of IDH2-knockout cells compared with control, but no significant proliferation change was observed in IDH2-stable overexpression, or upon transient overexpression of IDH2 in three additional stage II cell lines, HCC1500 (TN), HCC1937 (TN), and HCC1954 (HER2; Fig. 2F; Supplementary Fig. S2C–S2F). Rescue of IDH2 expression in the knockout cells showed increased resistance to oxidative stress compared with the knockout counterparts (Supplementary Fig. S2G and S2H). Functional assays were not performed in HCC1599 due to their aggregated growth with large clumps in suspension culture. Altogether, these functional assays showed that IDH2 promotes the protumorigenic phenotypes of breast cancer cells.
Figure 2.

Protumorigenic effects of IDH2 in TNBC cell lines. A, Proteomic (top) and Western blot (bottom) analysis of IDH2-perturbed cell lines. IDH2 was overexpressed in HCC38 cell line (control-ox and IDH2-ox), knockdown by shRNA- in HCC1599 (control-kd and IDH2-kd) or knockout by CRISPR-Cas9 in HCC1143 cell line (control-ko and IDH2-ko). LFQ, label-free quantification. B, Colony formation assay in soft agar indicated increased number size of the colonies with high IDH2 expression. Scale bar, 100 μm. C, Quantification of the size (diameter) and the number of colonies using ImageJ. D, IDH2-high levels increased resistance to H2O2-induced oxidative stress. E, Reduced cellROX staining (orange) in IDH2-overexpressing HCC38 cells treated with 25 μmol/L of hydrogen peroxide (H2O2). Increased CellROX staining in IDH2 knockout HCC1143 cells treated with 50 μmol/L of H2O2. Hoechst was used as a nuclear stain (blue). F, No significant difference in the proliferation rate of IDH2-overexpressing cells, while knockout cells showed reduced proliferation. G and H, Increased glucose uptake and lactate secretion with high IDH2 expression. I, ECAR, an indicator of glycolytic function increased in cells with high IDH2 expression. *, P < 0.05; **, P < 0.01. Data are represented as mean ± SD from three independent experiments.
Examination of the metabolic effects of IDH2 perturbation showed increased glycolysis upon IDH2 high expression, as measured by the ECAR, glucose uptake, and lactate secretion (Fig. 2G–I; Supplementary Fig. S2I–S2K). To study the changes in a global manner, we analyzed the proteomes of cells with perturbed IDH2 levels. We identified 9,695 proteins from triplicate analyses of all the six cell lines HCC38 (Control-ox and IDH2-ox), HCC1599 (Control-kd and IDH2-kd), and HCC1143 (Control-ko and IDH2-ko; Supplementary Table S5A). A comparison of significantly changing proteins between IDH2-high and IDH2-low cells identified 948 differentially expressed proteins (FDR < 0.1), with upregulation of 439 proteins (130 metabolic proteins) and downregulation of 509 proteins (127 proteins metabolic proteins; Supplementary Fig. S3A; Supplementary Table S5B). Various metabolic processes such as glycolysis, oxidative phosphorylation, mitochondrial ATP synthesis, glutathione metabolism, and pyruvate metabolism were significantly enriched with high IDH2 levels (Fisher exact test, FDR = 0.02; Supplementary Fig. S3B; Supplementary Table S5C). Proteins involved in NELF complex, DNA repair machinery, pre-ribosome complex, and rRNA processing were enriched with low IDH2 cells (Supplementary Fig.S3B; Supplementary Table S5D).
The proteomic alterations suggest that IDH2 overexpression may elevate central metabolism pathways (TCA and glycolysis-related) that facilitate induction of oncogenic phenotypes. To validate these results, we performed isotope tracing with 13C5-glutamine and monitored the isotopologue distribution of TCA cycle metabolites. In concordance with the elevated TCA cycle and oxidative phosphorylation proteins in IDH2-high cells, isotope tracing from 13C5-glutamine depicted increased alpha-ketoglutarate (m5), citrate (m4), and aspartate (m4) (Fig. 3A–C). Citrate (m4) and aspartate (m4) are derived from the forward, oxidative glutamine metabolism of the TCA cycle (Fig. 3D). Reductive metabolism of glutamine mediated by IDH1/2 has been observed during hypoxia, mitochondrial dysfunction, and during redox homeostasis in anchorage-independent growth (14, 39–41). In parallel to the increased oxidative metabolism, cells with high IDH2 had increased levels of citrate (m5) and aspartate (m3), which indicated reductive carboxylation even under normoxic conditions with active mitochondrial function (Fig. 3B and C). In accordance, the fractional contribution of Glutamine (m5) to citrate (m5), aKG (m5) and aspartate (m3) and the ratios of citrate 5/4 and aspartate 3/4 increased with IDH2 overexpression and reduced with IDH2 knockout (Supplementary Fig. S4A–S4E). In accordance with increased oxidative metabolism in the TCA cycle, higher mitochondrial respiration was observed in high IDH2 cells (Fig. 3E; Supplementary Fig. S4F–S4H). In agreement with the genetically perturbed cells, a comparison between the basal IDH2 levels in the different cell lines correlated with isotopologue labeling patterns. Glutamine (m5) tracing in HCC38 with low basal IDH2 showed that >80% of total citrate is citrate (m4) and >60% of aspartate is aspartate (m4) (Supplementary Fig. S4A). In contrast, HCC1599 and HCC1143 cells with high basal IDH2, showed similar proportion of oxidative and reductive metabolism (Supplementary Fig. S4B and S4C). In addition, citrate (m4) and (m5) labeling correlated with basal IDH2 levels (Supplementary Fig. S4I). Overall, these results show higher induction of reductive TCA cycle metabolism in IDH2-high cells.
Figure 3.

IDH2 induces metabolic reprogramming in TNBC. Isotopolog abundance of each metabolite in response to IDH2 perturbed expression upon 13C5-glutamine tracing. A, αKG (m5) was increased in IDH2-overexpressing HCC38 cells and decreased in IDH2-knockout HCC1143 cells. B, Citrate (m4) and (m5) levels significantly correlated with IDH2 expression. m4 indicates increased oxidative glutamine metabolism, while m5 indicates increased reductive metabolism. Other isotopologs of citrate m0, m 1, m2, and m3 reduced in IDH2-low cells. C, Aspartate (m3) and m4, which indicate reductive and oxidative TCA cycle metabolism, respectively, were affected by IDH2 perturbations. D, Scheme of isotope tracing from 13C5-glutamine labeling. Gray carbon atoms were derived from the oxidative decarboxylation from αKG through citrate m4 and aspartate m4. Blue carbons were from the reductive carboxylation from αKG through citrate m5 and aspartate m3. E, Higher oxygen consumption in high IDH2 cells under basal conditions, as well as upon inhibition of the ATP synthase with oligomycin, mitochondrial uncoupling with FCCP, and inhibition of the electron transport chain complex III and I with antimycin A and rotenone, respectively. *, P < 0.05; **, P < 0.01. Data are represented as mean ± SD from three independent experiments.
GSMM identifies serine synthesis pathway as a synthetic dosage lethal partner with IDH2
To predict the potential metabolic vulnerability of IDH2 we applied GSMM, incorporating the proteomic data of the IDH2-perturbed cell lines. Constraint-based modeling with the iMAT algorithm computed the most likely metabolic activity in the cells, and the minimization of metabolic adjustment (MOMA) algorithm was then used to predict the protein essentiality only in IDH2-high cells. The MOMA analysis predicted PHGDH, PSAT1, and S-formyl glutathione hydrolase (ESD) as essential proteins for IDH2-induced biomass production, thus forming SDL interactions with IDH2 (Fig. 4A). PHGDH is the first enzyme in the serine biosynthesis pathway; it diverts 3-phosphoglycerate (3-PG) from glycolytic pathway to 3-phospho-hydroxypyruvate (3-PHP) and PSAT1 transaminates 3-PHP to phosphoserine and subsequently to serine and glycine (Fig. 4B). ESD converts S-formyl-glutathione to glutathione and formate, which is further fed into the one-carbon metabolism pathway (Fig. 4B). Examination of the clinical significance of the SDL interactions using mRNA expression data from the METABRIC project showed better survival of patients with IDH2-high/PHGDH-low or PSAT1-low than patients with high PHGDH or PSAT (Fig. 4C). There were no significant differences related to PHGDH and PSAT, in the group of IDH2-low patients (Fig. 4D). Further supporting the MOMA predictions, we found a positive correlation between the expression of IDH2 and PHGDH and PSAT in breast tumor transcriptomics data (from the TCGA) and in the clinical proteomics data (Fig. 4E and F). In agreement, expression of PHGDH, PSAT1, and PSPH was higher in IDH2-high cells HCC1599, HCC1143 under basal conditions, and in addition, increased with IDH2 overexpression in HCC38 and reduced upon IDH2 knockout in HCC1143, yet it was inconsistent in the IDH2 knockdown in HCC1599 cells and in the transient overexpression systems (Supplementary Fig. S5A and S5B). In accordance, 13C6-glucose tracing showed that serine (m3) and glycine (m2) levels were higher in IDH2-high cells (Fig. 4G and H; Supplementary Fig. S5C and S5D). The fractional contribution from 13C6-glucose to serine (m3) and glycine (m2) increased with IDH2 overexpression and reduced with IDH2 knockdown and knockout (Supplementary Fig. S5E). Serine (m3) levels also correlated with basal IDH2 in the different cell lines (Supplementary Fig. S5F). Therefore, in addition to the increased glycolysis, IDH2 diverts the glycolytic intermediates to serine and glycine synthesis, which is required for the bioenergetic demand and precursors that support cancer growth.
Figure 4.
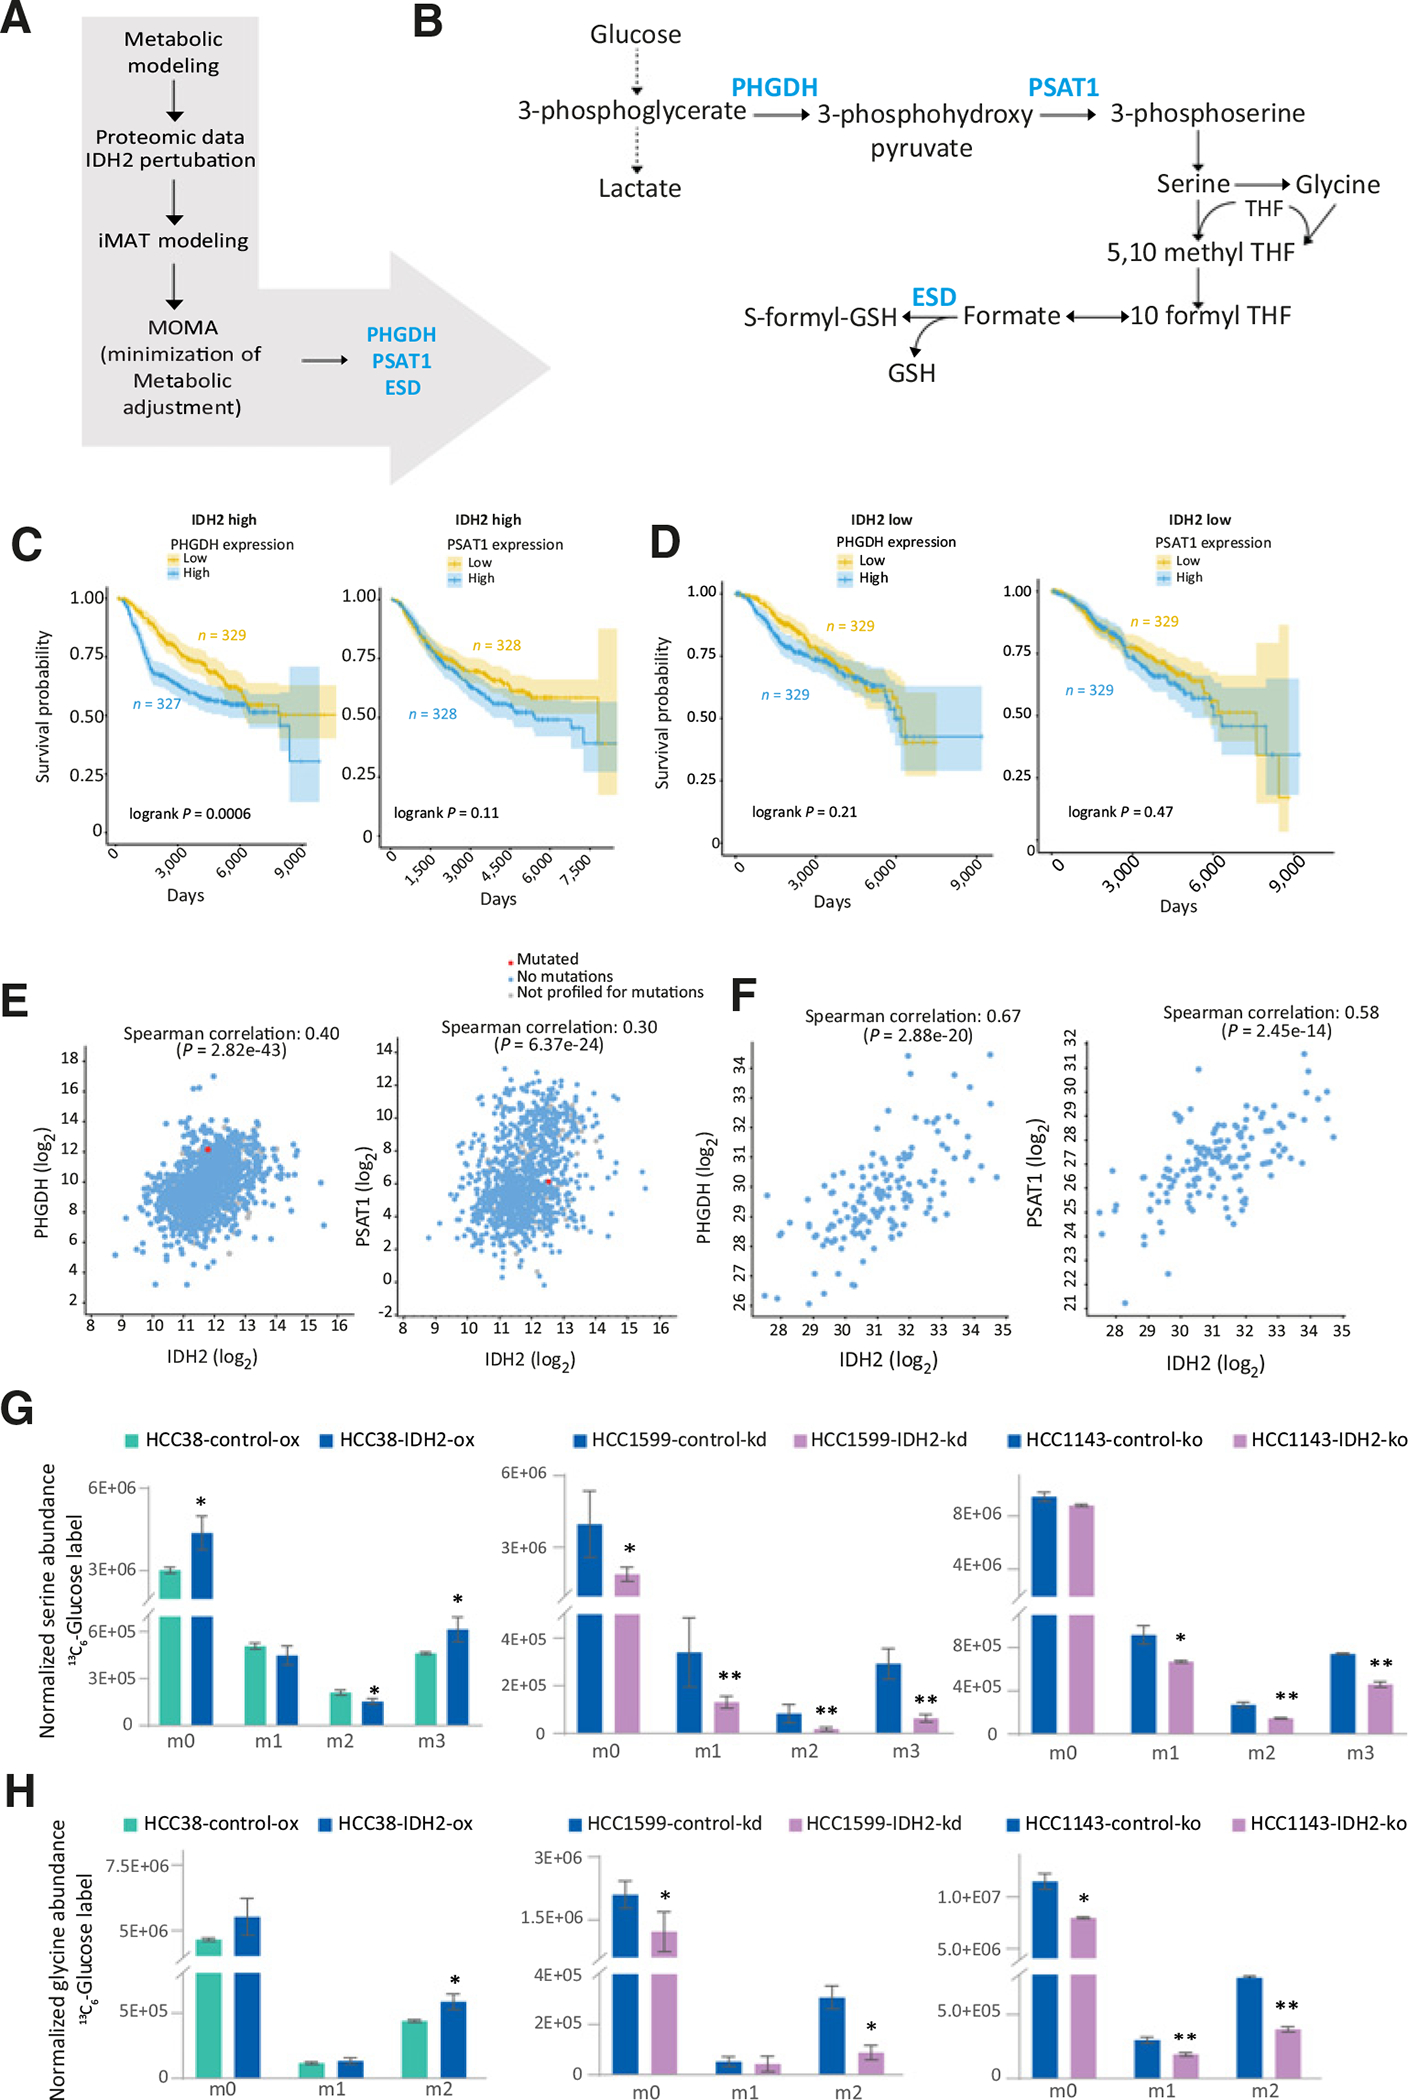
Targeting the metabolic dependencies of IDH2-overexpressing cells. A, Schematic workflow of the steps of the GSMM approach to identify metabolic vulnerable targets of IDH2. B, Illustration of the serine-glycine biosynthesis pathway, highlighting the metabolic model predictions (PHGDH, PSAT1, and ESD). C, Kaplan–Meier analysis shows better survival of patients with IDH2-high/PHGDH-low or PSAT1-low, than patients with high PHGDH or PSAT. D, No differences in the IDH2-low patients with PHGDH/PSAT1-high/low. METABRIC breast cancer data (n = 2472) was used for the survival analysis. E, Correlation of IDH2 with PHGDH (left) and PSAT1 (right) in the TCGA mRNA breast cancer data. F, Protein correlation of IDH2 with PHGDH (left) and PSAT1 (right) in the integrated proteomics data. G and H, Increased serine (m3) and glycine (m2) represented the diversion of 3-phosphoglycerate toward serine biosynthesis in IDH2 with 13C6-glucose labeling. Increased serine and glycine in high IDH2 cells support the metabolic modeling predictions. *, P < 0.05; **, P < 0.01.
PHGDH and PSAT1 knockout hindered the TCA cycle function and mitochondrial respiration in IDH2-high cells
In cancer cells with high PHGDH expression, serine biosynthesis pathway has been shown to contribute 50% of the aKG through PSAT1 transamination reaction to the TCA cycle (Fig. 5A; ref. 7). Hence, we hypothesized that IDH2-high cells will be more sensitive to PHGDH or PSAT knockout, due to their higher metabolic activity. To that end we knocked out PHGDH and PSAT1 in HCC38 cells, and transiently overexpressed IDH2 (Supplementary Fig. S6A–S6C). Isotope tracing with 13C6-glucose or 15N2-glutamine showed reduced incorporation of 13C or 15N to serine (m3 or m1, respectively) and glycine (m2 or m1, respectively; Supplementary Fig. S6D–S6I). The fraction of m1 glutamate did not change significantly between the control and knockout cells, presumably due to the activity of alternative pathway (e.g., via GLUD1; Supplementary Fig. S6G–S6I). As expected, loss of either PHGDH or PSAT1 in IDH2-high cells resulted in reduced entry of glutamine-derived carbons into the TCA cycle intermediates (Fig. 5B–G; Supplementary Fig. S7A–S7F), resulting in decreased oxygen consumption in the control cells with IDH2 high (active PHGDH and PSAT1) compared with the IDH2 low (PHGDH and PSAT1 knockout; Fig. 5H and I; Supplementary Fig. S7G). Our analyses showed that 20%–30% of the glutamine to αKG through PHGDH and PSAT1 contributed to enhanced TCA cycle activity and mitochondrial respiration in IDH2-high cells (Supplementary Fig. S7H).
Figure 5.

Metabolic vulnerabilities of PHGDH and PSAT1 knockouts with IDH2 overexpression in HCC38 cells. A, Pathway scheme depicts the diverted glycolysis to the TCA cycle through serine synthesis mediated by PHGDH and PSAT1. B–G, Decreased isotopologue abundances of glutamate, αKG, citrate, malate, aspartate, and fumarate from 13C5-glutamine upon PHGDH & PSAT1 knockout with transient IDH2-overexpressing HCC38 cells. H–I, Decreased OCRs in the basal and maximal respiration in the Mito stress assay measured using Seahorse flux analyzer. *, P < 0.05; * *, P < 0.01.
We validated the involvement of αKG in IDH2-induced protumorigenic phenotypes using rescue experiments by supplementing the culture media with DMKG, a cell-permeable precursor for αKG, and investigated the phenotypes. DMKG supplementation to IDH2 knockout cells rescued the cell proliferation, anchorage-independent growth, induced resistance to oxidative stress, and increased mitochondrial respiration (Fig. 6A–D). These results show that IDH2 expression contributes to higher αKG levels inducing alterations in the TCA cycle and promotes protumorigenic phenotypes.
Figure 6.
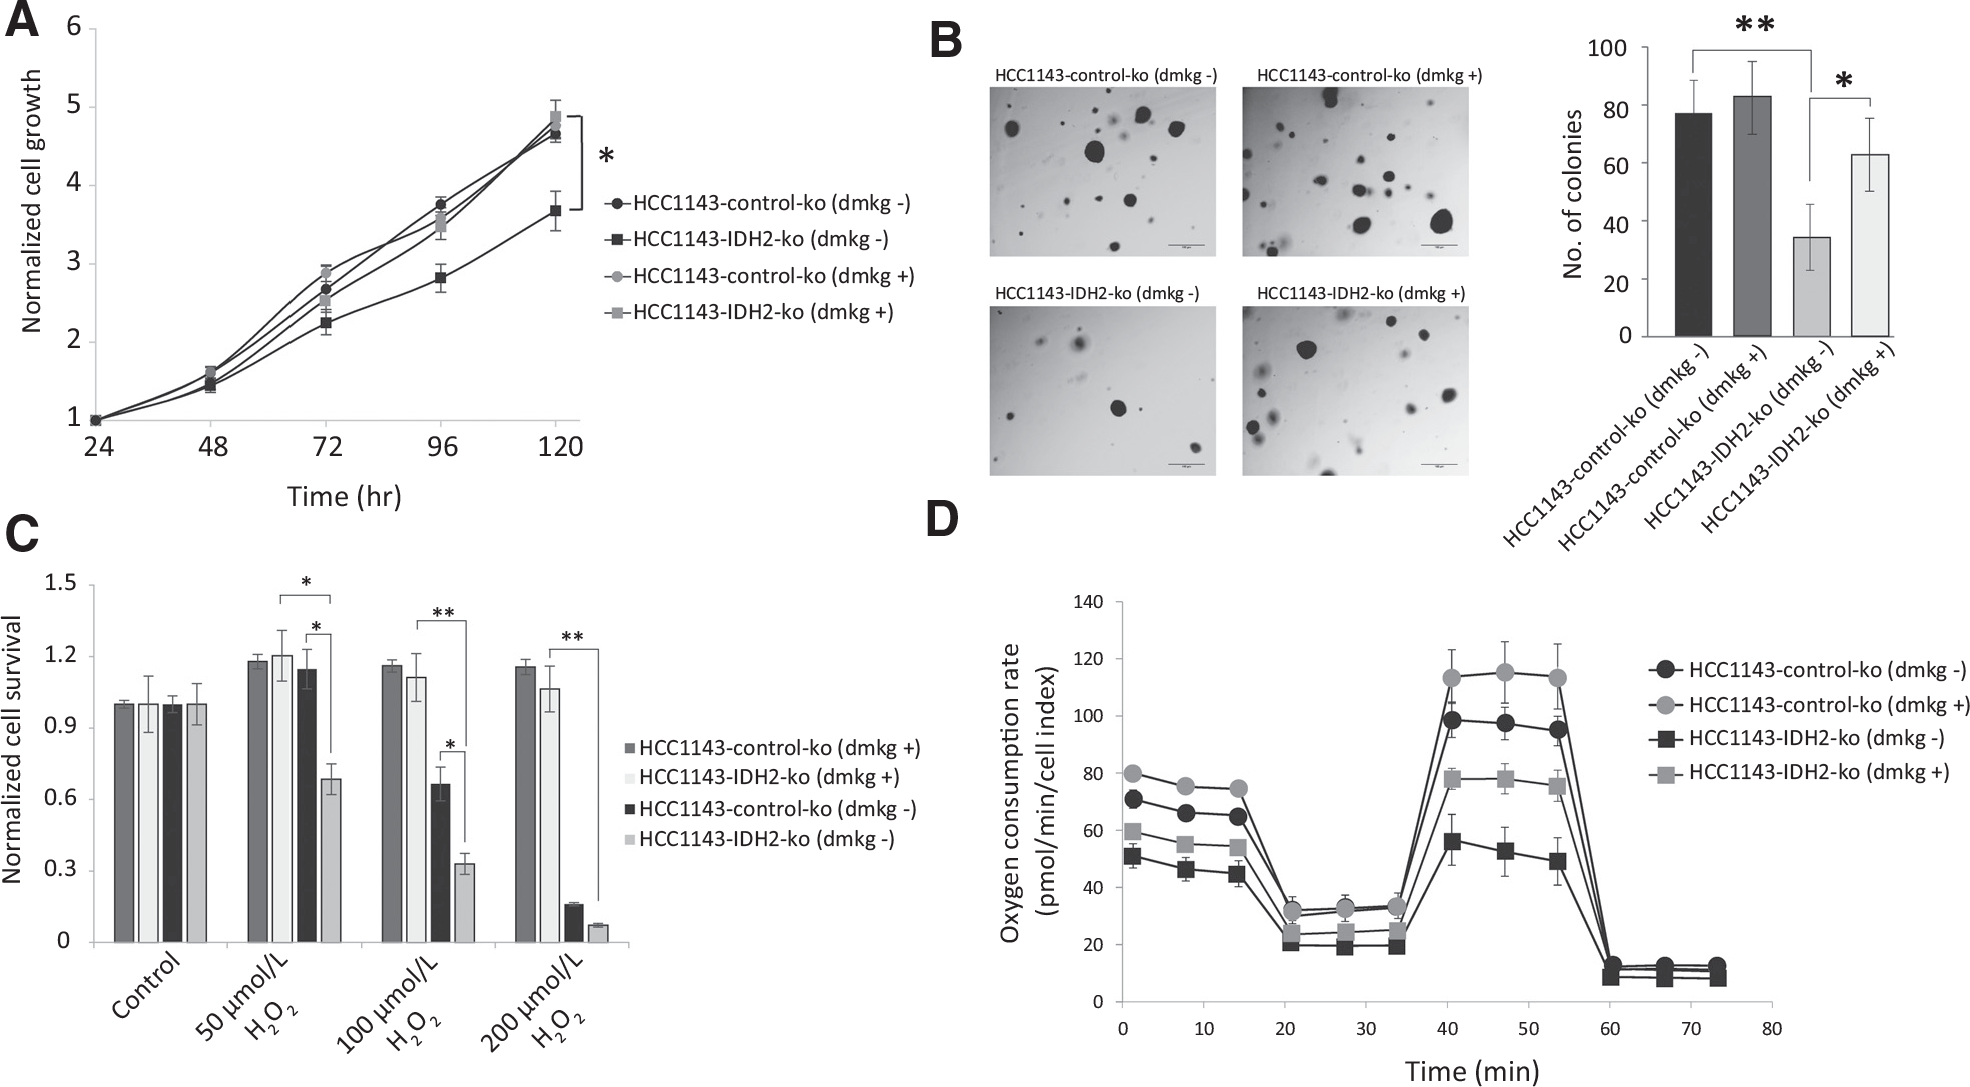
Rescue of the protumorigenic phenotypes in IDH2 knockout cells by DMKG. DMKG rescues cell proliferation of IDH2 knockout HCC1143 cells (A), anchorage-independent growth (B), resistance to oxidative stress (C), and increased mitochondrial respiration (D). *, P < 0.05; **, P < 0.01.
In view of the role of PHGDH and PSAT1 in mediating IDH2-dependent metabolic remodeling, we investigated the proteomic ramifications of these interactions. Proteins involved in metabolism, translation machinery, ribosome biogenesis, splicing, and cell migration were upregulated by IDH2 and downregulated with PHGDH and PSAT1 knockouts (Supplementary Fig. S8A and S8B; Supplementary Table S6). Major metabolic proteins included the cytochrome family (CYCS, CYC1, CYB5R1), glutamine uptake and glutamate metabolism (SLC1A5 and GLUD1), solute carrier transporters (SLC25A1 – CIC, citrate/malate transporter, SLC25A11 – OGC, alpha-ketoglutarate/malate transporter and SLC25A5 – ATP/ADP transporter), lipid metabolism (SOAT1, TSPO, ACAD9), and glycolytic proteins (HK1 and PKM). We speculated that a decrease in the metabolic activity upon PHGDH and PSAT1 knockout might contribute to the redox imbalance and sensitize the cells to oxidative damage. Indeed, the loss of PHGDH and PSAT1 induced vulnerability to oxidative damage and the cell survival was lower than the control cells (Supplementary Fig. S8C). Thus, PHGDH and PSAT1 play an essential role in providing anabolic sources of nucleotides, lipids, and amino acids in cells with high IDH2, and support cellular stress resistance (Supplementary Fig. S8D).
Pharmacologic inhibition of PHGDH sensitizes cells with high IDH2 and inhibits tumor growth in vivo
Aiming to translate the SDL interaction to cancer therapy, we examined the sensitivity of IDH2-high cells to PHGDH inhibitors, in vitro and in vivo. Cells with stable IDH2 overexpression and IDH2 knockout were treated with PHGDH inhibitor (NCT-502) for 48 hours in RPMI medium without serine and glycine. Initial metabolic analysis showed that PHGDH inhibition reduced serine (m3) and glycine (m2) labeling from 13C6-glucose (Supplementary Fig. S8E–S8H). The dose range of NCT-502 was calibrated for each cell line (HCC38 and HCC1143), due to basal differences in cell line sensitivities. In agreement with the SDL prediction, HCC38 cells with IDH2 overexpression were more sensitive to NCT-502 treatment (IC50: 0.05 μmol/L) compared with the control cells with low IDH2 expression (IC50: 0.18 μmol/L; Fig. 7A). Control knockout HCC1143 cells with high basal IDH2 were more sensitive to NCT-502 (IC50: 0.5 μmol/L) compared with the cells with IDH2 knockout (IC50: 2.2 μmol/L; Fig. 7B). Next, we examined the efficacy of the PHGDH inhibitor in an in vivo murine model, 4T1 TN breast cancer cells, with high basal IDH2 and PHGDH expression. We knocked down IDH2 using stable shRNA constructs and the knockdown was confirmed by Western blotting (Supplementary Fig. S8I). 4T1 cells exhibited reduced cell proliferation and colony formation upon IDH2 knockdown (Fig. 7C and D). In addition, DMKG supplement to the murine 4T1 cells with IDH2 knockdown rescued the reduced cell proliferation and colony formation (Fig. 7C and D). Finally, we tested the efficacy of PHGDH inhibitors on the 4T1 tumors with IDH2-high levels. 4T1 cells with high and low IDH2 expression were injected orthotopically to mammary glands of female mice and treated with the PHGDH inhibitor NCT-503 (Supplementary Fig. S8J), which is reported to have increased solubility in vivo (42). Analysis of tumor growth revealed that 4T1 tumors with high IDH2 showed enhanced tumor growth with larger tumor size and weight compared with the tumors with low IDH2 (Fig. 7E–G; Supplementary Fig. S8K). In addition, only the IDH2-high tumors treated with NCT-503 showed reduced tumor size and weight compared with the IDH2-high tumors treated with vehicle (Fig. 7E–G). IDH2-low tumors treated with either NCT-503 or vehicle were not affected by the treatment. Altogether, pharmacologic inhibition of serine biosynthesis using PHGDH inhibitor affects only the growth of IDH2-high cells. This in vivo validation demonstrated the SDL interaction between PHGDH and IDH2 and strengthened the metabolic alterations and the in vitro protumorigenic phenotypes. Our study emphasizes PHGDH inhibition as a promising therapeutic approach for TN breast tumors with high IDH2.
Figure 7.

PHGDH inhibition sensitizes cells with high IDH2 and inhibits tumor growth in vivo. A, IDH2-overexpressing cells are more sensitive to PHGDH inhibition with NCT-502 with an IC50 of 0.05 μmol/L compared with 0.18 μmol/L in the control cells. B, Control knockout cells with high IDH2 level were more sensitive, with an IC50 of 0.5 μmol/L compared with IDH2 KO cells with 2.2 μmol/L.C and D, Reduced cell proliferation and colony formation of murine 4T1 cells with IDH2 knockdown and rescue of cell proliferation and colony formation with DMKG supplementation. E, Tumor growth in BALB/c mice injected with 4T1 cells with high and low IDH2 expression, with (n = 6) and without treatment (n = 6) with PHGDH inhibitor (NCT-503). F, Endpoint of tumor volume measurement on day 26 is shown. G, Bar plots show the tumor weight at the end of the experiment (day 26). *, P < 0.05; **, P < 0.01; ns, nonsignificant.
Discussion
In this study, we characterized the metabolic phenotypes of breast cancer subtypes, aiming to find molecular associations that affect cancer aggressiveness. In accordance with previous findings, we found glycolytic proteins to be associated with ER-negative subtypes and oxidative phosphorylation proteins to be associated with ER-positive subtypes (36–38). In addition, our data revealed wt-IDH2 in the central metabolic hub of the TN breast cancer network, suggesting a potential role in the aggressiveness of TN cancers. This study showed the metabolic association between IDH2 expression and glycolysis toward serine biosynthesis and coupling to TCA cycle anaplerosis. Furthermore, PHGDH inhibitor dysregulated the metabolic state and reduced the protumorigenic phenotype of IDH2 high cells, emphasizing the synthetic dosage lethal interaction between IDH2 and PHGDH in TNBC.
Metabolic analysis showed that IDH2 reprograms the metabolic activity by increasing oxidative and reductive metabolism of αKG. The reductive metabolism results in increased substrate availability for IDH3, which contributes to NADH production in the mitochondria. Reductive carboxylation of αKG by the IDH1/2, has been reported during hypoxia, dysfunctional mitochondria, and for redox homeostasis during anchorage-independent growth (14, 39–41). We observed reductive metabolism from glutamine and upregulation of steroid biosynthesis proteins in cells with high IDH2 even at normoxic conditions (Fig. 3A–C; Supplementary Fig. S3A). Reductive glutamine metabolism was shown to be induced by increased aKG/citrate ratio, which results from alterations that affect the acetyl-CoA to citrate conversion (43). We speculate that increased αKG levels, through the serine synthesis pathway promotes reductive metabolism in IDH2-high cells. Though our results demonstrate the induction of reductive glutamine metabolism by IDH2, we could not specifically determine the compartmentalization of the reductive metabolism.
Serine biosynthesis proteins, PHGDH and PSAT1, were predicted as the synthetic dosage lethal partners for IDH2-induced metabolic reprogramming. PHGDH was previously identified to be overexpressed in TN-breast cancer and was found to be an essential gene, based on RNAi screens (7, 8). PHGDH and PSAT1 have crucial roles in influencing metabolic rewiring of cancer cells: (i) Serine-glycine biosynthesis contributes to the one-carbon metabolism that enables synthesis of bioenergetic precursors and to maintain redox homeostasis; (ii) PSAT1-transamination reaction of glutamate to αKG contributes to the replenishment of TCA cycle intermediates. (iii) PHGDH is involved in maintaining mitochondrial redox homeostasis and regulates nucleotide metabolism and glutathione synthesis (10). Beyond genetic alterations of PHGDH in breast cancer, Wang and colleagues identified RNF5 as the E3 ubiquitin ligase of PHGDH and showed that downregulation of RNF5 in breast cancer leads to PHGDH overexpression (44). Interestingly, we observed downregulation of RNF5 in IDH2 high cells in our proteomics data. We speculate that RNF5 in IDH2-high cells prevents the degradation of PHGDH, which results in increased tumorigenic potential in IDH2-high cells.
Disruption of the serine biosynthesis pathway abrogated the anaplerosis of glutamine-derived carbons into the TCA cycle and resulted in dysregulated mitochondrial respiration in IDH2-high cells. In support of this, proteomic analysis showed downregulation of SLC1A5 (glutamine uptake), GLUD1 (glutamate dehydrogenase), and the mitochondrial solute carriers, SLC25A11 (αKG carrier) and SLC25A1 (citrate carrier) in high IDH2 cells with PHGDH or PSAT1 knockout (Fig. 7A; Supplementary Table S5). Downregulation of SLC25A11, a member of malate aspartate shuttle suggests lower transfer of reducing equivalents produced from glycolysis to the mitochondria. SLC25A1 is involved in the bidirectional transport of citrate between the mitochondria and the cytosol. Therefore, its downregulation suggests reduced lipid biosynthesis and redox homeostasis with decreased NADPH supply from reductive carboxylation (39, 45). Thus, the impaired TCA cycle entry imposed by PHGDH and PSAT1 knockout further exacerbated the metabolic state of IDH2 cells, culminating in reduced tumorigenicity. Supporting this, PHGDH inhibition induced metabolic stress in IDH2-high cells and abrogated cell survival and tumor growth (Fig. 7A, B, and E). The impact of PHGDH activity on the TCA cycle was previously reported by Reid and colleagues, who showed that PHGDH contributed to nucleotide metabolism mainly through the TCA cycle and pentose phosphate pathway (46). The efficacy of PHGDH inhibitors has been reported in in vitro and in vivo models of breast and renal cancers and necessitates the need for clinical trials to improve cancer therapy in the future (42, 47, 48). Given the efficacy of PHGDH inhibitor in IDH2-high cells and the survival data of SDL interaction, our results demonstrate the indispensable role of PHGDH in IDH2-mediated metabolic transformations in breast cancer. Thus, our study highlights targeting PHGDH expression in IDH2-high TN breast tumors as a possible therapeutic approach, to be translated in future clinical interventions.
Supplementary Material
Significance:
These findings highlight the metabolic dependence of IDH2 on the serine biosynthesis pathway, adding an important Layer to the connection between TCA cycle and glycolysis, which can be translated into novel targeted therapies.
Acknowledgments
We thank the members of the Geiger lab for the useful discussions. We thank Prof. Eyal Gottlieb and Dr. Saverio Tardito for the assistance in metabolomics analyses. We thank Dr. Segal-Raz for the shRNA constructs. We thank Prof. Karen Avraham for the plasmid px459. T. Geiger was funded by the Israel Science Foundation (grant no.1617/12), the Israeli Center of Research Excellence program (I-CORE, Gene Regulation in Complex Human Disease Center no. 41/11), and the Horizon2020 ERC grant 639534. L. Jerby-Arnon is a Chan Zuckerberg Biohub investigator and holds a Career Award at the Scientific Interface from BWF. L. Jerby-Arnon was a fellow of the Eric and Wendy Schmidt postdoctoral program and a CRI Irvington Fellow supported by the CRI.
Footnotes
Authors’ Disclosures
T. Geiger reports grants from Israel Science Foundation and grants from European Research Council during the conduct of the study. No disclosures were reported by the other authors.
Note: Supplementary data for this article are available at Cancer Research Online (http://cancerres.aacrjournals.org/).
References
- 1.Hanahan D, Weinberg Ra. Hallmarks of cancer: the next generation. Cell 2011; 144:646–74. [DOI] [PubMed] [Google Scholar]
- 2.Warburg O On the origin of cancer cells. Science 1956;123:309–14. [DOI] [PubMed] [Google Scholar]
- 3.Cantor JR, Sabatini DM. Cancer cell metabolism: one hallmark, many faces. Cancer Discov 2012;2:881–98. [DOI] [PMC free article] [PubMed] [Google Scholar]
- 4.Toro JR, Nickerson ML, Wei MH, Warren MB, Glenn GM, Turner ML, et al. Mutations in the fumarate hydratase gene cause hereditary leiomyomatosis and renal cell cancer in families in North America. Am J Hum Genet 2003;73: 95–106. [DOI] [PMC free article] [PubMed] [Google Scholar]
- 5.Astuti D, Latif F, Dallol A, Dahia PL, Douglas F, George E, et al. Gene mutations in the succinate dehydrogenase subunit SDHB cause susceptibility to familial pheochromocytoma and to familial paraganglioma. Am J Hum Genet 2001;69: 49–54. [DOI] [PMC free article] [PubMed] [Google Scholar]
- 6.Abbas S, Lugthart S, Kavelaars FG, Schelen A, Koenders JE, Zeilemaker A, et al. Acquired mutations in the genes encoding IDH1 and IDH2 both are recurrent aberrations in acute myeloid leukemia: prevalence and prognostic value. Blood 2010;116:2122–6. [DOI] [PubMed] [Google Scholar]
- 7.Possemato R, Marks KM, Shaul YD, Pacold ME, Kim D, Birsoy K, et al. Functional genomics reveal that the serine synthesis pathway is essential in breast cancer. Nature 2011;476:346–50. [DOI] [PMC free article] [PubMed] [Google Scholar]
- 8.Locasale JW, Grassian AR, Melman T, Lyssiotis Ca, Mattaini KR, Bass AJ, et al. Phosphoglycerate dehydrogenase diverts glycolytic flux and contributes to oncogenesis. Nat Genet 2011;43:869–74. [DOI] [PMC free article] [PubMed] [Google Scholar]
- 9.Zhang B, Zheng A, Hydbring P, Ambroise G, Ouchida AT, Goiny M, et al. PHGDH defines a metabolic subtype in lung adenocarcinomas with poor prognosis. Cell Rep 2017;19:2289–303. [DOI] [PubMed] [Google Scholar]
- 10.DeNicola GM, Chen PH, Mullarky E, Sudderth JA, Hu Z, Wu D, et al. NRF2 regulates serine biosynthesis in non-small cell lung cancer. Nat Genet 2015;47:1475–81. [DOI] [PMC free article] [PubMed] [Google Scholar]
- 11.Chen J, Chung F, Yang G, Pu M, Gao H, Jiang W, et al. Phosphoglycerate dehydrogenase is dispensable for breast tumor maintenance and growth. Oncotarget 2013;4:2502–11. [DOI] [PMC free article] [PubMed] [Google Scholar]
- 12.Yang H, Ye D, Guan KL, Xiong Y. IDH1 and IDH2 mutations in tumorigenesis: Mechanistic insightsand clinical perspectives. Clin Cancer Res 2012;18:5562–71. [DOI] [PMC free article] [PubMed] [Google Scholar]
- 13.Parsons DW, Jones S, Zhang X, Lin JC, Leary RJ, Angenendt P, et al. An integrated genomic analysis of human glioblastoma multiforme. Science 2008;321:1807–12. [DOI] [PMC free article] [PubMed] [Google Scholar]
- 14.Wise DR, Ward PS, Shay JES, Cross JR, Gruber JJ, Sachdeva UM, et al. Hypoxia promotes isocitrate dehydrogenase-dependent carboxylation of-ketoglutarate to citrate to support cell growth and viability. Proc Natl Acad Sci 2011;108:19611–6. [DOI] [PMC free article] [PubMed] [Google Scholar]
- 15.Jo SH, Son MK, Koh HJ, Lee SM, Song IH, Kim YO, et al. Control of mitochondrial redox balance and cellular defense against oxidative damage by mitochondrial NADP+-dependent isocitrate dehydrogenase. J Biol Chem 2001;276:16168–76. [DOI] [PubMed] [Google Scholar]
- 16.Geiger T, Madden SF, Gallagher WM, Cox J, Mann M. Proteomic portrait of human breast cancer progression identifies novel prognostic markers. Cancer Res 2012;72:2428–39. [DOI] [PubMed] [Google Scholar]
- 17.Altenberg B, Greulich KO. Genes of glycolysis are ubiquitously overexpressed in 24 cancer classes. Genomics 2004;84:1014–20. [DOI] [PubMed] [Google Scholar]
- 18.Guirguis A, Elishaev E, Oh SH, Tseng GC, Zorn K, DeLoia JA. Use of gene expression profiles to stage concurrent endometrioid tumors of the endometrium and ovary. Gynecol Oncol 2008;108:370–6. [DOI] [PubMed] [Google Scholar]
- 19.Lv Q, Xing S, Li Z, Li J, Gong P, Xu X, et al. Altered expression levels of IDH2 are involved in the development of colon cancer. Exp Ther Med 2012;4:801–6. [DOI] [PMC free article] [PubMed] [Google Scholar]
- 20.Megchelenbrink W, Katzir R, Lu X, Ruppin E, Notebaart Ra. Synthetic dosage lethality in the human metabolic network is highly predictive of tumor growth and cancer patient survival. Proc Natl Acad Sci U S A 2015;112:12217–22. [DOI] [PMC free article] [PubMed] [Google Scholar]
- 21.Jerby L, Ruppin E. Predicting drug targets and biomarkers of cancer via genome-scale metabolic modeling. Clin Cancer Res 2012;18:5572–84. [DOI] [PubMed] [Google Scholar]
- 22.Lewis NE, Abdel-Haleem AM. The evolution of genome-scale models of cancer metabolism. Front Physiol 2013;4:237. [DOI] [PMC free article] [PubMed] [Google Scholar]
- 23.Folger O, Jerby L, Frezza C, Gottlieb E, Ruppin E, Shlomi T. Predicting selective drug targets in cancer through metabolic networks. Mol Syst Biol 2011;7:501. [DOI] [PMC free article] [PubMed] [Google Scholar]
- 24.Shlomi T, Benyamini T, Gottlieb E, Sharan R, Ruppin E. Genome-scale metabolic modeling elucidates the role of proliferative adaptation in causing the Warburg effect. PLoS Comput Biol 2011;7:e1002018. [DOI] [PMC free article] [PubMed] [Google Scholar]
- 25.Yizhak K, Gaude E, Le Dévédec S, Waldman YY, Stein GY, van de Water B, et al. Phenotype-based cell-specific metabolic modeling reveals metabolic liabilities of cancer. eLife 2014;3:e03641. [DOI] [PMC free article] [PubMed] [Google Scholar]
- 26.Ran FA, Hsu PDP, Wright J, Agarwala V, Scott Da, Zhang F. Genome engineering using the CRISPR-Cas9 system. Nat Protoc 2013;8:2281–308. [DOI] [PMC free article] [PubMed] [Google Scholar]
- 27.Cox J, Neuhauser N, Michalski A, Scheltema Ra, Olsen JV, Mann M. Andromeda: a peptide search engine integrated into the MaxQuant environment. J Proteome Res 2011;10:1794–805. [DOI] [PubMed] [Google Scholar]
- 28.Tyanova S, Temu T, Sinitcyn P, Carlson A, Hein MY, Geiger T, et al. The perseus computational platform for comprehensive analysis of (prote)omics data. Nat Methods 2016;13:731–40. [DOI] [PubMed] [Google Scholar]
- 29.Perez-Riverol Y, Csordas A, Bai J, Bernal-Llinares M, Hewapathirana S, Kundu DJ, et al. The PRIDE database and related tools and resources in 2019: improving support for quantification data. Nucleic Acids Res 2019;47:D442–D50. [DOI] [PMC free article] [PubMed] [Google Scholar]
- 30.Zur H, Ruppin E, Shlomi T. iMAT: An integrative metabolic analysis tool. Bioinformatics 2010;26:3140–2. [DOI] [PubMed] [Google Scholar]
- 31.Segré D, Vitkup D, Church GM. Analysis of optimality in natural and perturbed metabolic networks. Proc Natl Acad Sci U S A 2002;99:15112–7. [DOI] [PMC free article] [PubMed] [Google Scholar]
- 32.Shenoy A, Belugali Nataraj N, Perry G, Loayza Puch F, Nagel R, Marin I, et al. Proteomic patterns associated with response to breast cancer neoadjuvant treatment. Mol Syst Biol 2020;16:e9443. [DOI] [PMC free article] [PubMed] [Google Scholar]
- 33.Yanovich G, Agmon H, Harel M, Sonnenblick A, Peretz T, Geiger T. Clinical proteomics of breast cancer reveals a novel layer of breast cancer classification. Cancer Res 2018;78:6001–10. [DOI] [PMC free article] [PubMed] [Google Scholar]
- 34.Cox J, Mann M. MaxQuant enables high peptide identification rates, individualized p.p.b.-range mass accuracies and proteome-wide protein quantification. Nat Biotechnol 2008;26:1367–72. [DOI] [PubMed] [Google Scholar]
- 35.Langfelder P, Horvath S. WGCNA: an R package for weighted correlation network analysis. BMC Bioinformatics 2008;9:559. [DOI] [PMC free article] [PubMed] [Google Scholar]
- 36.Jerby L, Wolf L, Denkert C, Stein GY, Hilvo M, Oresic M, et al. Metabolic associations of reduced proliferation and oxidative stress in advanced breast cancer. Cancer Res 2012;72:5712–20. [DOI] [PubMed] [Google Scholar]
- 37.Pozniak Y, Balint-Lahat N, Rudolph JD, Lindskog C, Katzir R, Avivi C, et al. System-wide clinical proteomics of breast cancer reveals global remodeling of tissue homeostasis. Cell Syst 2016;2:172–84. [DOI] [PubMed] [Google Scholar]
- 38.Tyanova S, Albrechtsen R, Kronqvist P, Cox J, Mann M, Geiger T. Proteomic maps of breast cancer subtypes. Nat Commun 2016;7:10259. [DOI] [PMC free article] [PubMed] [Google Scholar]
- 39.Jiang L, Shestov Aa, Swain P, Yang C, Parker SJ, Wang Qa, et al. Reductive carboxylation supports redox homeostasis during anchorage-independent growth. Nature 2016:1–16. [DOI] [PMC free article] [PubMed] [Google Scholar]
- 40.Metallo CM, Gameiro Pa, Bell EL, Mattaini KR, Yang J, Hiller K, et al. Reductive glutamine metabolism by IDH1 mediates lipogenesis under hypoxia. Nature 2011;481:380–4. [DOI] [PMC free article] [PubMed] [Google Scholar]
- 41.Mullen AR, Wheaton WW, Jin ES, Chen P-H, Sullivan LB, Cheng T, et al. Reductive carboxylation supports growth in tumour cells with defective mitochondria. Nature 2011;481:385–8. [DOI] [PMC free article] [PubMed] [Google Scholar]
- 42.Pacold ME, Brimacombe KR, Ham Chan S, Rohde JM, Lewis CA, Y M Swier LJ, et al. A PHGDH inhibitor reveals coordination of serine synthesis and one-carbon unit fate. Nat Chem Biol 2016;12:452–8. [DOI] [PMC free article] [PubMed] [Google Scholar]
- 43.Fendt S-M, Bell EL, Keibler Ma Olenchock Ba, Mayers JR, Wasylenko TM, et al. Reductive glutamine metabolism is a function of the α-ketoglutarate to citrate ratio in cells. Nat Commun 2013;4:2236. [DOI] [PMC free article] [PubMed] [Google Scholar]
- 44.Wang C, Wan X, Yu T, Huang Z, Shen C, Qi Q, et al. Acetylation stabilizes phosphoglycerate dehydrogenase by disrupting the interaction of E3 Ligase RNF5 to promote breast tumorigenesis. Cell Rep 2020;32:108021. [DOI] [PubMed] [Google Scholar]
- 45.Jiang L, Boufersaoui A, Yang C, Ko B, Rakheja D, Guevara G, et al. Quantitative metabolic flux analysis reveals an unconventional pathway of fatty acid synthesis in cancer cells deficient for the mitochondrial citrate transport protein. Metab Eng 2017;43:198–207. [DOI] [PMC free article] [PubMed] [Google Scholar]
- 46.Reid MA, Allen AE, Liu S, Liberti MV, Liu P, Liu X, et al. Serine synthesis through PHGDH coordinates nucleotide levels by maintaining central carbon metabolism. Nat Commun 2018;9:5442. [DOI] [PMC free article] [PubMed] [Google Scholar]
- 47.Yoshino H, Nohata N, Miyamoto K, Yonemori M, Sakaguchi T, Sugita S, et al. PHGDH as a key enzyme for serine biosynthesis in HIF2alpha-targeting therapy for renal cell carcinoma. Cancer Res 2017;77:6321–9. [DOI] [PMC free article] [PubMed] [Google Scholar]
- 48.Wei L, Lee D, Law CT, Zhang MS, Shen J, Chin DW, et al. Genome-wide CRISPR/Cas9 library screening identified PHGDH as a critical driver for sorafenib resistance in HCC. Nat Commun 2019;10:4681. [DOI] [PMC free article] [PubMed] [Google Scholar]
Associated Data
This section collects any data citations, data availability statements, or supplementary materials included in this article.